Share your thoughts
placeholder
Article
Black Friday Bitcoin-Ethereum plunge, ZEC breaks out and spikes on the weekend daily chart!
The short-term market can be said to have laid its cards on the table; after SanDisk-Micron strengthened, can there still be a reversal next week?
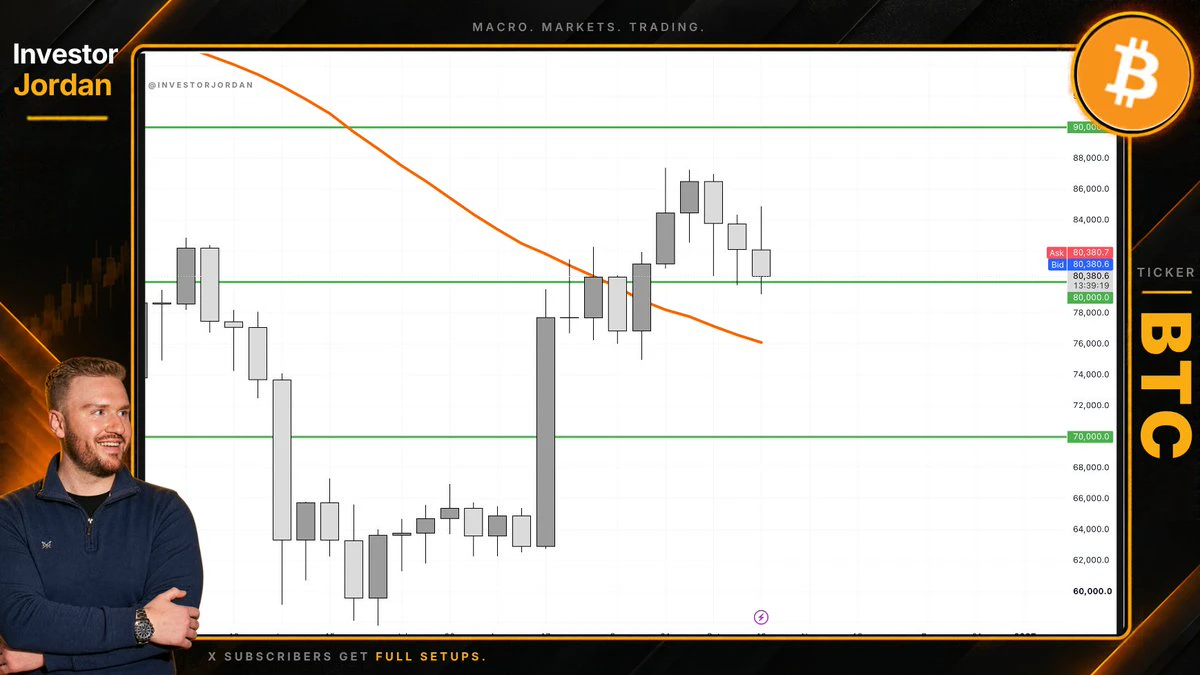
On the daily chart, Bitcoin broke above the previous high before plunging below 79000. On the weekly chart, driven by softer yields, a weaker dollar, and fewer hawkish remarks from the Federal Reserve, U.S. stock SanDisk staged a sharp rebound. However, Friday’s U.S. nonfarm payrolls came in stronger than expected, reigniting expectations of a rate hike in Se
post-image
BTC+0.25%
there is a @world_xyz where onchain prediction becomes super fast as speed of light
you are already in it
post-image
$BTC Signal】Bullish absorption + order-book imbalance, lie in wait in the sniper range
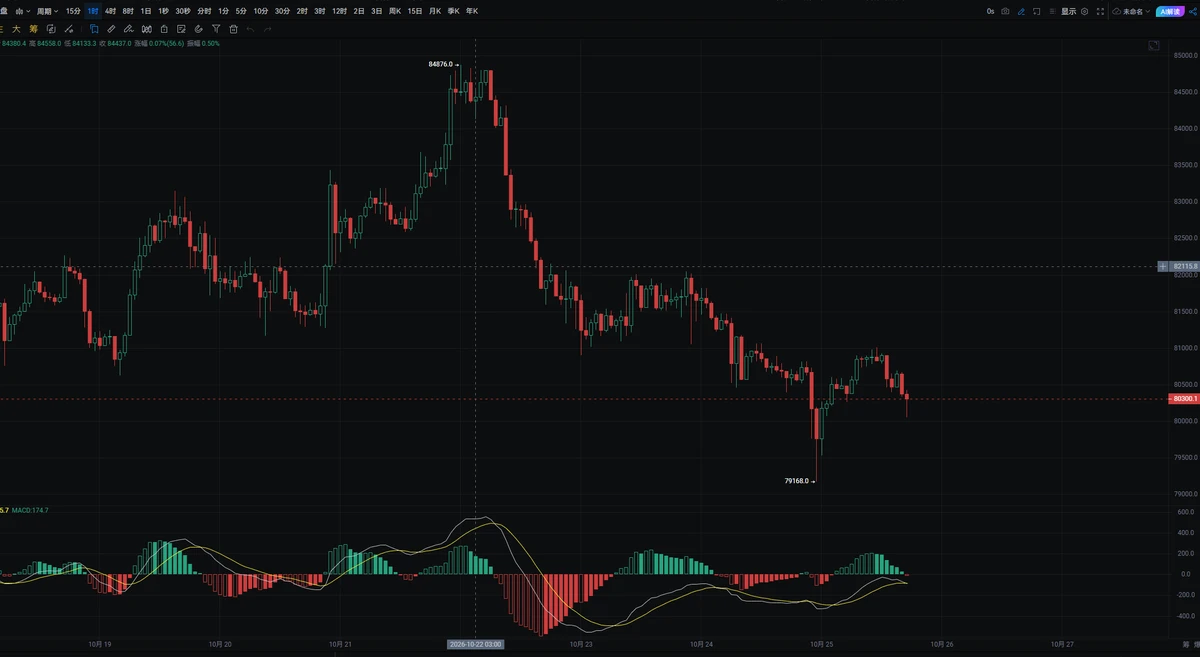
$BTC The order-book buy-side ratio is 2.87x, with a 48.25% depth imbalance. Buy orders are concentrated below, but the price has not broken below EMA50. The 1H MACD histogram has contracted continuously, with bearish momentum not yet spreading. The funding rate is 0.0020%, OI is stable, and short-squeeze conditions are not yet fully mature. The 4H Bollinger Bands are tightening, with range-bound movement awaiting a breakout.
🎯Direction: Long
⚡Entry/limit orders: 79630-79800, scale in for the sniper entry
post-image
BTC+0.25%
Astra is still pretty hot... Even OpenAI, which often gives away reset quotas, is starting to struggle a bit.
post-image
Live trading - Analysis Crypto market
live-cover
LIVE2,188
$BTC 🔥
Bitcoin is testing a major weekly resistance zone around $80.4K–$80.8K after a powerful rebound to $79,835 (+2.77%).
⚡ Key Levels:
Resistance: $80.4K–$80.8K
Support: $78.2K–$78.5K
Major Support: $74.0K–$74.5K
Deep Support: $66.0K–$66.5K
A weekly breakout above $80.8K could open the door toward $82K+. But rejection here may send BTC back toward $78K or even $74.5K.
🚀 BTC is at the decision point — breakout or rejection?
post-image
BTC+0.21%
GM to everyone ☀️
Happy sunday
post-image
$UNI Uniswap · the New Uptrend Intensifies
UNIUSDT (Uniswap) has been rising for more than two months. After a major flush October 2025, this chart setup shows a long-term double-bottom process, the double-bottom being the second half of the chart leading to present day. Notice that this portion can also be read as an inverted head & shoulders pattern which is also a bullish-reversal signal.
In just 2 months (66 days), UNIUSDT recovered 11 months (329 days) of declining prices within a strong downtrend. Uniswap is now green establishing a new uptrend.
Trading volume has been rising steadily si
post-image
UNI+11.10%
A wallet suspected to be affiliated with a16z has added to its HYPE position again, with total holdi
live-cover
LIVE1,391
Everyone’s staring at Bitcoin, but this 4h chart on ETH/USDT is quietly screaming something else.

ETH/USDT - SHORT

Trade Plan:
Entry: 2489.83 – 2496.05
SL: 2522.75
TP1: 2470.58
TP2: 2455.67
TP3: 2433.31

Why this setup?
Why now? The 1D trend is range-bound, but the 4h bias flips SHORT at 55% confidence. RSI on the 15m sits at 44.24—weak momentum, no bounce fuel. Entry zone 2492.94 with a tight ATR of 12.42 means volatility is compressed; the path of least resistance is down toward TP1 at 2470.58 and TP2 at 2455.67. The invalidation at 2467.53 is below TP2, so if we break that, the bear th
ETH+1.56%
$IOST Signal】4H momentum continuation, 1H low-volume pullback
$IOST 4H RSI above 90, MACD bullish histogram expanding, with price consolidating at elevated levels after breaking above the upper Bollinger Band. 1H MACD histogram narrowing, bid depth share at 0.44, with sell orders clearly dominant. Funding rate 0.01%, OI stable, with no signs of a liquidation cascade for now. The current price of 0.0007782 is within the recommended entry range, while the 1H low at 0.00073 forms short-term support. Dense selling pressure is concentrated at 0.00079-0.00080 above.
🎯Direction: Long
⚡Entry/limit o
post-image
IOST+23.20%
MARKET ALERT - DOT (POLKADOT)
DOTUSDT is showing a very strong bullish trend on both the 1-hour and 5-minute timeframes. The current price is around 0.941, with the Exponential Moving Averages (EMA 20, 50, and 200) neatly aligned upward, indicating that buying momentum remains dominant.
​1-Hour Timeframe Analysis
The medium-term trend structure is very positive, with the price positioned above EMA 20 (0.920). The nearest resistance level is at 0.942. If this level is successfully broken with high volume, the price could continue rising further.
​5-Minute Timeframe Analysis
The short-term move
DOT+4.00%
THETA+1.01%
SENT-0.15%
  • 6
#BTC
Look at this 5D Bitcoin chart.
In April 2017, BTC was around $ 1,000. By December 2017, it had reached nearly $ 20,000 — around a 20x move in just 8 months.
The interesting part is not just the price increase. It is what the mining industry looked like during that early phase. Mining infrastructure was much smaller, and the economics were very different compared with today.
This chart is a good reminder that Bitcoin has historically gone through explosive expansion phases after long periods of accumulation.
If BTC enters another major expansion cycle, the companies and infrastructure supp
post-image
BTC+0.25%
bitcoin:native
Taking a long scalp here,
Might be a bit early but imo we are going to push higher towards 82K soon
post-image
BTC+0.21%
Everyone’s chasing LAB/USDT longs—but the 4h tape is screaming something else.

LAB/USDT - SHORT

Trade Plan:
Entry: 0.0722 – 0.0726
SL: 0.0746
TP1: 0.0707
TP2: 0.0696
TP3: 0.0680

Why this setup?
- RSI on 15m is crushed at 23.14—momentum is exhausted, not reversing.
- 1D trend is bearish, and price is hugging 0.0724 with TP1 at 0.0707.
- ATR (1h: 0.000918) shows room to slide, not bounce.
- Why now? The “Armed” status at 95% confidence means the setup is loaded—waiting for the breakdown, not the breakout.

Debate:
Are you fading this dip to 0.0680, or buying the 0.0707 support like
post-image
LAB-3.71%
Everyone’s staring at the range, but $ASTER /USDT’s 15m RSI just whispered a secret most traders will ignore.

$ASTER /USDT - SHORT

Trade Plan:
Entry: 0.7663 – 0.7755
SL: 0.8147
TP1: 0.7380
TP2: 0.7161
TP3: 0.6832

Why this setup?
- 4h bias is SHORT (55% conf), but 1D is *range*—traps are the default.
- RSI 15m at 36.77 shows weak bounce fuel; ATR 1h (0.018) is thin, so moves are quick and dirty.
- Entry ref 0.7709 sits mid-range. TP1 at 0.7380 is the first real magnet, but invalid below 0.7423 flips the script.
- Why now? The "Armed" status means the algo is waiting for a liquidity
ASTER+2.47%
$AKE Hold it, don’t get shaken out; holding spot through the bull market for 1000x is no problem.
AKE-16.77%
Everyone’s watching BTC/USDT at 79.8K—but the real money is made when the range breaks, not when it holds.

BTC/USDT - SHORT

Trade Plan:
Entry: 79821.35 – 79931.21
SL: 80403.59
TP1: 79480.80
TP2: 79217.15
TP3: 78821.67

Why this setup?
Why now?
- 4h bias is SHORT with 55% conviction—not a slam dunk, but the setup is tightening.
- Entry zone 79,876 with TP1 at 79,480 and TP2 at 79,217—that’s a clean 0.8% scalp if momentum follows.
- RSI 15m at 53.17 shows no overbought panic, leaving room to drop before buyers step in.
- 1D trend is range—so we’re not fighting a trend, we’re playing
BTC+0.25%
GM ILOVE PUPPIES🐶🐶🐶#美国8月非农超预期
post-image
  • 6
Load More

Join 40 M users in our growing community

⚡️ Join 40 M users in the crypto craze discussion

💬 Engage with your favorite top creators

👍 See what interests you

View More