Square
Following
Hot
News
Notifications
Profile
Share your thoughts
placeholder
Article
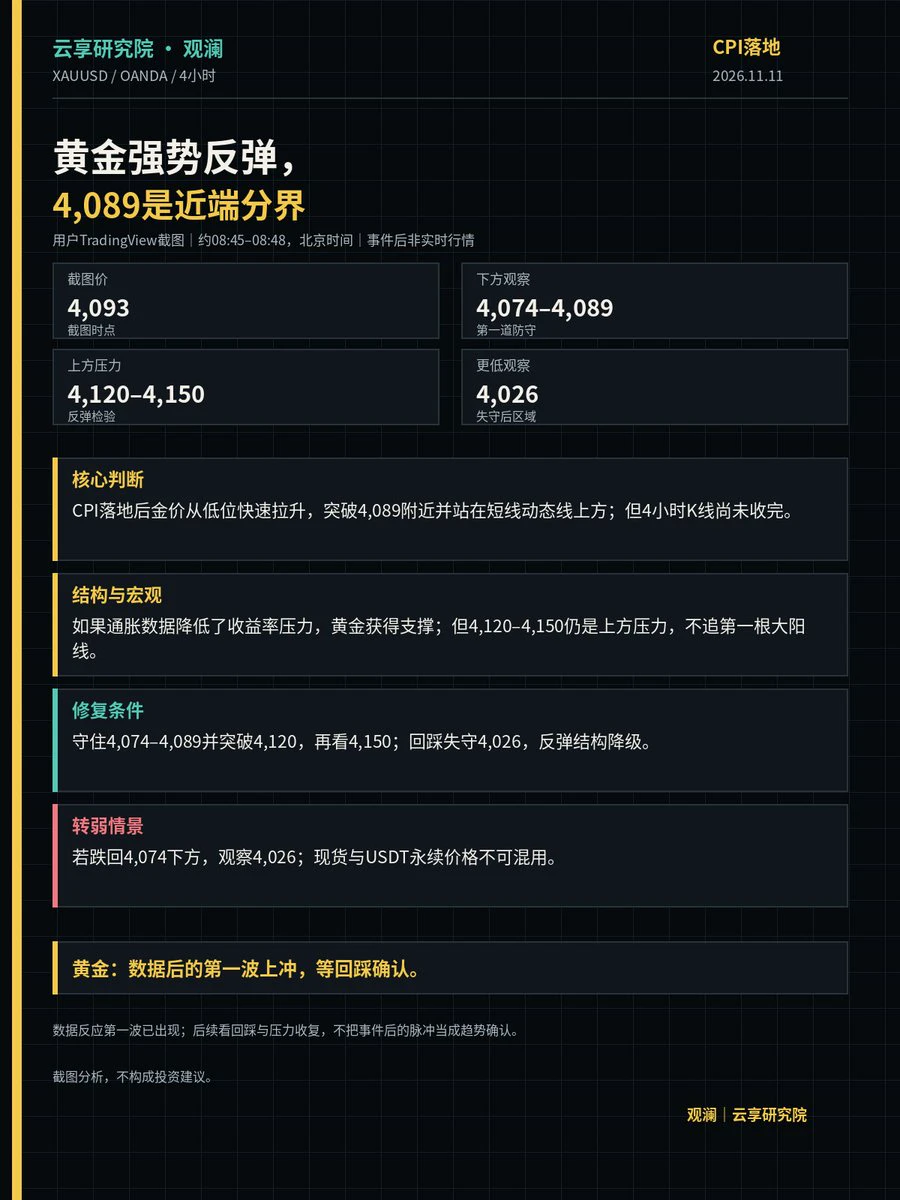
CPI Is Out | Gold Rebounds Strongly】

After the data was released, gold rallied quickly from its lows and moved back above the short-term dynamic moving average, with short-term bullish sentiment clearly recovering.

But it’s still too early to treat the first rally as a trend reversal. The key resistance zone above is 4,120—4,150, while support on a pullback is around 4,074—4,089.

If gold holds 4,074—4,089 and then breaks above 4,120, the rebound structure could continue to recover. If it falls back below 4,074, watch for a pullback toward around 4,026, as the short-term structure could weak
post-image
GLDX-0.40%
PAXG+0.37%
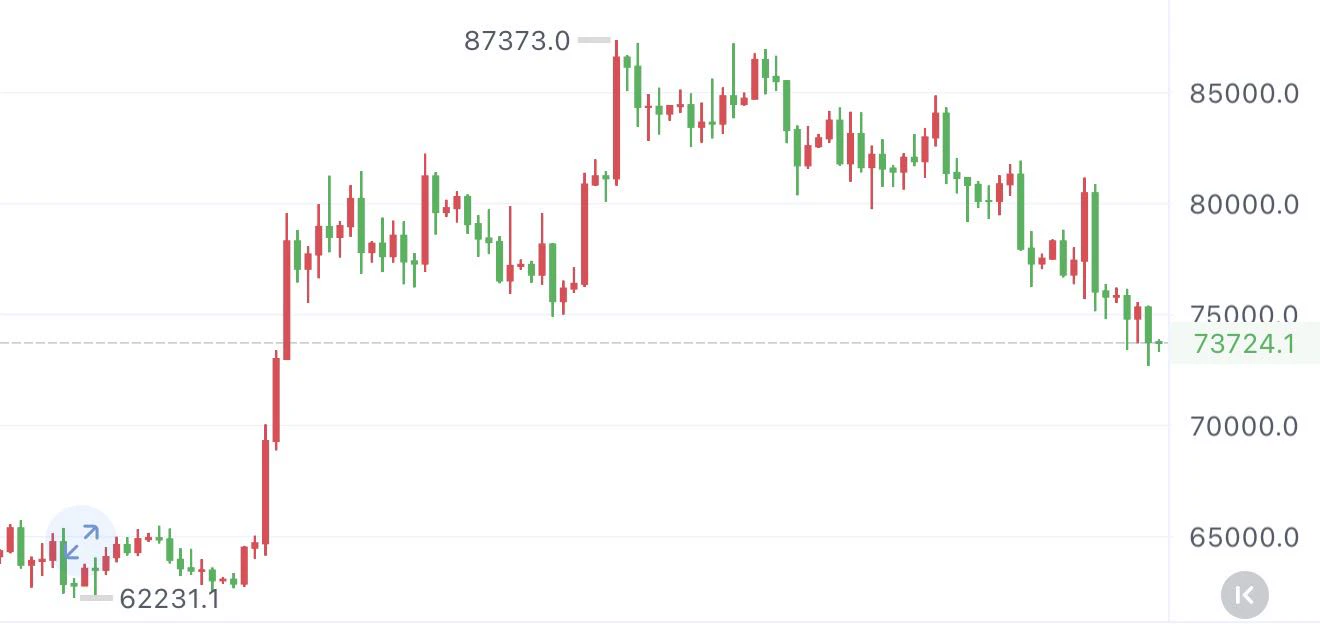
A brief analysis of BTC's short-term trend based on Dow Theory, Chan Theory, Elliott Wave Theory, volume-price relationships, order flow, and price action (strategy recommendations)
Comprehensive assessment
Dow Theory confirms that the bearish trend accelerated after the false breakout at 75,411; 72,691 is the new panic low
Chan Theory confirms a top fractal at 75,411; the bottom fractal at 72,691 remains to be validated
Elliott Wave Theory: Subwave ③ of Wave C's fifth subwave is super-extended; subwave ④ failed at 75,411; subwave ⑤ target: 70,000-71,000
Volume-price relationship: the sharp pl
BTC-0.67%
Trenches
mihao
m
bade
b
mihao
4Cxj...pump
Market Cap
$.
Change
.
24h Vol
$.
Holders
.
PIEVERSE
P
bade
b
PIEVERSE
0x0e...25a9
Market Cap
$.
Change
.
24h Vol
$.
Holders
.
X
X
bade
b
X
9VZe...pump
Market Cap
$.
Change
.
24h Vol
$.
Holders
.
DacityCoin
D
bade
b
DacityCoin
DKYc...pump
Market Cap
$.
Change
.
24h Vol
$.
Holders
.
牛逼
牛
bade
b
牛逼
0x96...7777
Market Cap
$.
Change
.
24h Vol
$.
Holders
.
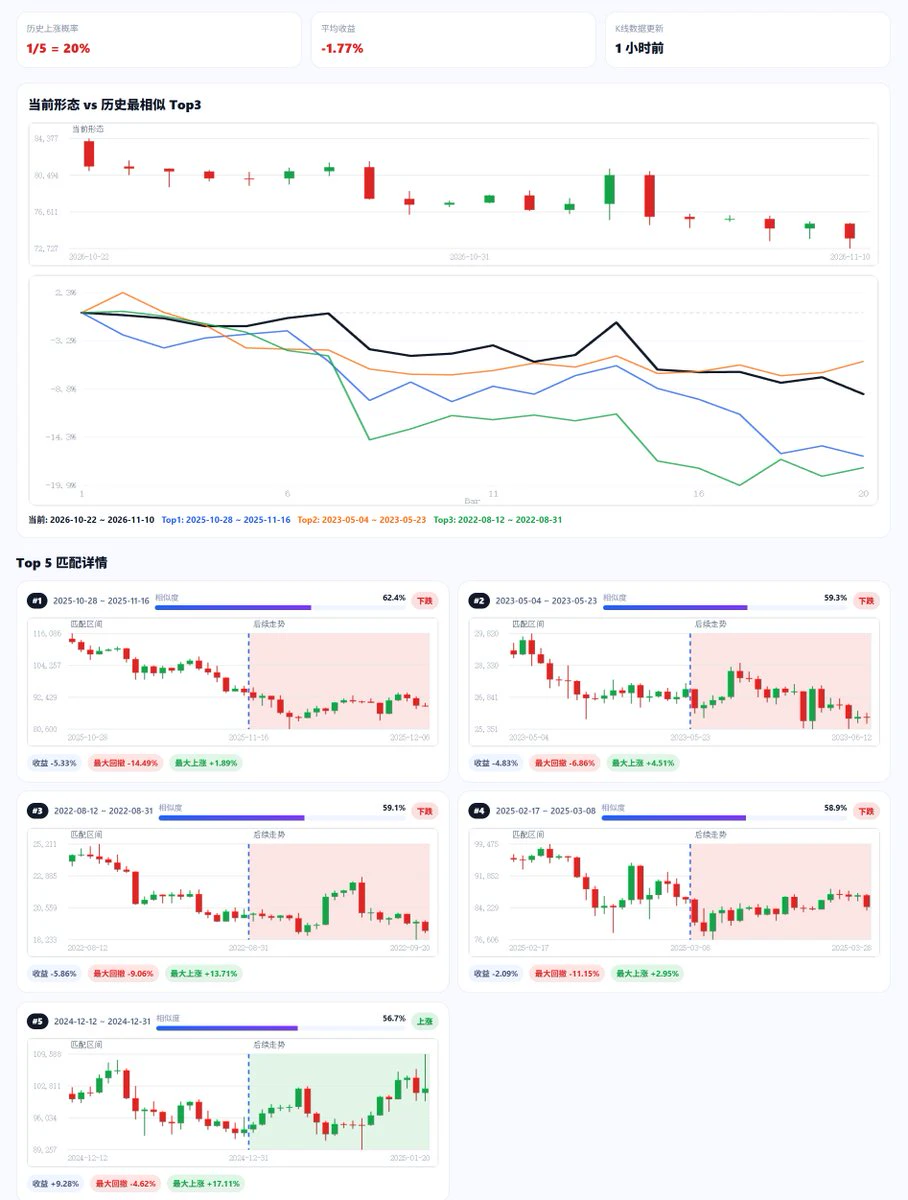
Does the recent market action feel a little familiar?
Have you seen this candlestick pattern before?
Try the candlestick pattern-matching feature on Jieni Network. It combines multiple algorithms to scan six years of BTC historical data in seconds and find the periods with the most similar price action—then show you what happened next.
The current outlook isn’t very promising: the probability of a rise over the next 20 days is just 20%...
🔗: JN188, tap AI
post-image
BTC-0.67%
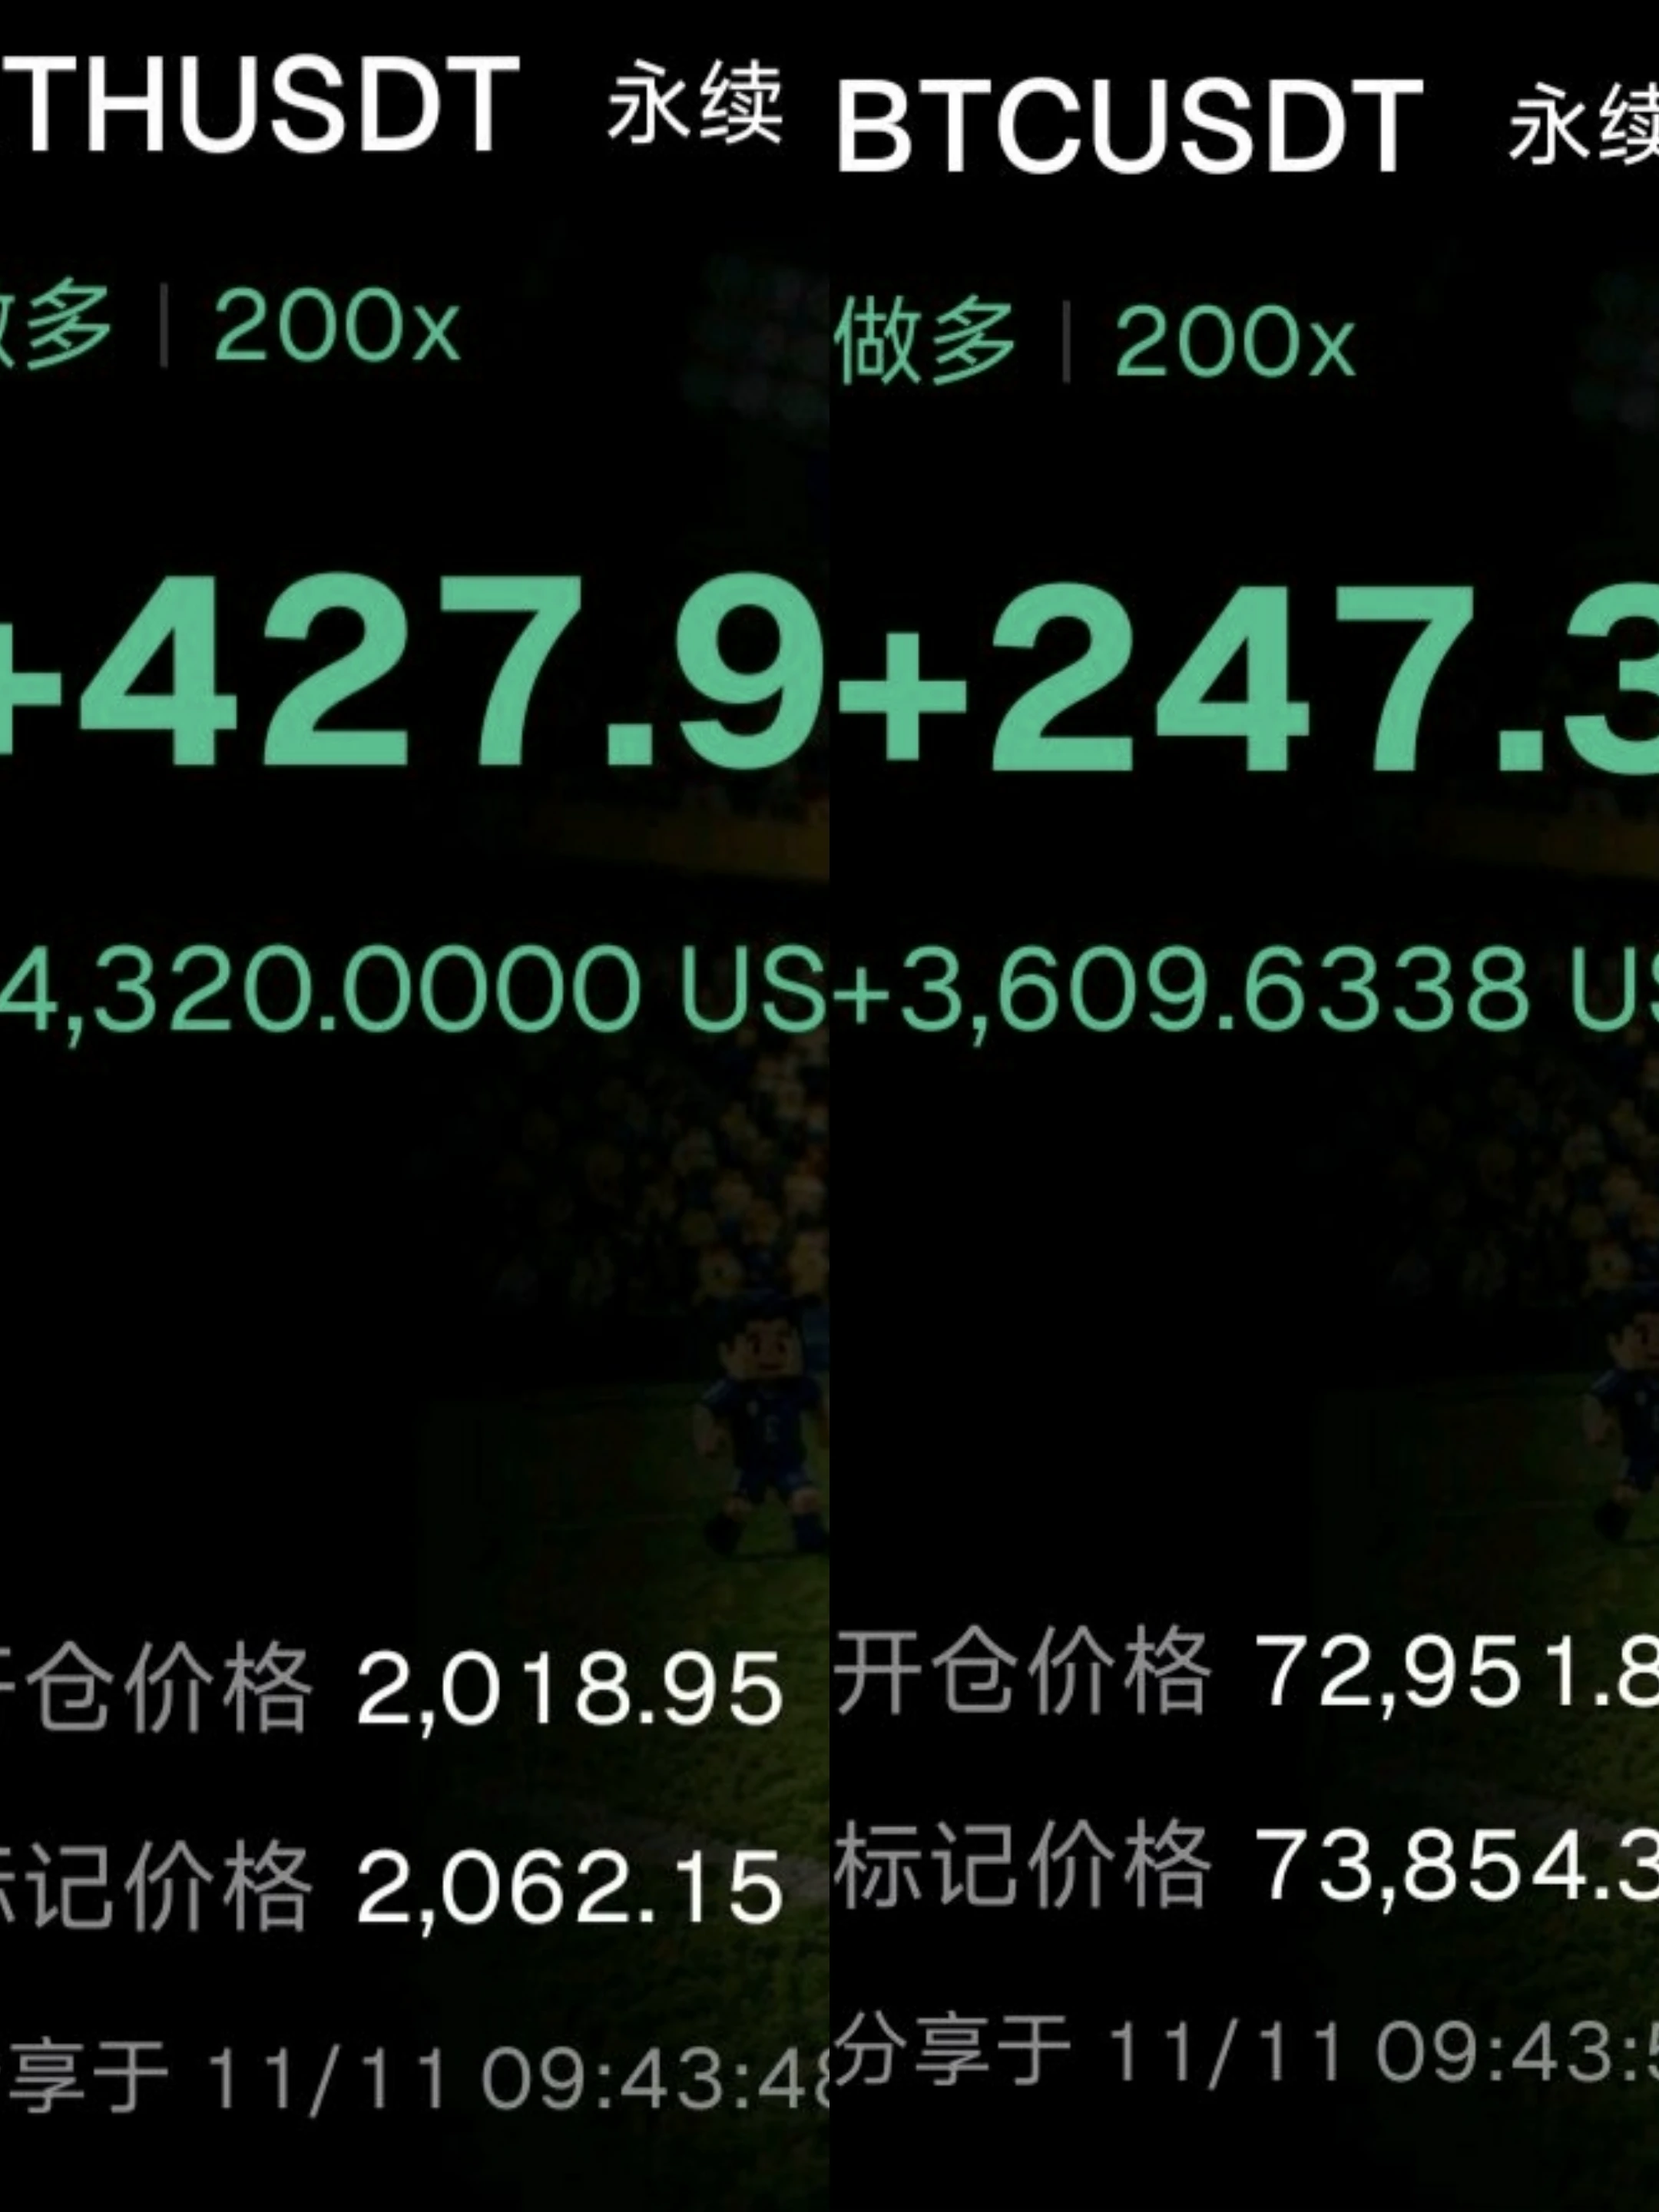
I Got It My Futures Copy Trading Project 14 / 20010 USDT minimum follow Public 7-day P&L (USDT): 1220.05 7-day return: +244.00% Assets under management: $4853.02 Win rate: 93.33%
post-image
11.11 ETH Market Analysis

Short: around 2070-2090, stop loss at 2120, targets 2010/1980.

ETH is currently at 2052. After plunging from 2115 and bottoming at 2004, it is now in a weak low-level rebound. Buying volume during this recovery is clearly insufficient, and the moving average system overhead is exerting downward pressure. The overall bearish structure has not reversed.

The current price is in the middle of the range, so entering directly could easily get you shaken out. The 2070-2090 area above is both a secondary consolidation zone during the earlier sharp drop and a zone of heavy
post-image
ETH-1.23%
🔹Anthropic Could Go Public as Early as November 20! IPO Valuation Expectations Continue to Cool. Ca
live-cover
LIVE2,989
🌈 Gate Live Livestreaming Inspiration - November 11

Popular Topics:
🔹U.S.-listed AI supply chain stocks plunge across the board! Nvidia drops over 5%, while IREN tumbles nearly 8%—will they keep sliding?
🔹Anthropic IPO valuation surges to $1.5 trillion again! The more AI stocks fall, the higher mega-IPO valuations climb. Will the market still buy in?
🔹Anthropic IPO valuation heads toward $1.5 trillion! The harder AI stocks fall, the higher the IPO pricing gets. Will investors still dare to buy?
🔹BTC falls below $71k, putting $600 million in long positions at risk of liquidation! Which ke
post-image
NVDA-5.47%
IREN-7.79%
BTC-0.65%
ETH-1.26%
GS+0.44%
  • 5
  • 1
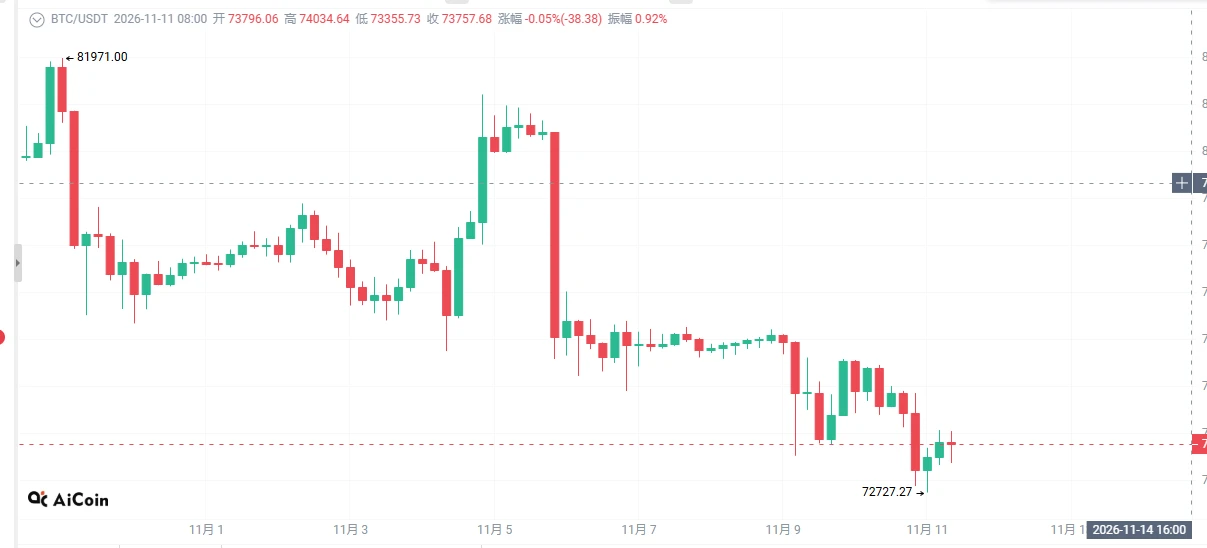
A guy DM’d me this morning: Is 72,700 the bottom?
I replied: Yesterday’s wick already had the answer written right there.

Yesterday’s low was 72,727, breaking below November 8’s 73,510 by $780. Then it rallied back to close at 73,796; today it’s currently at 73,648.

When price recovers after breaking below a level, that’s not a breakdown—it’s a test. It pierced the same level twice in 24 hours, which shows there are indeed buyers stepping in below.

But they’re just catching the fall, not buying. The funding rate just went from +0.0059% back to +0.008%, and not a single long has exited—the p
post-image
BTC-0.65%
  • 1
Nov 11: BTC’s oversold rebound lacks momentum; short into resistance with the trend
Today’s outlook
Entry: Price rebounds to the 74500-74700 range
Stop-loss: 75000
First target: 73800-73600
Second target: 73000-72800.
Key takeaway
Saudi state television Al Arabiya reported on November 10 that the US and Iran had reached a preliminary consensus on uranium enrichment: the US would allow Iran to enrich uranium domestically at a concentration of 3.67%, which Iran has accepted. The two sides will also advance efforts to allow International Atomic Energy Agency inspectors to return to Iran. Expectat
post-image
BTC-0.67%
$BTC $ETH | A rebound recovery does not mean a trend reversal

During the morning session, we opened short positions around 73,600, focusing on the rebound recovery after short-term resistance. As the price gradually climbed, we added to the position around 74,000, adjusting the average entry price for the overall position to around 73,800. The short-term target is 73,200.

The core logic behind this setup is clear: don’t blindly chase shorts. Wait for the price to rebound, observe whether it faces resistance overhead, and then look for a more suitable entry point.

Under the current strate
post-image
BTC-0.67%
ETH-1.23%
#GateGlobalComplianceExpansion
Gate Group (Gate.io) has shifted from pure rapid growth into a deliberate, multi-entity, regulatory-first global expansion model. Instead of relying on a single offshore structure or grey-area operations, the platform is building localized, licensed entities across key financial jurisdictions. This is not just checkbox compliance — it is becoming a core competitive moat as the industry moves into a more regulated phase.

Core Regional Compliance Footprint

**European Union**
Gate Technology Ltd (Malta) holds MiCA Crypto-Asset Service Provider authorization (I
11.11 XAUUSD Asia-Europe Session Outlook$XAUUSD

Last night's CPI data was bearish, triggering a plunge of dozens of points. For today, first look for an oversold rebound intraday, then consider shorts. Traders focused on the daily and weekly timeframes can consider opening positions here.

Support: around 4015-4028 (4h), 3952-3975 (1day),

Resistance: around 4075 (1h, 4h), 4105-4111 (4h), 4142-4150 (1h, 4h), 4190-4217 (4h), 4256-4280 (1day, 1week)
post-image
XAUUSD+0.32%
Up early to watch the market and caught an early move.

Signal: go long at 733-734; the client entered at 73326. A quick rally followed, and they exited at 73976, locking in a 650-point move.

Don’t overstay the trade or get greedy—the quick, decisive pace of this early-session trade was just right. $BTC #Gate全球合规版图扩展
BTC-0.65%
Mountains and seas may separate us, but our hearts know no boundaries.

We come from different places, united by the same hope.

The ship of Pi Life shines thanks to every fellow traveler.

Across mountains and seas, we journey onward together!🚢
market update
live-cover
LIVE2,179
Today's strategy is to go long around 73,000. Today's price action is likely to be a corrective rebound, with no downward move$BTC
post-image
BTC-0.65%
Why does Bitcoin's decline drag down the entire crypto market?
Many investors have the same question: Why do Ethereum, SOL, and many altcoins often fall along with Bitcoin when it declines, sometimes dropping far more than Bitcoin?
There are four main reasons behind this.
First, Bitcoin is the crypto market's core asset. It has the largest market capitalization and significant institutional participation, and is an important gauge of market risk appetite. When Bitcoin falls steadily, investors typically reduce their exposure to risk across their entire crypto portfolio.
Second, market liquidit
post-image
BTC-0.65%
ETH-1.26%
SOL-0.77%
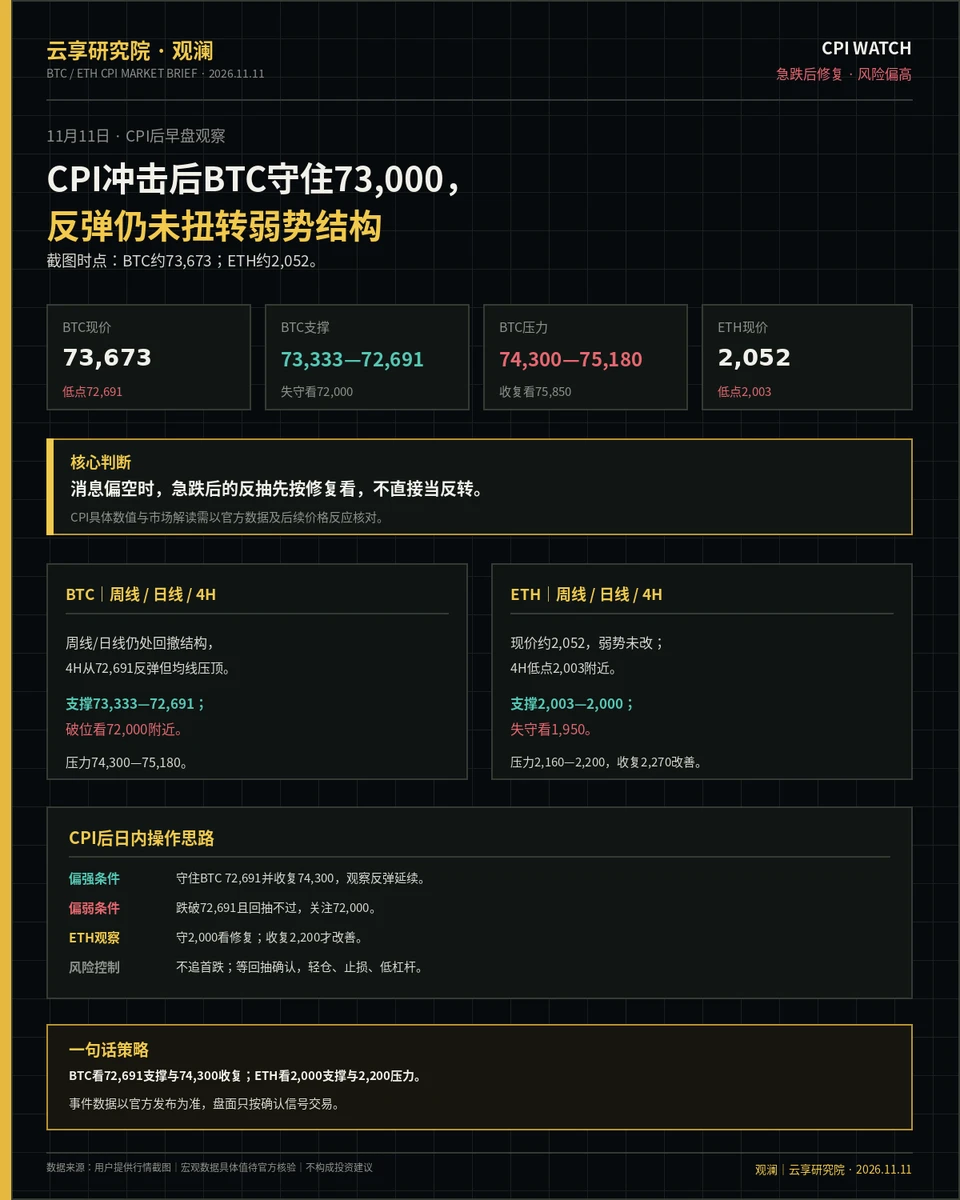
【November 11 | Post-CPI BTC / ETH Morning Market Watch】
At the time shown in the screenshot provided by the user, BTC was around $73,673. The daily and weekly charts remain in a pullback structure. On the 4-hour chart, BTC has rebounded from a low of 72,691 but remains below several moving averages. If the market continues to trade the CPI release as bearish news, a stronger dollar and higher Treasury yields could weigh on risk assets. The specific data and market interpretation should be confirmed against the official release and actual price action.
BTC support: 73,333–72,691; if that gives
post-image
BTC-0.67%
ETH-1.26%
Load More

Join 40 M users in our growing community

⚡️ Join 40 M users in the crypto craze discussion

💬 Engage with your favorite top creators

👍 See what interests you

Trending Topics

GateGlobalComplianceExpansion

11.61k Views288 Discussing

Gate continues to expand its global compliance footprint, now covering 81 regulated jurisdictions across Europe, North America, Asia, and Oceania. From MiCA and U.S. state-level MTLs to Japan’s FSA, Dubai, and Australia-related regulatory approvals, global exchanges are entering a new stage of compliance competition. Do you think regulatory strength will become as important as products and liquidity for exchanges in the future?

USOctoberCPIBeatsExpectations

77.03k Views2.47k Discussing

AnthropicIPOValuationCouldReach1.4T

8.88k Views1.54k Discussing

View More