



Square
Following
Hot
News
Notifications
Profile
Share your thoughts
placeholder
Article
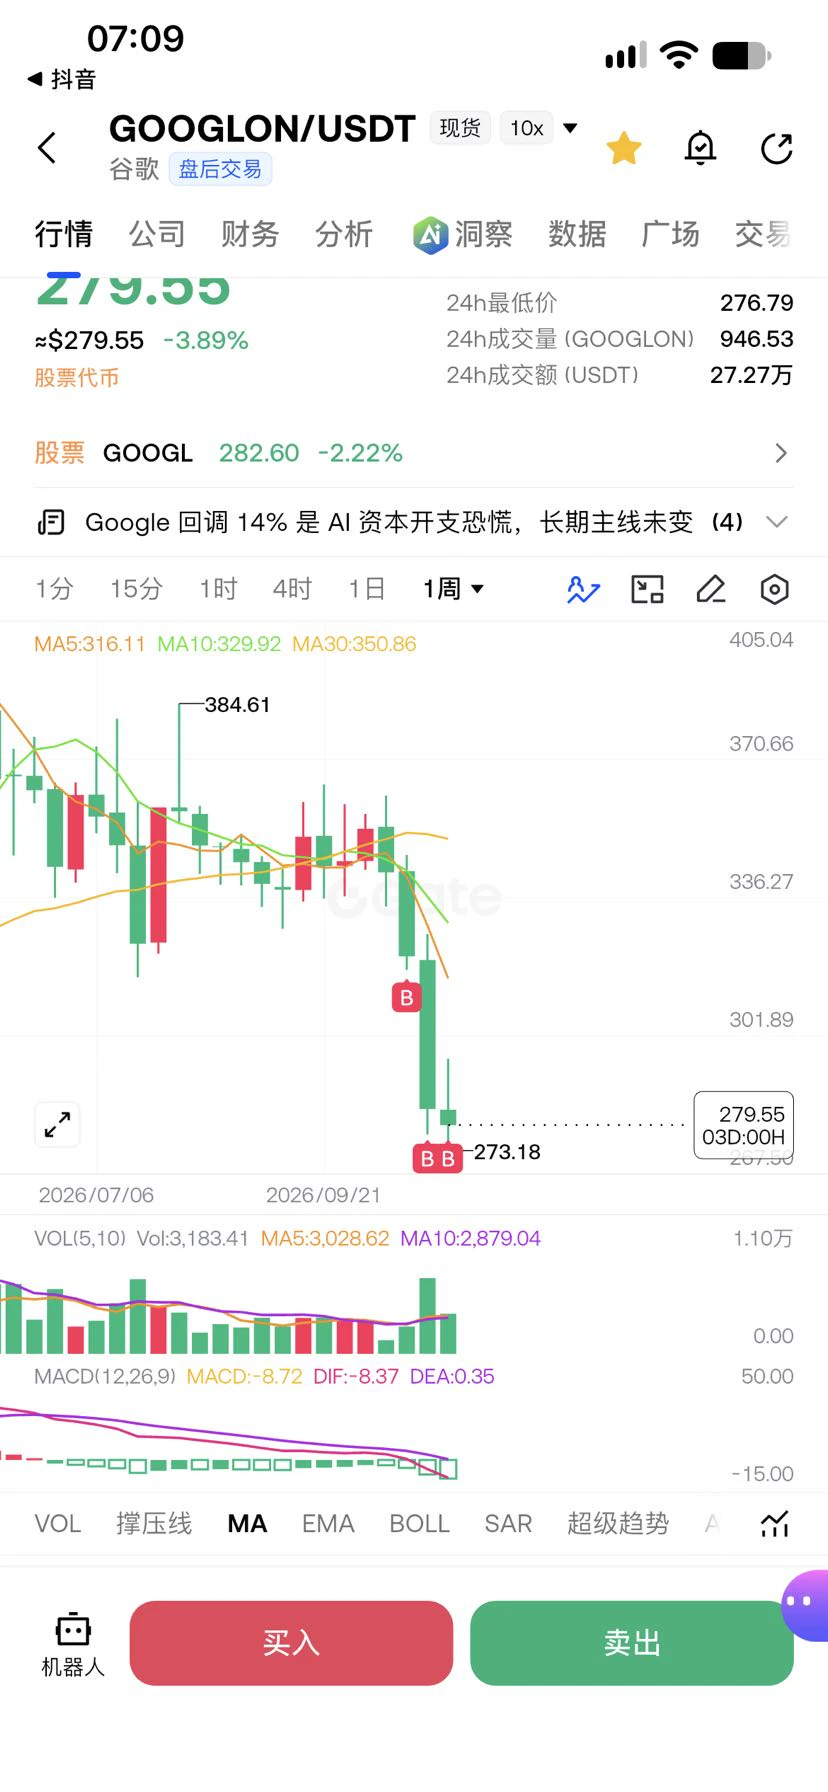
95.3% of liquidations were longs! The traders who chased longs above $60 on $SOXL are trapped—your principal is being “slowly tortured” by Wall Street!

Don’t use your hard-earned money to pay for a 3x-leveraged plunge. What you think is holding on is actually handing your head to the big players!

Market-wide liquidations totaled $21.94 million in 24 hours, with long liquidations reaching 95.3%! If you chased SOXL longs above $60, it’s now at $46.5, leaving you down over 22%. This isn’t a pullback; it’s a targeted slaughter by 3x leverage.

Why such a brutal drop? Three major risks hit at on
SOXL-1.16%
  • 8
  • 2
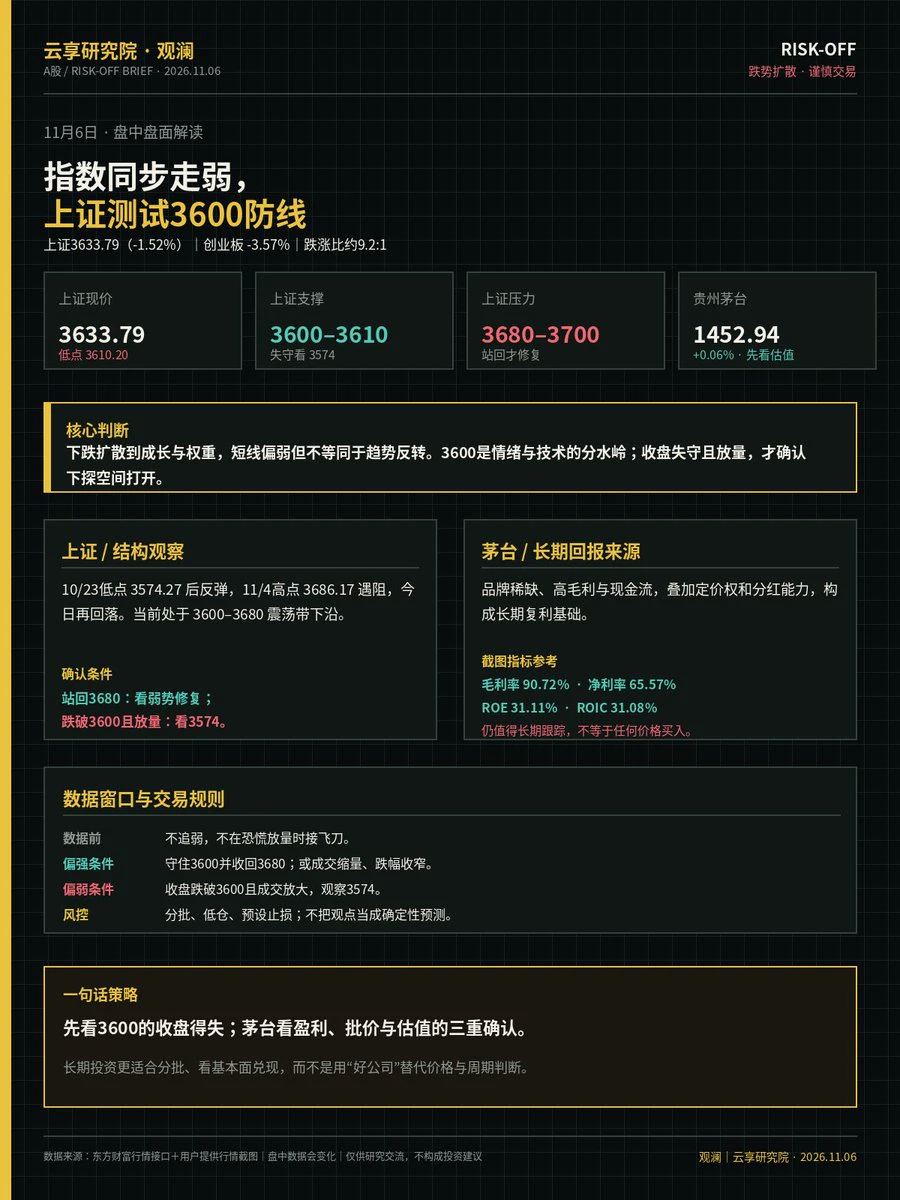
【Yunxiang Research Institute · Guanlan | Nov. 6 Intraday A-Share Market Commentary】
Major indexes weakened in tandem, with the Shanghai Composite testing the 3,600 support level.
Shanghai Composite 3633.79 (-1.52%), ChiNext Index -3.57%; 229 advancers and 2109 decliners, a decline-to-advance ratio of approximately 9.2:1, indicating a marked contraction in risk appetite.
Shanghai Composite: 3600–3610 is the first support zone. A close below this range on higher volume would put 3574 in focus as the next area to watch. 3680–3700 is resistance on a rebound; a return above this range would signal
post-image
Trenches
ZIG
Z
bade
b
ZIG
0x8c...1145
Market Cap
$.
Change
.
24h Vol
$.
Holders
.
BTC
B
bade
b
BTC
C5xp...pump
Market Cap
$.
Change
.
24h Vol
$.
Holders
.
CORLA
C
bade
b
CORLA
0xba...7777
Market Cap
$.
Change
.
24h Vol
$.
Holders
.
STONK
S
bade
b
STONK
6GmA...UNgx
Market Cap
$.
Change
.
24h Vol
$.
Holders
.
DESSA
D
bade
b
DESSA
npz2...pump
Market Cap
$.
Change
.
24h Vol
$.
Holders
.
#Gate上线台股交易 The Stock Contract Market Is Growing Faster Than Its Risk Controls
Gate says its stock contract lineup now covers more than 500 stocks, spanning US, Hong Kong, Korean, Japanese and Taiwanese names. It also reports that SPCX, SKHYNIX, SNDK and SOXL rank near the top for open interest, and that a first batch of 40 assets is live in its Innovation Zone with leverage up to 75x. I could not independently verify those figures, so treat them as Gate's own claims. The bigger question is what that growth means for risk.

The price action that makes the question urgent

The feed's 5 November
SPCX+0.20%
SKHYNIX+1.41%
SNDK-22.24%
NVDA-9.33%
  • 3
BTC Outlook for the Coming Year: Analysis of Three Possible Market Scenarios!

In the cryptocurrency market, many investors want to know in advance how high BTC will rise over the coming year. But predicting prices is never simple. Rather than trying to set a definite target, it is better to analyze several possible scenarios based on different market conditions.

First, the bullish scenario: Continued inflows. If global liquidity conditions improve, institutional funds continue to flow in, and market demand keeps growing, BTC could regain upward momentum. In this case, the market may have an
post-image
BTC-0.67%
What Is Triangular Arbitrage? How Can You Find Opportunities Using Price Relationships Among Three Trading Pairs, and Why Can Trading Fees Turn Theoretical Profits Into Losses?

In the cryptocurrency market, price relationships between different trading pairs on the same exchange can sometimes briefly become misaligned. Triangular arbitrage takes advantage of this discrepancy by completing three consecutive trades to exchange assets, with the aim of ending up with more of the starting asset. But spotting a price gap does not necessarily mean you can make a profit.

First, what is triangular ar
post-image
BTC-0.67%
ETH-1.26%
NEW STREAMER(Market Update)
live-cover
LIVE1,450
#美股史诗级抛售 #10月非农数据聚焦 #作手分析 #WCTCS9 $NAS100 ‌
🔥 US stocks and crypto plunge across the board, trapping long positions! Crisis or long-term opportunity? Trader breaks down three key reasons behind the sell-off
Trading watchlist: $BTC $ETH $NVDA $GOOGL $ANTHROPIC
On November 5, US stocks and crypto markets suffered a sharp sell-off. The Nasdaq fell 5.52%, the Philadelphia Semiconductor Index plunged 12.3%, and NVDA fell about 9%, while semiconductor stocks such as MU and AMD fell even more. BTC dropped below $76,000, while ETH, HYPE and others also pulled back sharply.
I don't hide my live
Trader
#美股史诗级抛售 #10月非农数据聚焦 #作手分析
🔥 U.S. stocks and crypto plunge together, leaving long positions underwater! Crisis or long-term opportunity? Trader breaks down the three key reasons behind the selloff

Trading watchlist: $BTC $ETH $NVDA $GOOGL $ANTHROPIC

On November 5, U.S. stocks and crypto markets suffered a sharp selloff. The Nasdaq fell 5.52%, the Philadelphia Semiconductor Index plunged 12.3%, and NVDA fell about 9%, with semiconductor stocks such as MU and AMD dropping even more. BTC fell below $76,000, while ETH, HYPE, and others also pulled back sharply.

I’m transparent about my live positions: my HYPE, GOOGL, and ANTHROPIC long positions are currently also showing unrealized losses.

But I don’t think this downturn means the long-term cases for AI and crypto assets are over. Some high-quality assets may, in fact, be presenting long-term spot opportunities worth watching.

I. Three reasons behind this selloff

1️⃣ U.S. midterm elections shift expectations for AI investment

The Democratic Party won control of both chambers of Congress, raising concerns that future data center construction, energy supply, and AI infrastructure investment could face stricter regulation.

But this is only the trigger. The deeper question is whether massive AI capital expenditures can translate into sustained revenue and profits. As the market starts questioning returns on investment, valuations may be repriced.

2️⃣ The AI industry shifts from storytelling to proving profitability

In the past, the market was willing to pay high valuations for AI growth. Now, institutions are paying closer attention to orders, revenue, profits, and cash flow.

Chip demand may remain strong over the long term, but data center construction requires massive investment. Financing costs, energy supply, construction approvals, and investment payback periods could all affect the pace of industry expansion.

AI hasn’t disappeared; the market is simply starting to demand that companies demonstrate real profitability.

3️⃣ U.S. stock losses combine with crypto market liquidations

U.S. tech stocks plunged, and risk appetite quickly declined. CoinDesk, citing CoinGlass data, reported that more than $1 billion in leveraged positions were liquidated in the crypto market over the past 24 hours, with longs accounting for the vast majority.

But the crypto market was already under pressure from ETF outflows, shrinking stablecoin supply, and other factors. The decline in U.S. stocks acted as a catalyst, while leveraged liquidations further amplified the losses.

II. Why is Trader starting to look for long-term spot opportunities?

My logic is simple: short-term price declines don’t mean long-term business value has disappeared.

For NVDA, I’m watching AI chip demand and orders; for GOOGL, cloud business and AI commercialization; for BTC and ETH, capital flows and ecosystem development; and for HYPE, platform revenue and token value capture.

Of course, a big drop doesn’t mean an asset is cheap. For assets like ANTHROPIC, which are still subject to valuation expectations, it’s especially important to watch financing, computing costs, and whether future revenue materializes.

III. What will Trader do next?

I handle spot investing and futures trading separately:

• Spot: Build positions in high-quality assets I’m bullish on in batches, spread out the buying period, and don’t go all-in at once trying to call the bottom.

• Futures: Don’t blindly add to positions just because they’re underwater, and never hold on indefinitely. Wait for signs of stabilization, a breakout, and a confirmed retest before looking for opportunities on the right side of the trend.

• Risk management: If fundamentals change or the price structure continues to weaken, reassess instead of stubbornly sticking to the original view.

Tonight at 21:30 Beijing time, the U.S. will also release its October nonfarm payrolls report. The data could further affect expectations for Fed rate cuts and the performance of risk assets.

Trader believes this correction is worth watching, but it’s still too early to declare that a bottom has formed.

Don’t try to call the top or bottom, and don’t chase the first big green candle. The macro sets the direction; the structure determines the entry.

How are you planning to respond to this selloff?

A. Build a spot position in batches

B. Reduce exposure and wait for confirmation

C. Stay bearish and wait for a deeper bottom

D. Wait on the sidelines for now

Let the market provide the answer instead of trying to predict it!

(Personal opinion for discussion only; not investment advice.)
NAS100+1.45%
  • 4
  • 1
$SNXX It crashed 32% in a day, yet 24h trading volume hit $1.16 billion—this isn’t a panic sell-off; it’s a meat grinder changing hands. I put the current Fear & Greed Index at 27 (fear zone), with the funding rate at -0.038% (shorts pay), and sentiment down to the 5th percentile, its lowest in nearly three months. Historically, when $SNXX has seen this “price cut in half + negative funding rate + explosive trading volume” trifecta, a short-term bottom came on day 3 and day 5 in the two previous instances, followed by rebounds of +41% and +28%, respectively. But don’t rush to buy the dip—ther
SNXX-0.43%
  • 12
  • 3
The AI Stock Crash Brings Back Memories of
live-cover
LIVE1,844
11.6 BTC Trading Plan for Today
$BTC
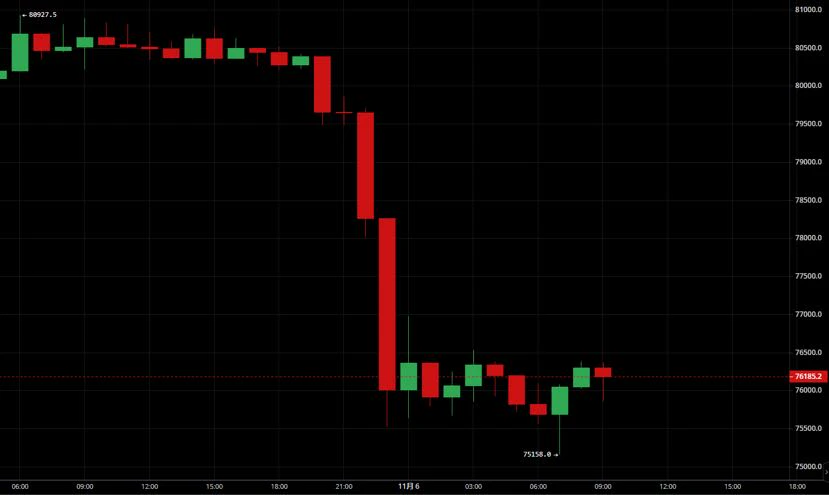
After plunging sharply overnight, price rebounded after hitting a low of 75158 and entered low-level consolidation. The overall trend is dominated by bears, so focus on shorting rallies. #美股史诗级抛售
Support: 75150
Resistance: 77000-77200
Short: Enter on a rebound into the 77000-77200 range, stop-loss at 77600, first target 76000, second target 75150
Short-term long: If price stabilizes near 75150 on a retest, consider a small position; enter and exit quickly. First target 76200, second target 77000
post-image
BTC-0.67%
#USStocksFaceHistoricSelloff
When Wall Street Breaks, Crypto Feels the Pressure: Understanding the November 5 Market Selloff

November 5 was a serious reminder that financial markets do not operate in isolated environments. When confidence weakens across major technology stocks, semiconductor companies and growth-oriented investments, the pressure can quickly spread into the cryptocurrency market.

What happened yesterday was not an ordinary red trading session. The Nasdaq Composite plunged 5.52%, the S&P 500 lost 4.36%, and the Dow Jones declined 3.44%. The Philadelphia Semiconductor Index s
MU-17.23%
NVDA-9.33%
AMD-17.64%
  • 7
  • 1
🔥 What are we discussing today? Trending topics on Gate Square have been updated!

🔹 #Epic Sell-Off in U.S. Stocks
Tech stocks are facing a wave of heavy selling. Will this correction continue?
🔹 #October Nonfarm Payrolls in Focus
The nonfarm payrolls report is due tonight. Will it trigger a market rebound or further losses?
🔹 #Crypto Market Under Pressure
$BTC and $ETH are following global risk assets lower. Is now the time to buy the dip or keep waiting?

Quality content can receive a traffic boost + featured recommendations.
💰 Got a take? Join the discussion:
https://www.gate.com/post
post-image
BTC-0.67%
ETH-1.26%
  • 2
  • 2
#美股史诗级抛售 #10月非农数据聚焦 #作手分析
🔥 U.S. stocks and crypto plunge together, leaving long positions underwater! Crisis or long-term opportunity? Trader breaks down the three key reasons behind the selloff

Trading watchlist: $BTC $ETH $NVDA $GOOGL $ANTHROPIC

On November 5, U.S. stocks and crypto markets suffered a sharp selloff. The Nasdaq fell 5.52%, the Philadelphia Semiconductor Index plunged 12.3%, and NVDA fell about 9%, with semiconductor stocks such as MU and AMD dropping even more. BTC fell below $76,000, while ETH, HYPE, and others also pulled back sharply.

I’m transparent about my li
Falcon_Official
#美股财报季 #Gate股票畅聊季 #MELI 45% Revenue Growth, Yet Margins Keep Falling: Is MercadoLibre Paying Too Much for Expansion?

A Strong Growth Story With One Uncomfortable Number

MercadoLibre delivered another impressive quarter on the revenue front, but the market focused on something much less encouraging: profitability. Third-quarter net revenue and financial income reached $10.75 billion, rising 45% year over year. Total payment volume climbed 53% to $109 billion, while gross merchandise volume increased 38% to approximately $23 billion.

Those figures confirm that Latin America's e-commerce and digital payments markets are still expanding rapidly. Yet MELI shares came under pressure after the results, falling more than 7% at one point in after-hours trading and touching approximately $1,555, according to the supplied Gate market data.

The reason was the gap between growth and earnings. Adjusted EPS came in at $8.83, below the $9.34 consensus estimate. Operating profit was $676 million, and the operating margin slipped to 6.3%, compared with 7.0% in the previous quarter. Revenue is growing quickly, but investors want to know how much profit the company is sacrificing to achieve that growth.

Free Shipping: A Long-Term Advantage With a Short-Term Cost

One of the biggest contributors to margin pressure was MercadoLibre's decision to lower its free-shipping threshold. The strategy encourages more frequent purchases, improves customer retention and makes smaller orders more attractive. However, more orders also mean more deliveries and higher logistics expenses.

There are signs that the investment is beginning to work. Net shipping costs as a share of GMV have declined by approximately 200 basis points since Q1 2025. In Brazil, foreign-exchange-neutral cost per shipment fell 5% year over year and stood 14% below the level recorded before the threshold adjustment. More importantly, in September, free-shipping orders in the 19–79 Brazilian real range generated a positive variable contribution for the first time.

That is an important development. It suggests the strategy is not simply generating volume at any cost. But the improvement has not yet been sufficient to prevent overall margin contraction.

Fulfillment Spending Is Being Recognized Before Peak-Season Revenue

Another pressure point is the company's logistics expansion. MercadoLibre increased its fulfillment network by nearly 20% quarter over quarter ahead of the seasonal demand peak. More facilities, higher energy consumption and temporary staffing created expenses during Q3, while the full benefit of peak-season sales is expected to appear in Q4.

Management expects only a partial reversal of these capacity-related costs in the next quarter. That means investors should not assume margins will immediately return to earlier levels.

The key question is whether this spending creates enough additional order volume and operating efficiency to justify the upfront cost. If the expanded network improves delivery speed and lowers unit economics over time, today's pressure may prove temporary. If utilisation remains weak, the investment could become a longer-lasting burden.

The Warning Signs Beyond Logistics

Shipping and fulfillment are not the entire story. Advertising revenue growth slowed from 73% in the previous quarter to 58%. Fintech monthly active users increased 29%, but credit portfolio growth eased from 75% to 62%.

These numbers deserve attention because advertising and financial services can contribute meaningfully to profitability. Slower expansion in these areas, combined with higher funding costs in Brazil and more cautious lending to riskier borrowers, could make margin recovery more difficult.

There is still evidence of strong engagement. Brazil's e-commerce GMV grew 36% on a foreign-exchange-neutral basis, while items purchased per buyer increased 16%. Affiliate marketing order volume rose 240%, and the network surpassed 12 million members. Credit card issuance reached a record, while the 15-to-90-day nonperforming loan ratio remained stable at 7.0%.

The challenge is turning this stronger customer activity into sustainable earnings rather than relying on continuous investment to maintain growth.

The Bull Case Versus the Bear Case

The bullish argument is that MercadoLibre is deliberately investing ahead of demand. Lower shipping thresholds can increase purchasing frequency, affiliate marketing can attract new customers, and a larger fulfillment network can strengthen its competitive position. If these investments improve efficiency over the next few quarters, current margins may represent an investment trough rather than a permanent decline.

The bearish argument is that competition could prevent those margins from recovering. Nubank is competing for digital-wallet users and financial relationships, while free delivery is increasingly becoming an industry expectation rather than a unique advantage. If customers demand more benefits and sellers push back against platform fees, the industry could settle at lower profitability levels.

This matters even more when MELI trades at a trailing P/E above 47x, based on the supplied figures. A premium valuation requires investors to believe that today's spending will produce stronger earnings tomorrow. If that improvement takes longer than expected, the stock could remain vulnerable even while revenue continues to grow.

What the Analyst Targets Are Really Telling Us

The supplied analyst snapshot shows that most of 26 analysts maintain Buy ratings, with an average price target near $2,272. However, the target range from $1,750 to $2,800 highlights considerable disagreement about the speed of margin normalisation.

The debate is not mainly about whether MercadoLibre can keep growing. It is about how much of that growth will eventually reach shareholders as operating profit.

My Outlook: Watch the Next Two Quarters, Not Just Revenue Growth

I remain interested in MELI's long-term position in Latin American commerce and fintech, but I would not treat strong revenue growth as an automatic buy signal. The next two quarters should reveal whether fulfillment investments begin delivering operating leverage, shipping economics continue improving, and advertising and credit businesses regain momentum.

The most important confirmation would be a stabilisation or recovery in operating margin alongside continued growth in GMV and TPV. If revenue stays above 40% growth but margins continue falling, the market may keep applying a quality discount to the stock.

For me, the central question is simple: Is 6.3% the bottom of a temporary investment cycle, or the beginning of a lower structural margin level?

MercadoLibre has not lost its growth engine. But the next stage of its valuation depends on proving that growth can become more profitable.
#WCTCS9
repost-content-media
BTC-0.67%
ETH-1.26%
NVDA-9.33%
GOOGL-2.22%
MU-17.23%
  • 3
Guys, I ran for two hours this morning and made 2u from 5 orders. Once I’ve earned 150u, I’ll start over and review. The tech dream is shattered$SNDK
post-image
SNDK-22.24%
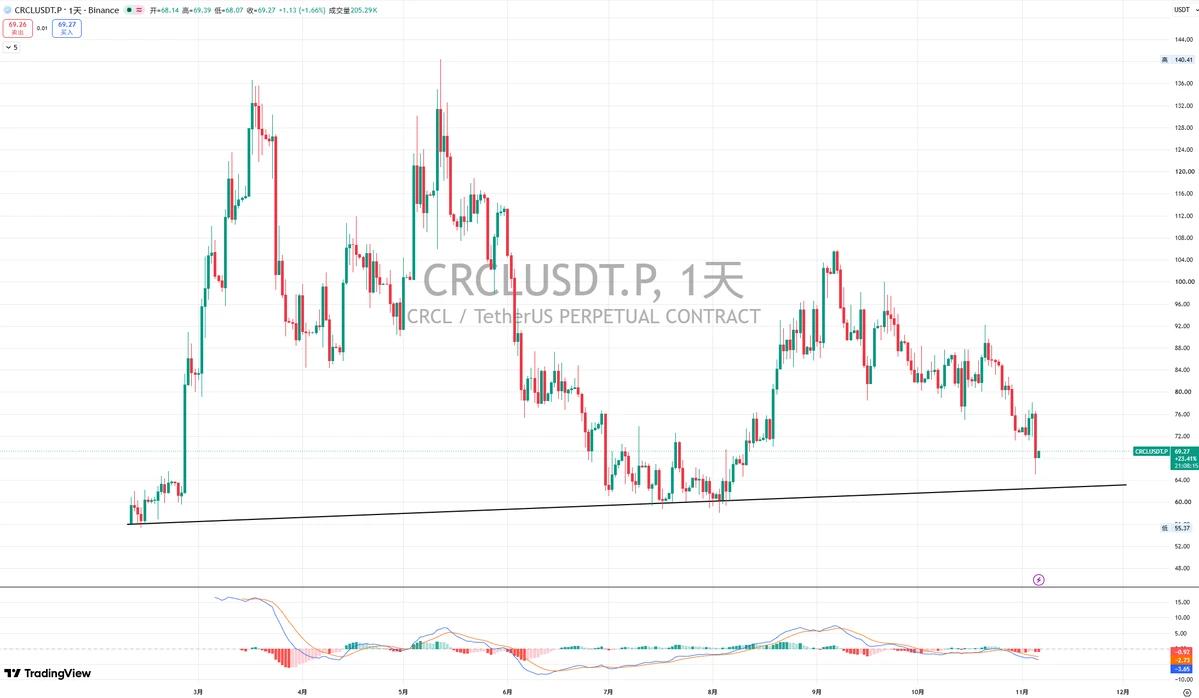
$CRCL
CRCL, the parent company of the USDC stablecoin
After following this wave of declines, it has finally reached the ideal entry range of 68–65 that I mentioned in October! The short-term low was 64.8. I’m not sure whether it will fall further, but this is a great buying range!
Enter a long-term position and be prepared to hold it for the long term!
post-image
CRCL-8.69%
$AIN Everything is under control; when it bounces, you have to kick it twice
AIN+3.85%
  • 1
#10月非农数据聚焦 Two Numbers Matter More Than the Headline
Friday's October jobs report lands at 8:30 a.m. ET, which is 21:30 Beijing time. Most previews will focus on one number: the headline payroll count. That focus is understandable, but it misses the point. The market reaction will depend on how three figures fit together: job creation, the unemployment rate and wage growth. A strong headline with rising wages can be more bearish for risk assets than a weak headline with stable pay. A weak headline paired with falling unemployment can look better than it sounds.

The consensus is a range, not a
ADP+1.21%
BTC-0.67%
  • 3
11.6 Market Analysis

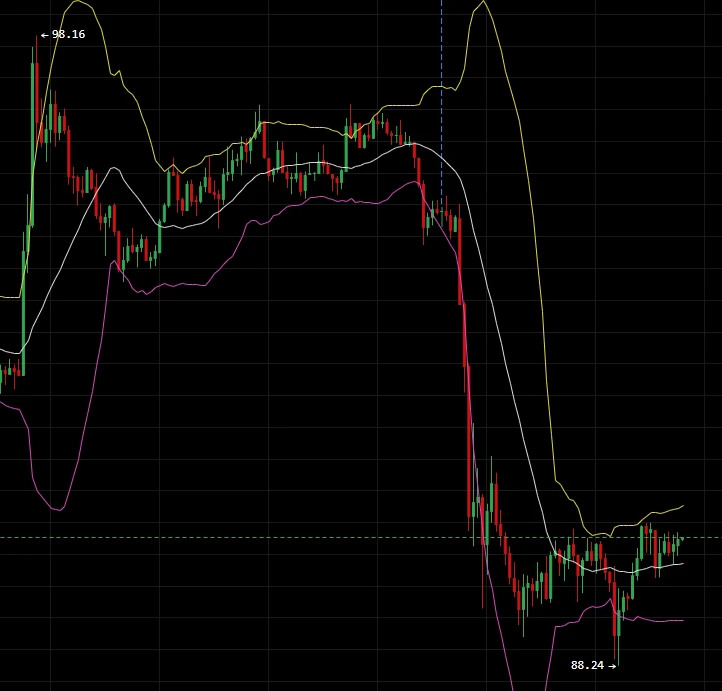
SOL rebound: Scale into shorts in the 91.5–92.5 range,
Defense level: 93.2;
First target: 90.0, second target: 88.24

The rally came to an abrupt halt! SOL’s reversal signal is now unmistakable.
On the one-hour chart, SOL came under pressure and plunged after reaching an interim high of 98.16. Long bearish candles on heavy volume broke through multiple key support levels in succession, with the price hitting a low of 88.24. The current price is 89.93. The previous uptrend structure has been broken, and concentrated selling pressure from bears has been unleashed. For now,
post-image
SOL-0.74%
BTC-0.65%
ETH-1.23%
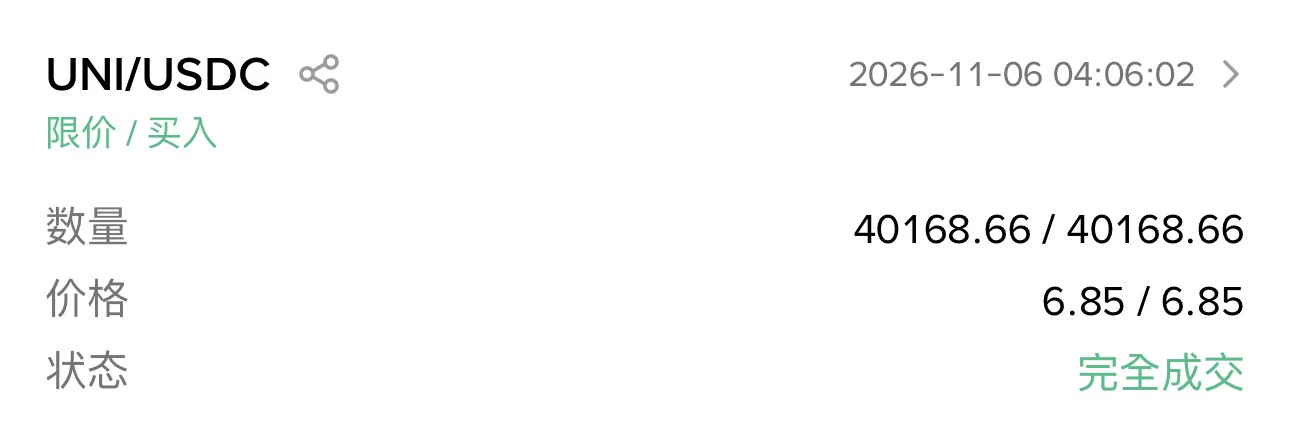
Since I started trading crypto, my sleep quality has gotten worse year after year. I woke up in the middle of the night and couldn't resist checking the market, then couldn't resist adding 40k UNI at 6.85U. The bubble in U.S. storage and AI stocks is deflating—what does that have to do with crypto? The crypto bubble was already mostly squeezed out. Bitcoin's fundamentals haven't changed at all; I still see range-bound trading between $75k and $85k. $UNI
post-image
UNI+3.05%
  • 6
  • 2
A foolproof way to buy U.S. stocks: $SNDK buy in batches whenever the market crashes; every major drop is a chance to pick up shares at low prices. You don’t need to watch charts or read financial reports; just make sure your position is balanced against the price, and leave the rest to time. After building your position, gradually trim it when the price pulls back to a certain level to lower your cost basis
post-image
SNDK-22.24%
Load More

Join 40 M users in our growing community

⚡️ Join 40 M users in the crypto craze discussion

💬 Engage with your favorite top creators

👍 See what interests you

Trending Topics

USStocksFaceHistoricSelloff

586 Views3.46k Discussing

U.S. stocks suffered a sharp selloff on Thursday, with the Nasdaq closing down more than 5% and the Philadelphia Semiconductor Index falling over 12%. AI and chip stocks including $NVDA and $AMD were hit especially hard. Markets are reassessing AI valuations, data-center spending and future returns. Is this just short-term deleveraging, or the start of a deeper correction in the AI trade? Which sectors are you watching next?

GateLaunchesPoSECProofOfSecurity

11.51k Views563 Discussing

USNonfarmPayrolls

8.95k Views3.97k Discussing

View More