
Share your thoughts
placeholder
Article
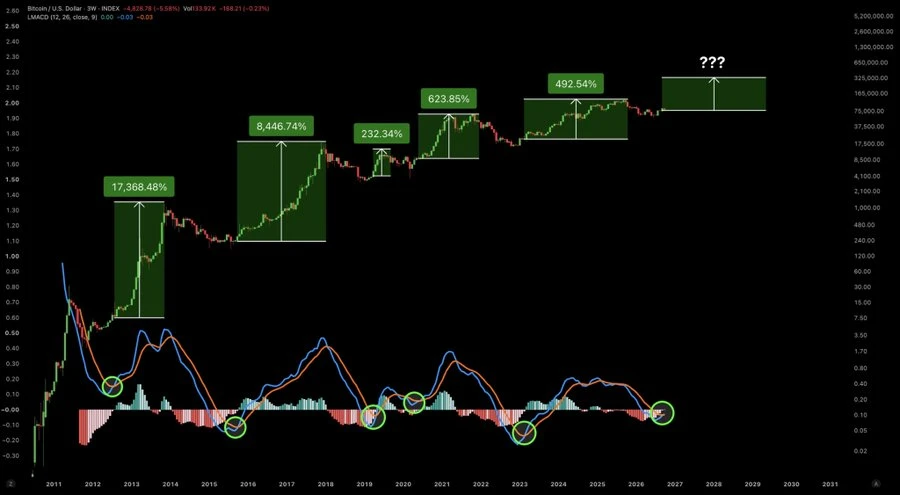
$SAGA The most unusual detail today is not the 6% rise, but the funding rate at +0.0050%—longs are paying to hold positions, yet the price has pulled back from around the Bollinger upper band at 0.02986, with the current price of 0.02789 already falling below MA5 at 0.028542. The Greed Index is 71; this combination means late buyers are being trapped, with short-term momentum and sentiment diverging.
Technically, MA5 remains above MA20, and the MACD histogram is positive, so the medium-term structure remains intact. However, RSI has retreated from elevated levels to 57.7, indicating that bull
post-image
SAGA+23.87%
ENA+4.36%
COTI-10.87%
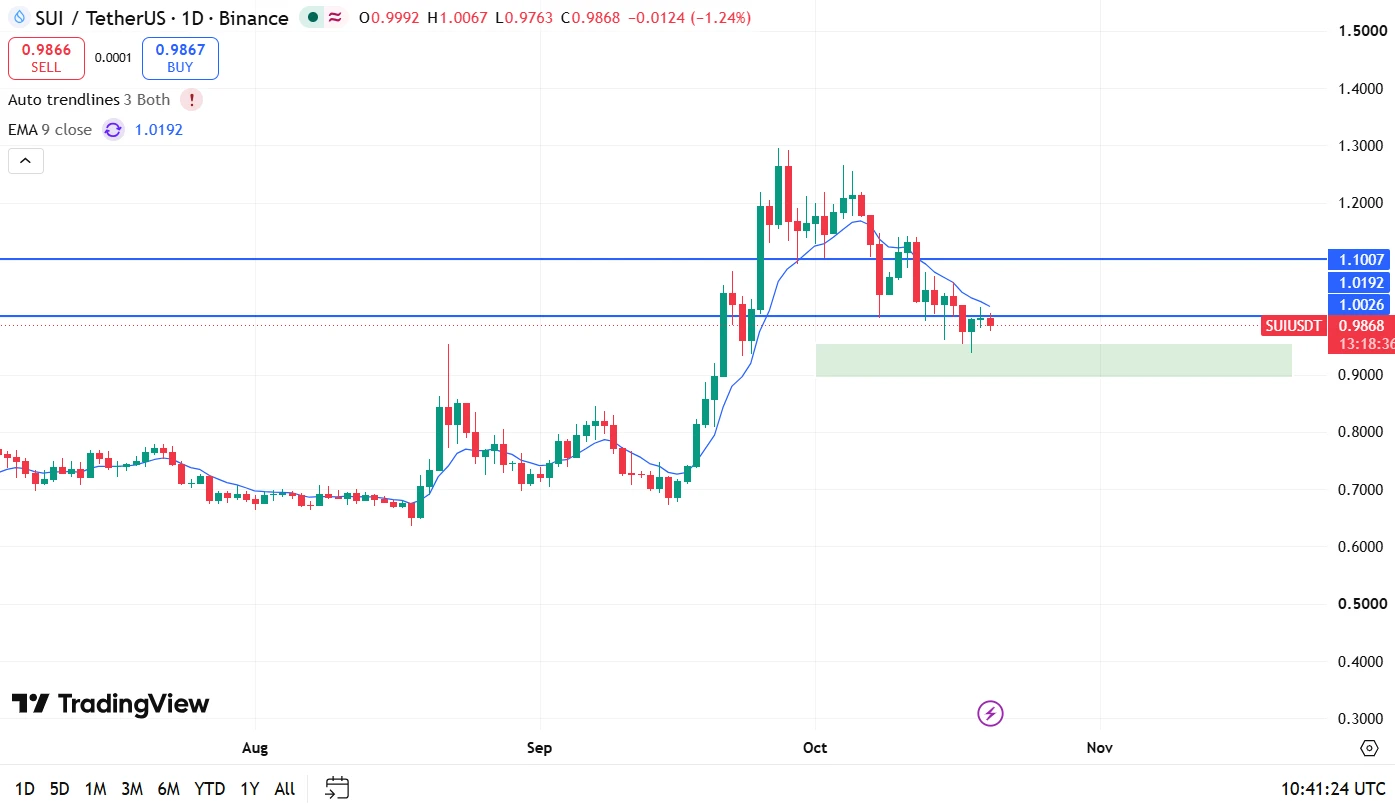
$KITE could be setting up for a reversal from this ascending support zone 🚀🚀🚀
If support holds and momentum returns, we could see a move toward a new ATH 👀🔥
I already made 386% profit on $KITE a few months ago. Now watching closely for the next move. 📈
post-image
KITE-2.58%
Far fewer Bitcoin holdings are sitting at a loss than earlier this year.
Let me explain: this chart tracks the percentage of Bitcoin UTXOs in loss. Basically, it measures what share of $BTC chunks are worth less now than when they last moved.
We saw similar drops in 2019 and 2023 as the market recovered from bearish phases.
Personally, I think the CLARITY Act failing to advance is short-term noise. I’m always looking further down the line, and this chart gives me a reason to stay optimistic.
So overall, I’m pretty bullish.
post-image
BTC-0.73%
INTEREST RATES ARE RISING BUT THE BULLS REFUSE TO STEP ASIDE. Central bank policy updates usually bring fear to traditional markets, yet the digital asset space is shrugging it off with impressive price action. Let us see how the weekend volatility plays out for major tokens. - Leading asset $BTC pushed higher to $76,621 as investors digested the economic outlook. - Privacy token $ZEC printed a massive 23 percent rally after a major fund disclosed their investment stake. - Volume indicators suggest traders are actively positioning themselves for the next leg. Wild times to be trading this mark
post-image
BTC-0.73%
ZEC-4.29%
  • 6
  • 1
SingularityNET was attacked, with 260 million AGIX and 53.838 million WMTX minted without authorization.
Damn, here’s another coin that was directly attacked and wiped out, AGIX. Back when the AI sector was hot, AGIX, Ocean, and FET merged into FET, which could have challenged the AI leaders. But it faded from view amid the bull market wave, and now AGIX has gone to zero again. I can only sigh!
In the future, I’ll watch the coins I’m familiar with one by one go from their former glory into decline. It truly feels like the melancholy of heroes having nowhere to ask their origins, with survival
WMTX-43.97%
FET-3.97%
$ALGO The most unusual point today: it rose 12.47% over 24h, and the price of 0.1136 is already above the Bollinger upper band at 0.112318, yet the MACD histogram is only +0.0009673—the price increase and momentum histogram are severely mismatched, a typical “price leads, indicator lags” structure.
Technical breakdown: MA5=0.10968 has crossed above MA20=0.104775, confirming a bullish short-term moving average alignment, with no issue regarding trend direction; however, RSI=75.6 has entered overbought territory, and the price is hugging/breaking above the Bollinger upper band, signaling overhea
post-image
ALGO+11.88%
ZRO-4.15%
More often than not, it is not the market that defeats us, but our own mindset.
When prices rise, it is easy to become greedy, always wanting to hold a little longer, until profits are given back and unrealized gains turn into unrealized losses. After prices fall, we become trapped in wishful thinking, unwilling to admit mistakes and cut losses, always imagining that the market will reverse immediately.
Chasing rallies comes from fearing that we will miss out, holding losing positions comes from refusing to accept losses, and rushing to open positions to recover losses marks the beginning of a
BTC-0.75%
ETH-0.82%
GT-0.46%
  • 1
This is the hardest bull to catch in #Crypto history.
post-image
$ZAMA /USDT is sleeping above a trapdoor most traders will ignore.

$ZAMA /USDT - SHORT

Trade Plan:
Entry: 0.08318 – 0.08632
SL: 0.09981
TP1: 0.07346
TP2: 0.06593
TP3: 0.05463

Why this setup?
Why now? The 4h trend is range-bound, but the 1h price sitting at 0.08475 shows a precise entry zone where sellers can overwhelm buyers. The 15m RSI at 42.01 confirms bearish momentum without being overbought, while the 1h ATR of 0.006274 quantifies the volatility needed to push toward the first target at 0.07346. A break above the invalidation level of 0.06221 would wipe out the entire short thesis,
ZAMA+8.13%
STRATEGY: MAYBE WE DIDN’T NEED THE CLARITY ACT.
Senate killed the bill.
Two days later, SEC opened the door to more onchain stock trading and CFTC pushed crypto rules forward.
Strategy thinks that could be better than locking the industry into a bad compromise.
Sometimes getting no deal beats getting the wrong deal.
MARket prices updates
live-cover
LIVE749
$ETH GOT THE SHORTS SQUEEZED — NOW I’M WATCHING THE PULLBACK
ETH pushed above $2.6K and squeezed a lot of shorts, but price is now cooling around the $2.58K area. The broader structure is still constructive, while $2,600–$2,672 remains the key resistance zone.
🟢 $ETH LONG SETUP
Entry: $2,570–$2,600
TP1: $2,670
TP2: $2,710
TP3: $2,800
SL: $2,530
Structure: Bullish above $2,530
Liquidity: $2,670–$2,710
Zone of Interest: $2,570–$2,600
I’m not chasing the move here. If ETH comes back into the zone and buyers defend it, I’ll watch the $2.67K area next.
If $2,530 breaks with strong selling, the s
post-image
ETH-0.82%
Four Assets, One Picture
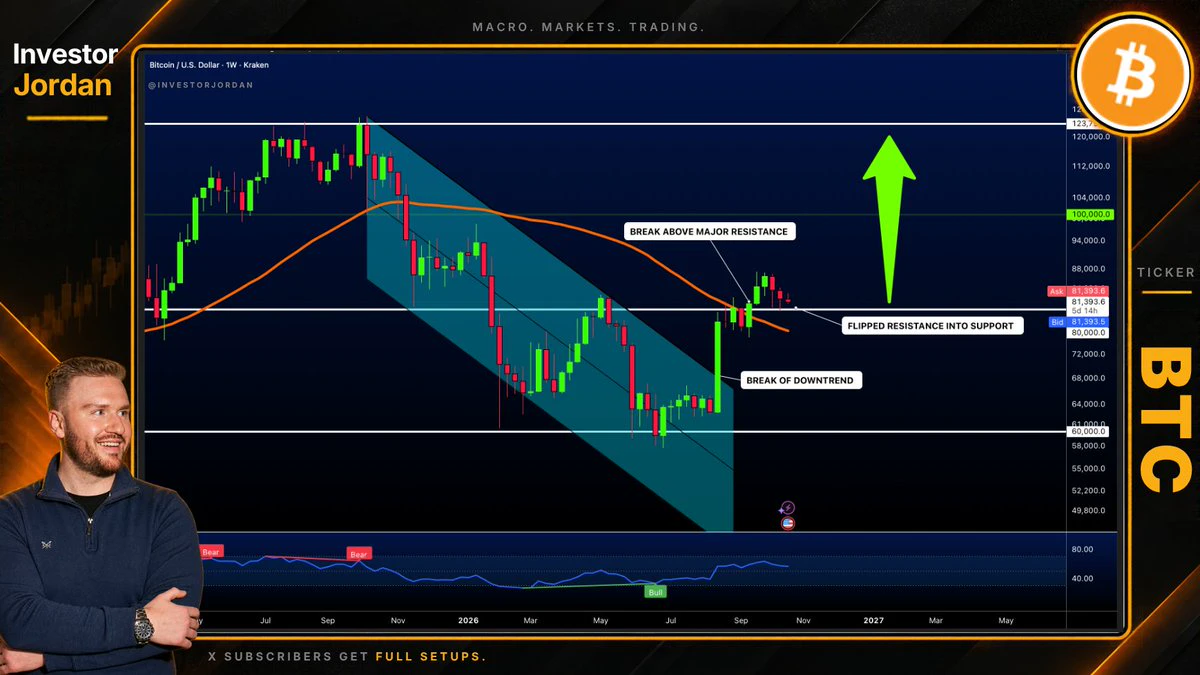
The fastest way to understand the market is to read assets of different character in the same frame. The current picture is short and clear: BTC is trying to hold above 80K and is green on the week; ETH is negative on the day in the 2.5K zone; SOL is seeing a sharper daily drop around 108 dollars; GT is trading nearly flat in the 10 dollar zone.
What this table says is this: risk appetite is not dead, it is divided. Capital is not flowing fully into altcoins; the bulk is still waiting in Bitcoin. In periods like this, declines in altcoins are usually faster than BTC's,
post-image
xxx40xxx
$GT : What Makes an Exchange Token Different
GT stands in a different place from the other three: as an exchange's own token, its price depends not only on the general direction of the crypto market but also on the platform's own activity. In the latest picture GT sits just above the 10 dollar band with a nearly flat daily change; in other words, it looks relatively less affected by BTC's indecision.
The logic of this divergence is simple: demand for exchange tokens is interwoven with user numbers, trading volume and the token's functions inside the platform. When the broader market falls but an exchange's volume rises, that token's story gets written differently.
Still, this does not make GT a safe harbour. Exchange tokens are sensitive to liquidity shocks, regulatory headlines and sudden shifts in user behaviour. That is why the wolf does not look at price alone; it also looks at platform volume, user activity and the token's circulating supply.
A practical approach: GT can be considered a balancing element in a portfolio, but its size should never be set on belief alone. And tracking GT purely through a price chart is an incomplete reading; platform announcements, newly listed assets and activity on the user side directly shape demand for the token. BTC represents direction, ETH infrastructure, SOL speed, and GT the pulse of the platform. Read together, the market picture becomes far clearer: where is capital waiting, where is it flowing, and where is it getting stuck?
Risk Note: This content is not financial advice. It is for informational purposes only. Do your own research before making investment decisions.
$BTC $ETH $SOL
#GateSquareMidAutumnReunion
#BTCRetakes80K #WeekendMarketBullishOrBearish #ShareWeekly #WeeklyShare
repost-content-media
BTC-0.73%
ETH-0.77%
SOL-2.32%
GT0.00%
#GarrettJinHolds320MInZEC
#GateSquareMidAutumnReunion
Garrett Jin Holds Roughly 320 Million Dollars in ZEC — What It Really Changes For The Market
The headline is simple once you break it down. Garrett Jin is a well known high volume crypto trader who posts under the handle GarrettBullish. When people say he holds 320 million dollars in ZEC, they mean he is holding about 202,078 Zcash coins in spot, and at a ZEC price near 1,580 dollars that stack was worth roughly 319 to 320 million dollars. This is not a leveraged paper position and it is not a claim about future value. It is a spot holdin
post-image
Retired at 31 selling options. No inheritance. No lucky coin flip. No rich parents.
I don't day trade. I don't read charts. I couldn't tell you what the market did this morning & I don't care
I buy great companies for less than they're worth & use long duration options to magnify the most bullish setups
Then I sell portfolio secured puts & take the cashflow to buy more shares & calls.
10 minutes a day
It's not complicated
It's just the opposite of everything they taught you
Fibonacci that
post-image
MARKET UPDATES
live-cover
LIVE777
#Gate广场中秋团圆局
The U.S. tokenized-stock market is moving into a different phase. On September 17, 2026, the SEC approved its “Innovation Exemption”, creating a temporary, conditional pathway for certain Tokenized Securities Venues (TSVs) to facilitate on-chain trading of tokenized U.S. stocks. This came shortly after the Senate failed to advance the CLARITY Act, which means the regulatory picture is now developing through both legislative and administrative channels rather than through legislation alone. The Senate vote on the CLARITY Act was 49–50, so the bill did not clear the procedural hurd
ONDO-2.17%
HOOD+9.72%
  • 2
Have a great Sunday everyone 🫡
post-image
🐋 Purple Wells (100K-1M BTC) are actually LONGING more than the average! New data shows they're not as bearish as previously believed. Mariano explains the sandwich effect.
#Bitcoin #WhaleCVD #Crypto #OnChain #TheTradingParrot
BTC-0.73%
Load More

Join 40 M users in our growing community

⚡️ Join 40 M users in the crypto craze discussion

💬 Engage with your favorite top creators

👍 See what interests you

Trending Topics

MSTRTopsNasdaq100

74.08k Views2.99k Discussing

Strategy (MSTR) has gained about 48% over the past month, making it the best-performing stock in the Nasdaq 100, while Bitcoin rose roughly 12% over the same period. The company holds 845,050 BTC with a cumulative cost basis of about $63.73B. MSTR is not a pure Bitcoin proxy — its price swings can be more extreme. Can this rally last?

Gate Tops 24H Net Inflows Among Exchanges

26.43k Views3.69k Discussing

BTCRetakes80K

57.12k Views60.58k Discussing

View More