Share your thoughts
placeholder
Article
Why is everyone ignoring the warning signs on SYMBOL right now?

$WLFI /USDT - SHORT

Trade Plan:
Entry: 0.05723 – 0.05765
SL: 0.05943
TP1: 0.05595
TP2: 0.05496
TP3: 0.05347

Why this setup?
Why now? The 1h price is hovering at 0.05744 inside a tight range, while the 15m RSI sits at 55.82 showing neutral momentum that could shift fast. The 1h ATR of 0.000828 proves volatility is compressed, setting up a sharp move once it breaks. The entry zone between 0.05723 and 0.05765 aligns perfectly with the daily range, giving a clean setup to target TP1 at 0.05595 and TP2 at 0.05496. The invalidatio
WLFI+1.14%
Nobody is watching SNDK while the 1h ATR whispers a massive move is coming.

$SNDK /USDT - LONG

Trade Plan:
Entry: 1599.45 – 1604.27
SL: 1571.84
TP1: 1624.37
TP2: 1639.38
TP3: 1661.90

Why this setup?
Why now? The 1h price is holding at 1601.64 inside a tight range, and the 15m RSI has dropped to 33.83, signaling exhaustion on the downside. The 1h ATR of 9.621261 confirms that a sharp expansion is imminent, turning this quiet range into a potential launchpad. The entry zone between 1599.45 and 1604.27 sits perfectly above the invalidation level of 1571.84, giving a clean risk-reward setup.
SNDK-2.22%
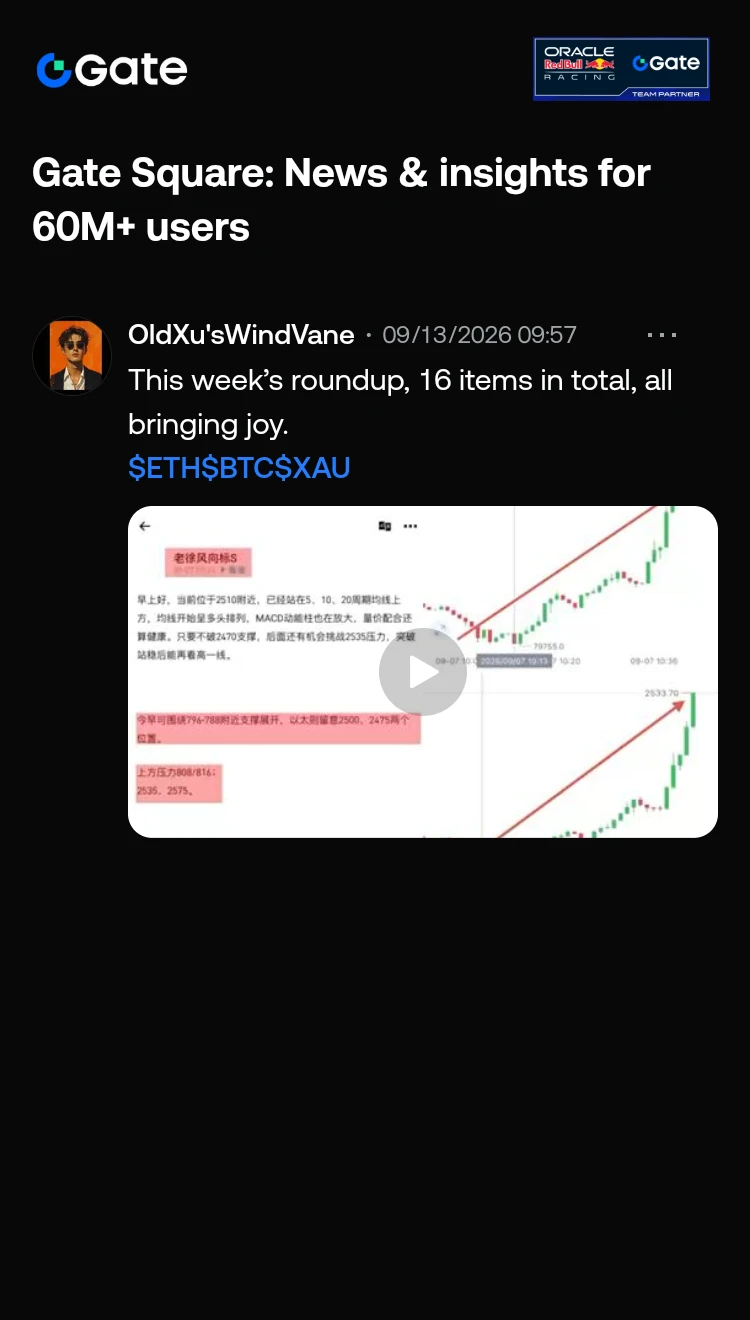
This week’s roundup, 16 items in total, all bringing joy.
$ETH $BTC $XAU
post-image
ETH-0.57%
BTC-0.36%
XAU-0.02%
Why is everyone suddenly watching $SKHYNIX /USDT like a hawk?

$SKHYNIX /USDT - LONG

Trade Plan:
Entry: 1325.63 – 1328.95
SL: 1306.60
TP1: 1342.81
TP2: 1353.16
TP3: 1368.67

Why this setup?
Why now? The 4h trend is range-bound, but the 15m RSI at 34.63 shows oversold momentum that could flip bullish. The 1h ATR of 6.63 points to a sharp move once volatility expands, making the entry zone around 1327.29 a high-probability trigger. TP1 at 1342.81 offers the first realistic target, while TP2 at 1353.16 extends the upside if momentum holds. The daily range structure keeps the trade contained,
SKHYNIX-3.13%
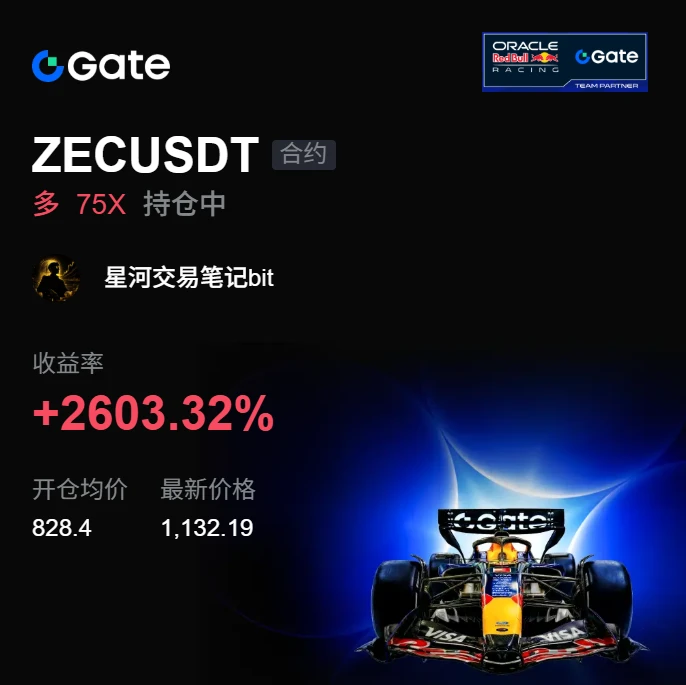
For this $ZEC long position, I took profit on 70% around 1132.64 first. It’s not that I’m no longer bullish, but profit-taking has started near the previous high, and trading volume has not continued to expand, so holding the full position no longer offers a particularly good risk-reward ratio.

At entry, I was looking for a pullback confirmation after the breakout. The key level around 828.40 held repeatedly, and the pullback came with declining volume, so I was willing to go long with the structure. With floating gains of +2607.26% so far, I’m locking in most of the profit first, while the
post-image
ZEC-1.76%
SOL-1.13%
ETH-0.58%
Insiders are watching HYPE break 81.368 or risk a total wipeout.

$HYPE /USDT - LONG

Trade Plan:
Entry: 78.703 – 78.965
SL: 77.580
TP1: 79.775
TP2: 80.402
TP3: 81.342

Why this setup?
Why now? The daily trend is bullish, setting the stage for a sustained move higher. The 1h price sits at 78.834, placing us right at the entry reference. The 15m RSI at 41.82 signals room for upside before overbought territory. The 1h ATR of 0.522516 shows enough volatility to push toward the first target at 79.775 and the second at 80.402. The line in the sand remains the invalidation level at 81.368.

Deba
HYPE-1.03%
$AVA Signal】Long | 1H upper-band breakout, fund-driven rise continues
$AVA 1H RSI 76.59, 4H RSI 79.83, with the price at 0.2003 pressing above the 1H upper Bollinger Band at 0.2000. The 4H MACD red bar expanded to 0.0053, while the 1H red bar also increased to 0.0032. Order book depth is -7.51%, with a bid-ask ratio of 0.86 and dense sell orders at high levels. 4H volume surged from 1.16M to 22.6M, and buy-side support remains steady.
🎯Direction: Long
⚡Entry/limit order: 0.199699 - 0.200300
🛑Stop loss: 0.198297
🚀Target 1: 0.203304
🚀Target 2: 0.204807
🛡️Trade management:
- Execution strat
AVA+29.62%
#疑似AI股神建仓看涨AI #辣妹儿李嘉欣
I now have an exclusive Ethereum market analysis playbook
Where is the top after the rally from the bottom?
Why is 2660 acting as resistance?
Where does it go next?
Where is the short-term range midpoint?
How far should I hold my position?
But to be honest, I’m somewhat dissatisfied with this comment section. I’m holding back for two days. With my personality, I like showing off fancy moves and flaunting what I know. I usually can’t resist—I have to get this stuff in my head out there.
I can still hold back for now.
post-image
ETH-0.57%
  • 1
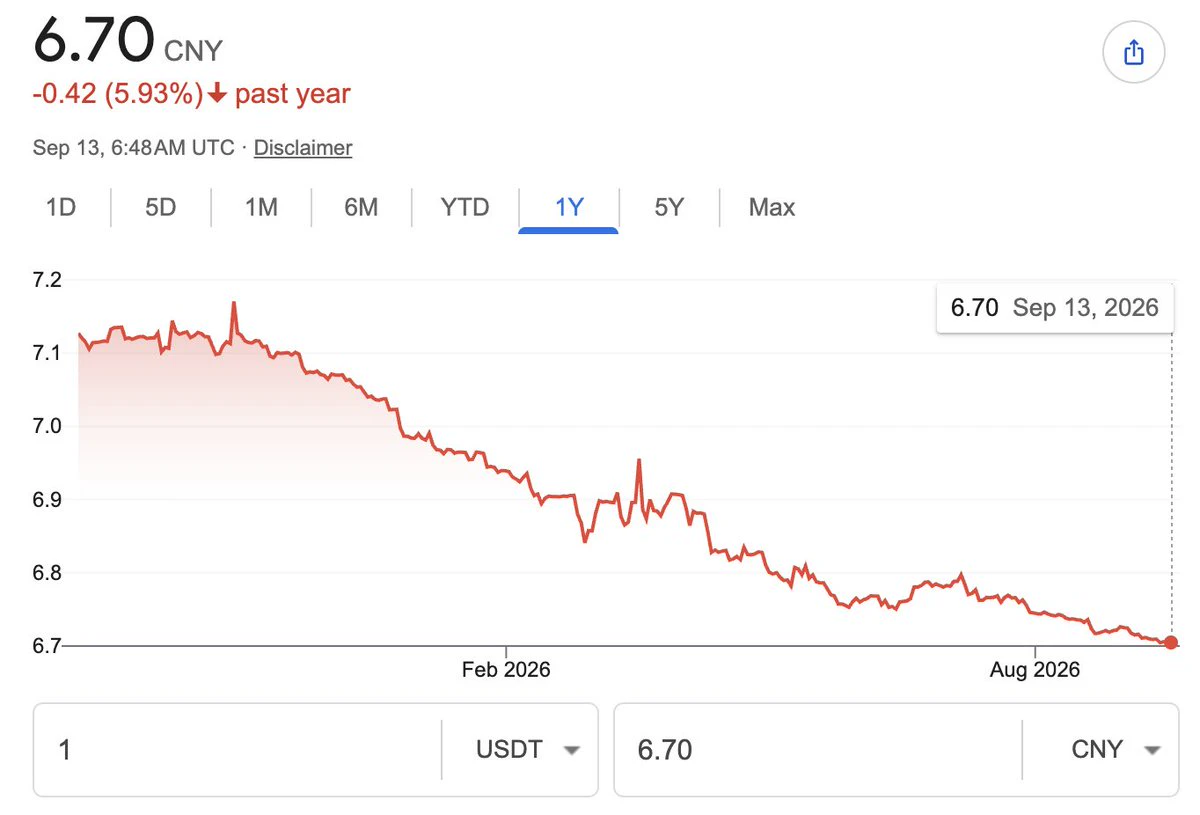
Painful—the USDT exchange rate has fallen from a yearly high of 7.17 to 6.7, while the C2C rate on exchanges has dropped to around 6.61. So just holding USDT and doing nothing means losing 8% anyway.
But there’s also a benefit.
With the RMB worth more, you can exchange it for more USDT to ape into dog coins, right?
post-image
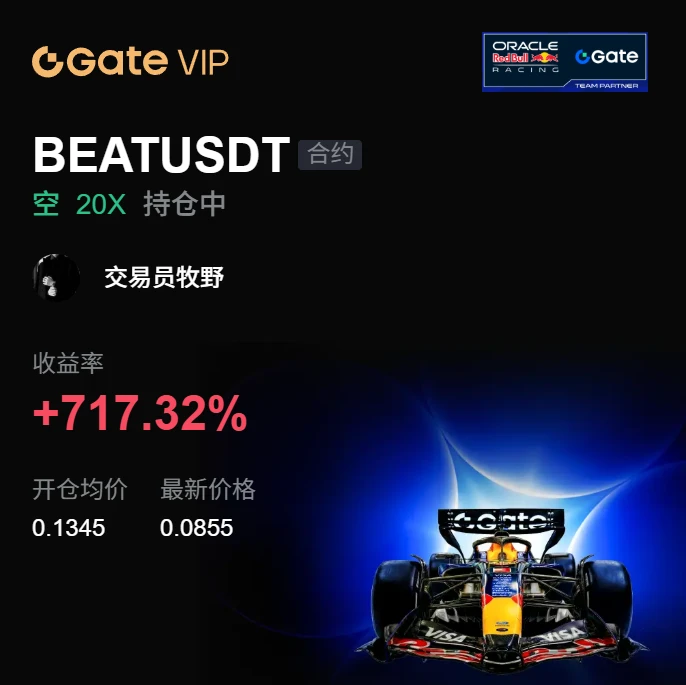
How is this a rebound? This is CPR for my short account, isn’t it? A few days ago, I glanced at $BEAT before bed and almost thought this trade was dead. But when I opened my eyes in the morning, it had obediently moved downward on its own.

My entry price was 0.1345, and the logic was straightforward—the rebound was weak, and every upward push fell just short, feeling like a one-man show with no buyers. With this kind of trend, taking one look clears your head, but buying in makes you foolish, so I treated it as a short.

It’s now at 0.0855, with an unrealized profit of +717.32% in the accou
post-image
BEAT-6.14%
SOL-1.13%
XRP-1.02%
Fed Week Begins With Markets Divided! BTC and ETH Enter a High-Volatility Window
live-cover
LIVE720
IN$IN long long...........absolutely long
l
o
n
g
post-image
IN+2.21%
  • 1
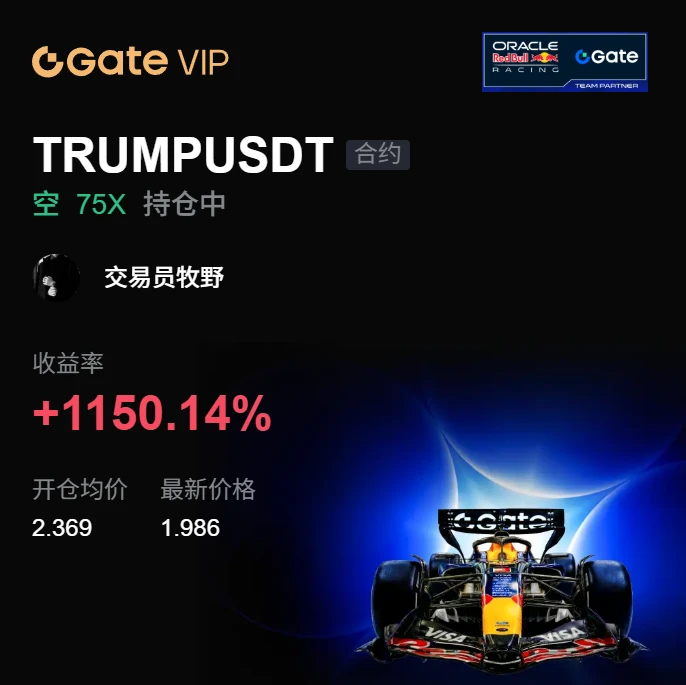
I originally wanted to cut my losses as a sacrifice to the heavens, but the ritual never happened—the meat roasted itself. This is none other than the $TRUMP short position I opened a few days ago.

While everyone was still waiting on the sidelines, I had already entered around 2.369. Why rush? Because before the market had fully started moving, I saw clear resistance above, with each wave of selling pressure heavier than the last, and the rebounds unable to hold at all. If this structure doesn’t call for a short, should I wait for it to come down before buying in?

When I checked the marke
post-image
TRUMP-1.84%
BNB-1.80%
LAB-5.88%
Oil Drops After a Sharp Weekly Surge! Could Falling Energy Costs Change Rate Expectations?
live-cover
LIVE749
🐟 Next week may be the week I’m least interested in making impulsive trades lately.
It’s not that there’s no action. It’s just that there are three cards on the table right now, and none of them is suitable for me to go all-in on a direction ahead of time.
First, BTC is still stuck between 76K and 79K.
There’s resistance above and support below. Around 77K, going long feels too high, while shorting feels too low. The most frustrating thing is being in a range like this. It looks like it’s moving every day, but in reality, whoever chases gets hurt.
Second, the September 16 FOMC meeting.
The ma
post-image
BTC-0.36%
  • 3
#GateAugustTransparencyReport
Gate’s August Transparency Report highlights another important step in the exchange’s ongoing effort to provide users with greater visibility into platform reserves, asset backing and the overall health of its ecosystem.
In crypto, transparency is no longer just a nice feature—it is becoming a fundamental part of user trust.
After years of rapid industry growth, traders increasingly want to know not only what an exchange offers, but also whether its reserves, infrastructure and risk-management practices can support that growth.
That is why regular transparency re
RWA-0.29%
Come have some fish,
after eating fish🐠,
work and life will go swimmingly from now on,
I wonder what it would be like to put a cat here🐷🐷🐷
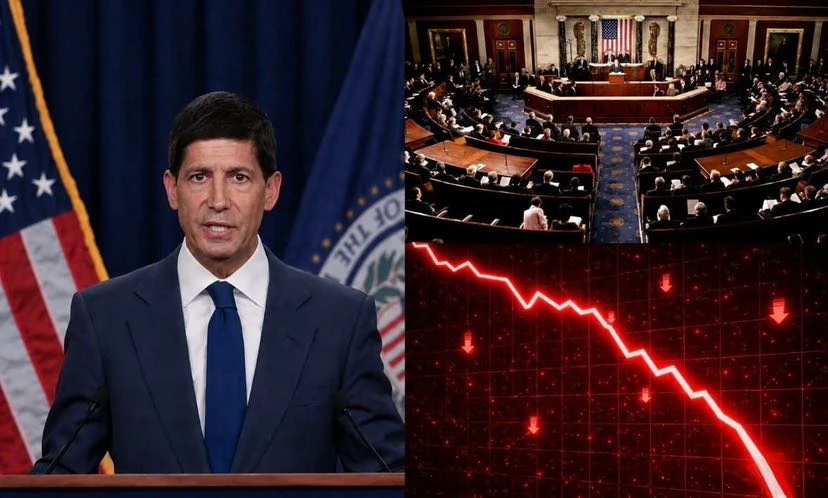
NEXT WEEK IS NOT THE TIME TO RELAX.
September 15 — CLARITY Act.
September 16 — the Fed.
September 18 — the Bank of Japan.
Three days — three events capable of sharply turning the market upside down.
I would be keeping a particularly close eye on positions right now; one unexpected headline, and the candles could fly in either direction.
post-image
Most traders are about to get blindsided by SYMBOL right now.

$XAU /USDT - SHORT

Trade Plan:
Entry: 4356.73 – 4358.21
SL: 4363.37
TP1: 4353.04
TP2: 4350.09
TP3: 4345.67

Why this setup?
Why now? The daily trend is range-bound, which often precedes explosive directional moves when momentum finally breaks. The 1h ATR of 2.950147 shows enough volatility to push price into the entry zone around 4357.47, where the 15m RSI at 46.56 signals weak bullish exhaustion. From there, the target runs to TP1 at 4353.04, with TP2 at 4350.09 as the primary profit objective. The invalidation level sits at 4
XAU-0.02%
Sun’s up, coffee’s ready!
GM back? 🌅
post-image
Load More

Join 40 M users in our growing community

⚡️ Join 40 M users in the crypto craze discussion

💬 Engage with your favorite top creators

👍 See what interests you