Square
Following
Hot
News
Profile
Share your thoughts
placeholder
Article
Bitcoin’s Long Term Cycle Chart Points to a Bigger Question: Are We in Another Accumulation Zone? 🙄
Bitcoin’s historical price cycles show a recurring pattern: major rallies, deep corrections, and long recovery periods.
The chart highlights previous peaks near $19,700 in 2017, $69,000 in 2021, and $126,000 in 2025, alongside earlier areas that some traders viewed as accumulation zones.
Now, the key question is whether the current price structure represents another opportunity to accumulate or whether the cycle is changing.
I think that the Historical patterns can offer useful context, but the
post-image
BTC+0.31%
As Bitcoin attempts to hold its ground at the $82,400 level, the market is simultaneously navigating a heavy flow of macroeconomic data. Over the past 24 hours, the price dipped to as low as $79,795 before recovering to test the $82,630 mark. This movement cannot be attributed to a single factor; rather, several distinct pressures have come into play at once.
PPI surprise and interest rate expectations
The Producer Price Index (PPI) data released in the U.S. for September came in significantly higher than anticipated. On an annual basis, the PPI rose by 6.3%, reaching its highest level in four
post-image
BTC+0.31%
GT+0.09%
ETH+1.41%
SOL+1.42%
XRP+0.94%
  • 13
  • 2
I make about $29k a month with options.
NO Day trading
NO Swing trading
NO Covered calls
NO Cash secured puts
NO BS
INSTEAD, I DO THIS:
Build base portfolio
Sell portfolio secured puts (not cash secured)
Buy LEAPS with the premium from sold puts
BUY shares with the premium from sold puts
Keep ratios in check
I can explain it to a 13 year old & I will likely outperform 95% of people that read this.
Simple wins.
post-image
$TOLLY let’s go 5X
post-image
TOLLY+10.60%
$INJ ‌ has flipped the momentum, and buyers are back in control.
After dipping to $7.061, INJ has rallied to $8.56, reclaiming key levels with a strong hourly breakout. The Supertrend has turned bullish at $7.81, adding strength to the setup.
Key levels:
Support: $8.25–$8.30
Stronger support: $7.80–$7.95
Resistance: $8.56–$8.63
Targets: $8.80 → $9.00
A clean break above $8.56 could extend the move, while holding above $8.25 would keep the recovery structure healthy. After this sharp rally, a retest would be constructive.
INJ is looking stronger. Now it needs to turn this breakout into sustai
INJ+10.27%
NVDA-1.92%
  • 2
I need a memecoin
Low market cap
Shill me tickers $________? 🔥🚀💸
#100x #1000x #memecoin #Gems
post-image
MEME+0.90%
GEMS+1.25%
  • 1
With the same 1,000U, some people doubled their money on $STRK last night, while others rushed in at today’s open and got trapped at the top. Which outcome would you choose?
Let’s look at the data first. $STRK is currently at 0.0881, up 14.3% in 24 hours, with a high of 0.0988, a low of 0.0717, and $465 million in trading volume. What does that mean? An intraday range of 38%, with trading volume several times the circulating market cap. This isn’t an ordinary rally—it’s a meat grinder for bulls and bears.
Bullish logic: STRK’s current move started around 0.07, with genuine volume coming in rat
STRK+14.76%
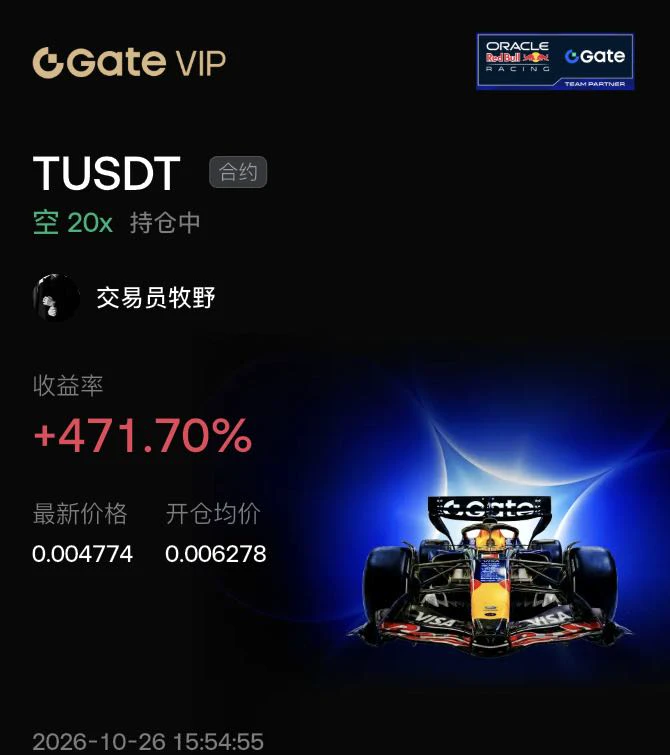
Short-Selling Analysis of the Biggest Decliners: Real wealth is hidden in the red candlesEveryone is mesmerized by green candlesticks. Chasing pumps, chasing hot trends. But where is the real opportunity? It is right in front of you—in the red candles. Most people are too afraid to touch them. These four coins are weakening sharply. The market structure has already broken down. Sellers are fully in control. This is not a pullback, but a trend. Smart money positioned itself long ago. I have carefully examined every chart. No hype, just letting the charts speak. $TRUT
Risk level: HighEntry price
post-image
Bitcoin is BACK over $82,000!!
We are so back!!
post-image
BTC+0.31%
$LAES
A microcap stock in the quantum business. It held the Fibonacci support
post-image
LAES+3.21%
Zero Hunters Crypto Lounge 🎯 | Historical Bangla Adda
live-cover
LIVE698
are cats gonna end up trading better than pigs?
post-image
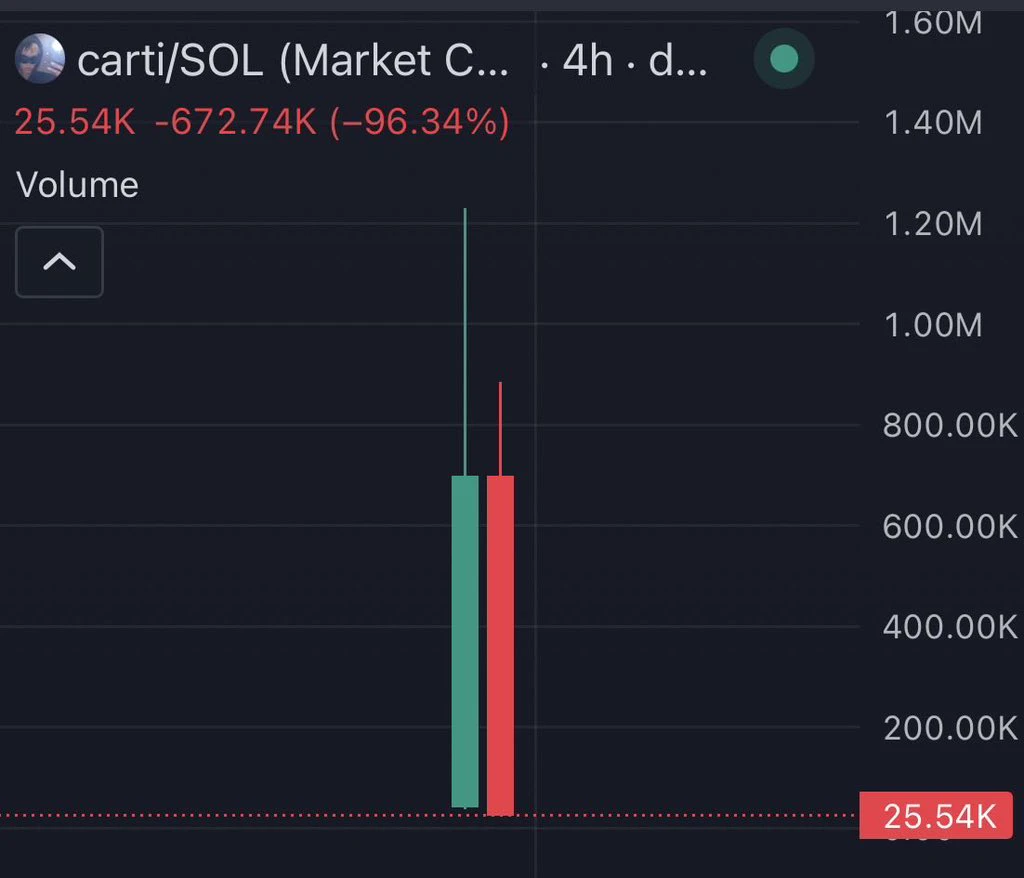
solana:7b6dX3nE25xrfNViEKZHL9wVJFcBxQYuWPpmzHUxx28H 🥀 Zero or Hero there is no in between
7b6dX3nE25xrfNViEKZHL9wVJFcBxQYuWPpmzHUxx28H
#Crypto #memecoin $sol
post-image
SOL+1.42%
$DOGE About To Make Some Gains!?
Just locked into a long on $DOGE!
NFA, DYOR ⚠️
#Crypto #Trading #DOGE
post-image
DOGE-0.40%
Who is truly leading the gains in the same sector? The answer points to $INJ
.
A horizontal comparison makes it clear: $INJ rose 10.92% over 24h, with a trading volume of 24.0M USDT, while $JTO fell 3.94% and $DOGE barely moved (-0.28%) over the same period. All three have an MA5 crossing above MA20, but only $INJ ’s RSI surged to 71.2, with the MACD histogram expanding significantly to +0.136. Its price of 8.379 is already approaching the Bollinger upper band at 8.618, and its 30-candle amplitude of 17.89% shows far greater volatility elasticity than the other two. The funding rate of +0.0
post-image
INJ+10.36%
JTO-3.75%
DOGE-0.40%
Wow 😮 everyone is getting instantly rich 🤑 from this coin solana:DFMt2FyLpB6ekPNAzVErLXgpSnJ9CRf1VnxBAkTLpump
Probably backed by @elonmusk
Gaurantee to make you rich 🤑 100%
Nobody loses it goes up forever ♾️
DFMt2FyLpB6ekPNAzVErLXgpSnJ9CRf1VnxBAkTLpump
post-image
SOL+1.42%
$SKHY
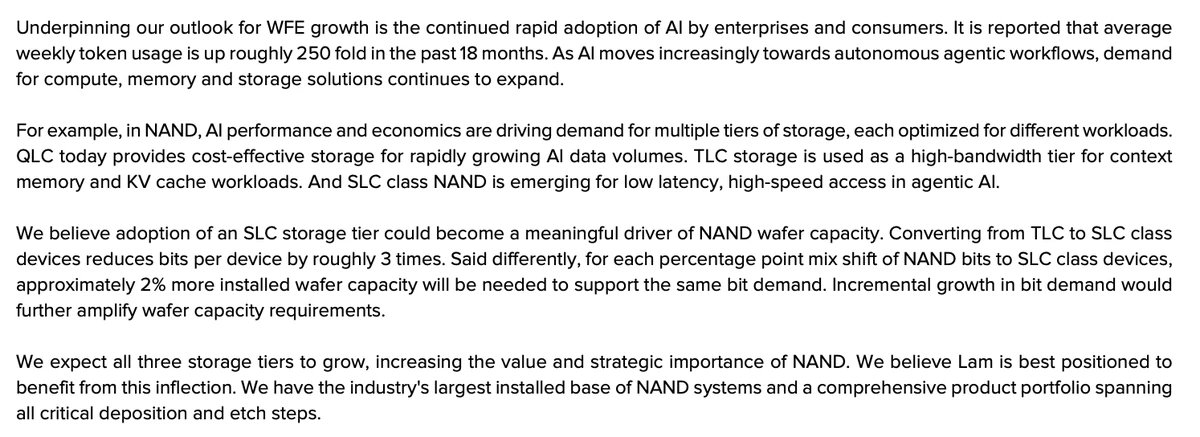
The memory market is straight out of the hog cycle: prices rise, capacity expands; capacity expands, the market crashes; the market crashes, production is cut; production is cut, prices surge again. The entire industry is now pushing hard to ramp up production. If AI demand can’t outrun capacity, beware of the accelerated version of “storage means death” turning into “storage means king.” Those holding positions should wait for the November earnings reports, sell into the rebound, and keep something in reserve. Spend less time scrolling short videos—the sentiment is even more volatile th
post-image
SKHY-0.94%
Layout: Bitcoin, Ethereum, Dogecoin
live-cover
LIVE880
  • 4
Those who went long on SanDisk around 1280 should reduce their positions around 1440.
$SNDK
post-image
SNDK-1.34%
Does a bullish moving-average alignment always mean you should chase long positions?
Not necessarily. The key is whether the price’s position relative to the moving averages is synchronized with momentum. Take $ZEC as an example: the current price is 1235.97, with MA5=1225.24 above MA20=1138.62, forming a standard bullish alignment and indicating a healthy trend direction; however, RSI has reached 70.2, nearing overbought territory, while the price is hugging the Bollinger upper band at 1248.36, making the risk-reward of chasing short-term highs unattractive. A reusable approach is: use movin
post-image
ZEC+8.75%
XPL+7.58%
INJ+10.27%
Load More

Join 40 M users in our growing community

⚡️ Join 40 M users in the crypto craze discussion

💬 Engage with your favorite top creators

👍 See what interests you

Trending Topics

USSeptemberPPIBeatsExpectations

91.35k Views1.88k Discussing

US September PPI came in at 6.3% YoY, well above the 5.3% market expectation, pointing to renewed producer-side inflation pressure. Weekly jobless claims were 199K, broadly in line with forecasts. Could hotter inflation further reduce room for rate cuts, and what does it mean for $BTC, US stocks, and gold?

DrLinHanSpeaksAtOxfordUnion

135.63k Views1.86k Discussing

JapanAndKoreaStocksPlunge

47.27k Views1.76k Discussing

View More