Square
Following
Hot
News
Notifications
Profile
Share your thoughts
placeholder
Article
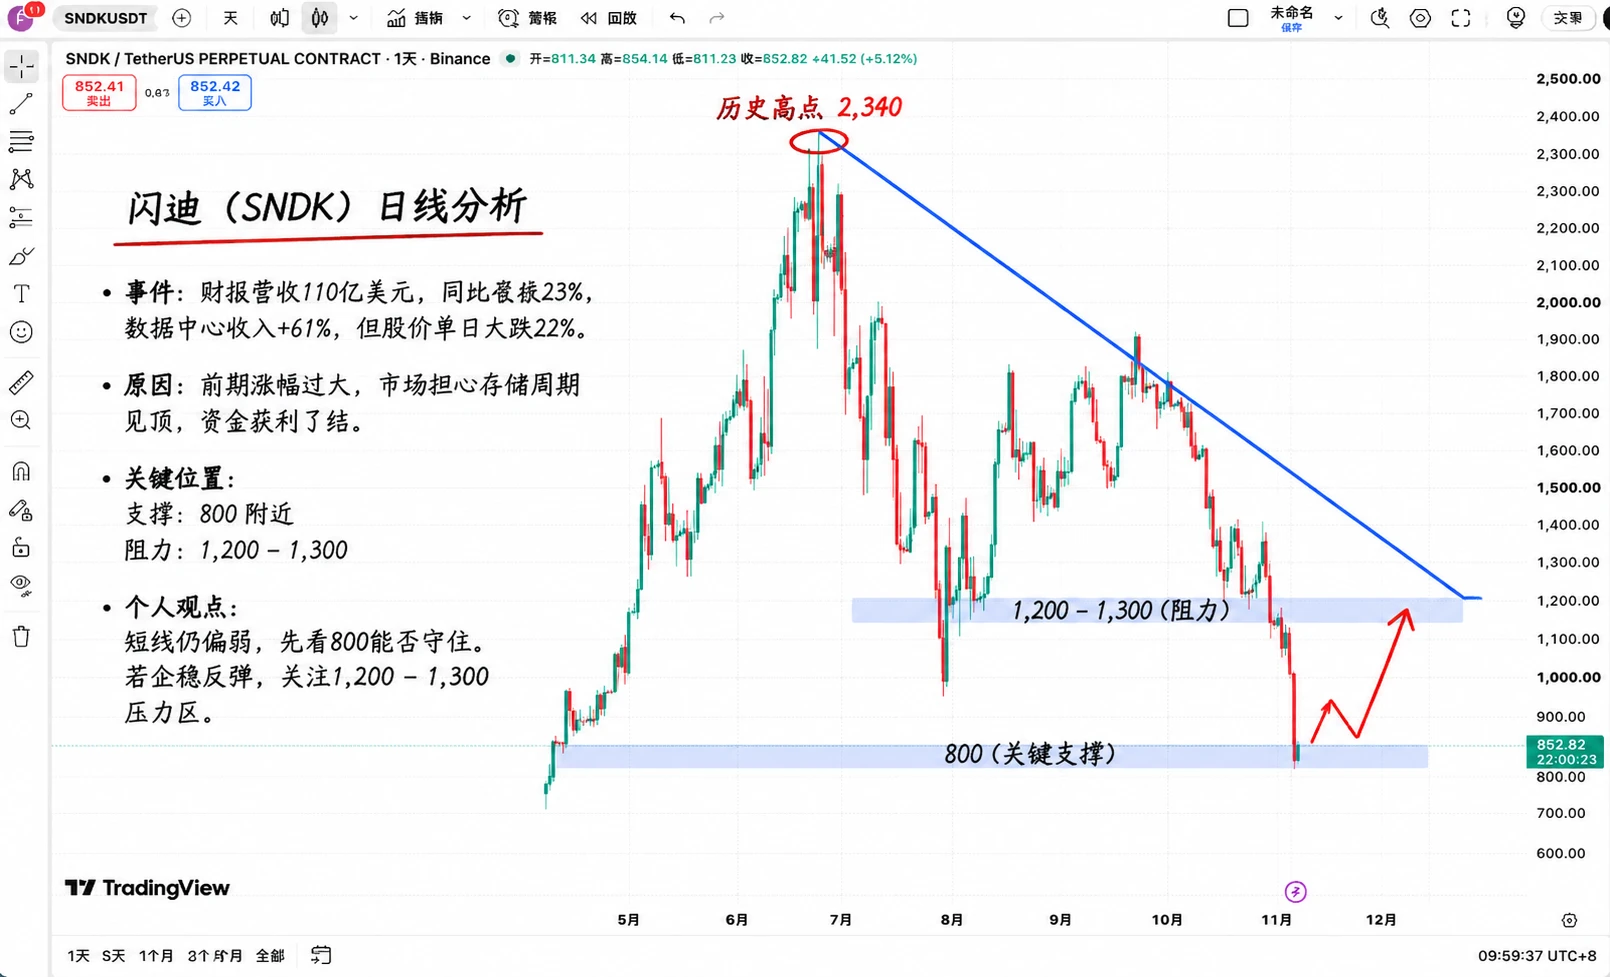
SanDisk really blindsided those who bought the rally this time! It just posted strong earnings, but its stock plunged 22% in a single day, dropping straight to $806.

What’s even more outrageous is that the results were not bad at all.

Revenue for the latest quarter was $11 billion, up 23% quarter over quarter, while data center revenue grew 61%. The company also announced a $5 billion share buyback and an 8-for-1 stock split.

With so much good news, the market still sold.

The reason is easy to understand. SanDisk had surged too much beforehand, and the market had already priced in AI stora
post-image
SNDK-22.24%
A strong start to Friday: 75,300 is the precise dip-buying level, with 1,000 points of room $BTC
BTC-0.65%
Trenches
fxUSD
f
bade
b
fxUSD
0x08...d8f6
Market Cap
$.
Change
.
24h Vol
$.
Holders
.
ZIG
Z
bade
b
ZIG
0x8c...1145
Market Cap
$.
Change
.
24h Vol
$.
Holders
.
BTC
B
bade
b
BTC
C5xp...pump
Market Cap
$.
Change
.
24h Vol
$.
Holders
.
CORLA
C
bade
b
CORLA
0xba...7777
Market Cap
$.
Change
.
24h Vol
$.
Holders
.
STONK
S
bade
b
STONK
6GmA...UNgx
Market Cap
$.
Change
.
24h Vol
$.
Holders
.
The S&P 500 is making new highs again, but I’m not chasing it here. The reason is simple: the index is at a new high, but macro support is starting to falter. A rally on no volume is, frankly, a sham—it’ll have to make up that volume sooner or later. Prices can be driven higher on sentiment and a handful of heavyweight stocks, but volume doesn’t lie. In past cycles, whenever the index hit new highs on volume well below its 50-day average, advances failed to broaden across stocks, and gains were concentrated in a few mega-caps, the market usually had to go through a “volume catch-up” phase afte
SPX+0.33%
SPYX+0.01%
  • 11
  • 1
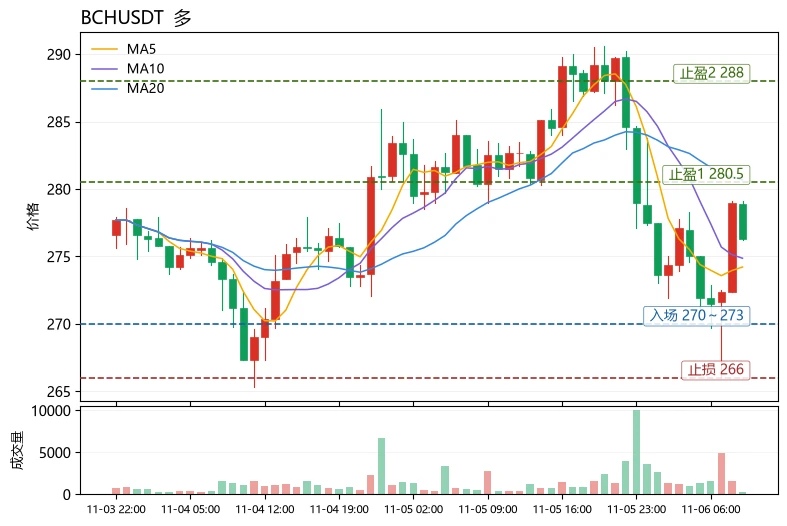
$BCH is currently in a weak consolidation phase, which does not yet constitute a healthy trend. In the short term, focus on buying dips near the range lows and exiting quickly; avoid chasing longs.
First, the method: To judge whether a trend is healthy, look at two things. First, the moving average alignment: the relationship between MA5 and MA20 determines the direction of short-term momentum. Second, price’s position within the Bollinger Bands combined with RSI: if price is near the lower band while RSI remains above 30, it is usually a low-volume pullback rather than a trend breakdown. BCH
post-image
BCH+1.05%
XTZ-2.61%
ENA+8.04%
Those who follow the trend thrive; those who go against it perish👊$BTC
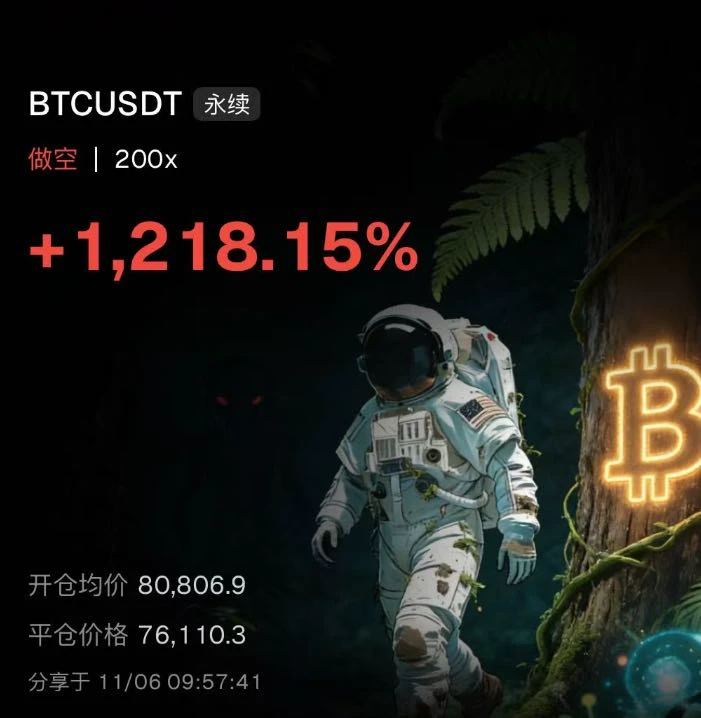
How many people last night, clinging to bullish fantasies, tried to buy the dip only to catch it halfway down?
We stayed firmly bearish, entering a short at 80800
We held all the way to 76100, securing a 1218.15% return
Trading has never been about luck; it’s about accurately reading the trend
Don’t call a bottom in a downtrend. Follow the direction, and profits will naturally follow
#美股史诗级抛售
post-image
BTC-0.67%
#BTCBackAbove80K
Bitcoin’s return above $80,000 is not a speculative event; it is the logical outcome of structural market evolution and institutional validation.

The narrative surrounding digital assets has fundamentally shifted. Bitcoin’s reclamation of this valuation tier is no longer driven primarily by retail sentiment or transient hype cycles. Instead, it reflects a convergence of macroeconomic hedging, robust network fundamentals, and deepening integration into global financial infrastructure. For professional investors, this level represents a critical juncture where historical resis
post-image
BTC-0.67%
#BTC
Bitcoin's Sharp Reversal: The $80K Recovery Failed, and Now the $75K Zone Is Back in Focus

Bitcoin's latest price action has changed the short-term market picture. After recovering above $80,000, BTC failed to maintain its upward momentum and experienced another aggressive sell-off. The price moved from approximately $81,105 to $76,059, representing a decline of around 6.22% from the recent high. What looked like a recovery quickly turned into renewed selling pressure, bringing the $75,000 region back into the market's immediate focus.

The important part of this move is not simply the
BTC-0.67%
QCOM-9.69%
NVDA-9.33%
NDAQ-2.63%
#黄金突破4100美元 #WCTCS9 $4,100 reclaimed, then lost again; bulls and bears await one result before nonfarm payrolls

In early Asian trading, gold was range-bound near $4,097, with last night's pullback after a sharp rally leaving the suspense for tonight.
Spot gold briefly hit a two-week high of $4,147 during Thursday's US session, then retreated as the sell-off in US stocks intensified, eventually closing at $4,088.33, with gains narrowing to 0.69%. Early today, gold repeatedly swung between $4,085 and $4,100,
reclaiming $4,100 only to lose it again, as neither bulls nor bears dare to make a move
XAUUSD-0.56%
  • 8
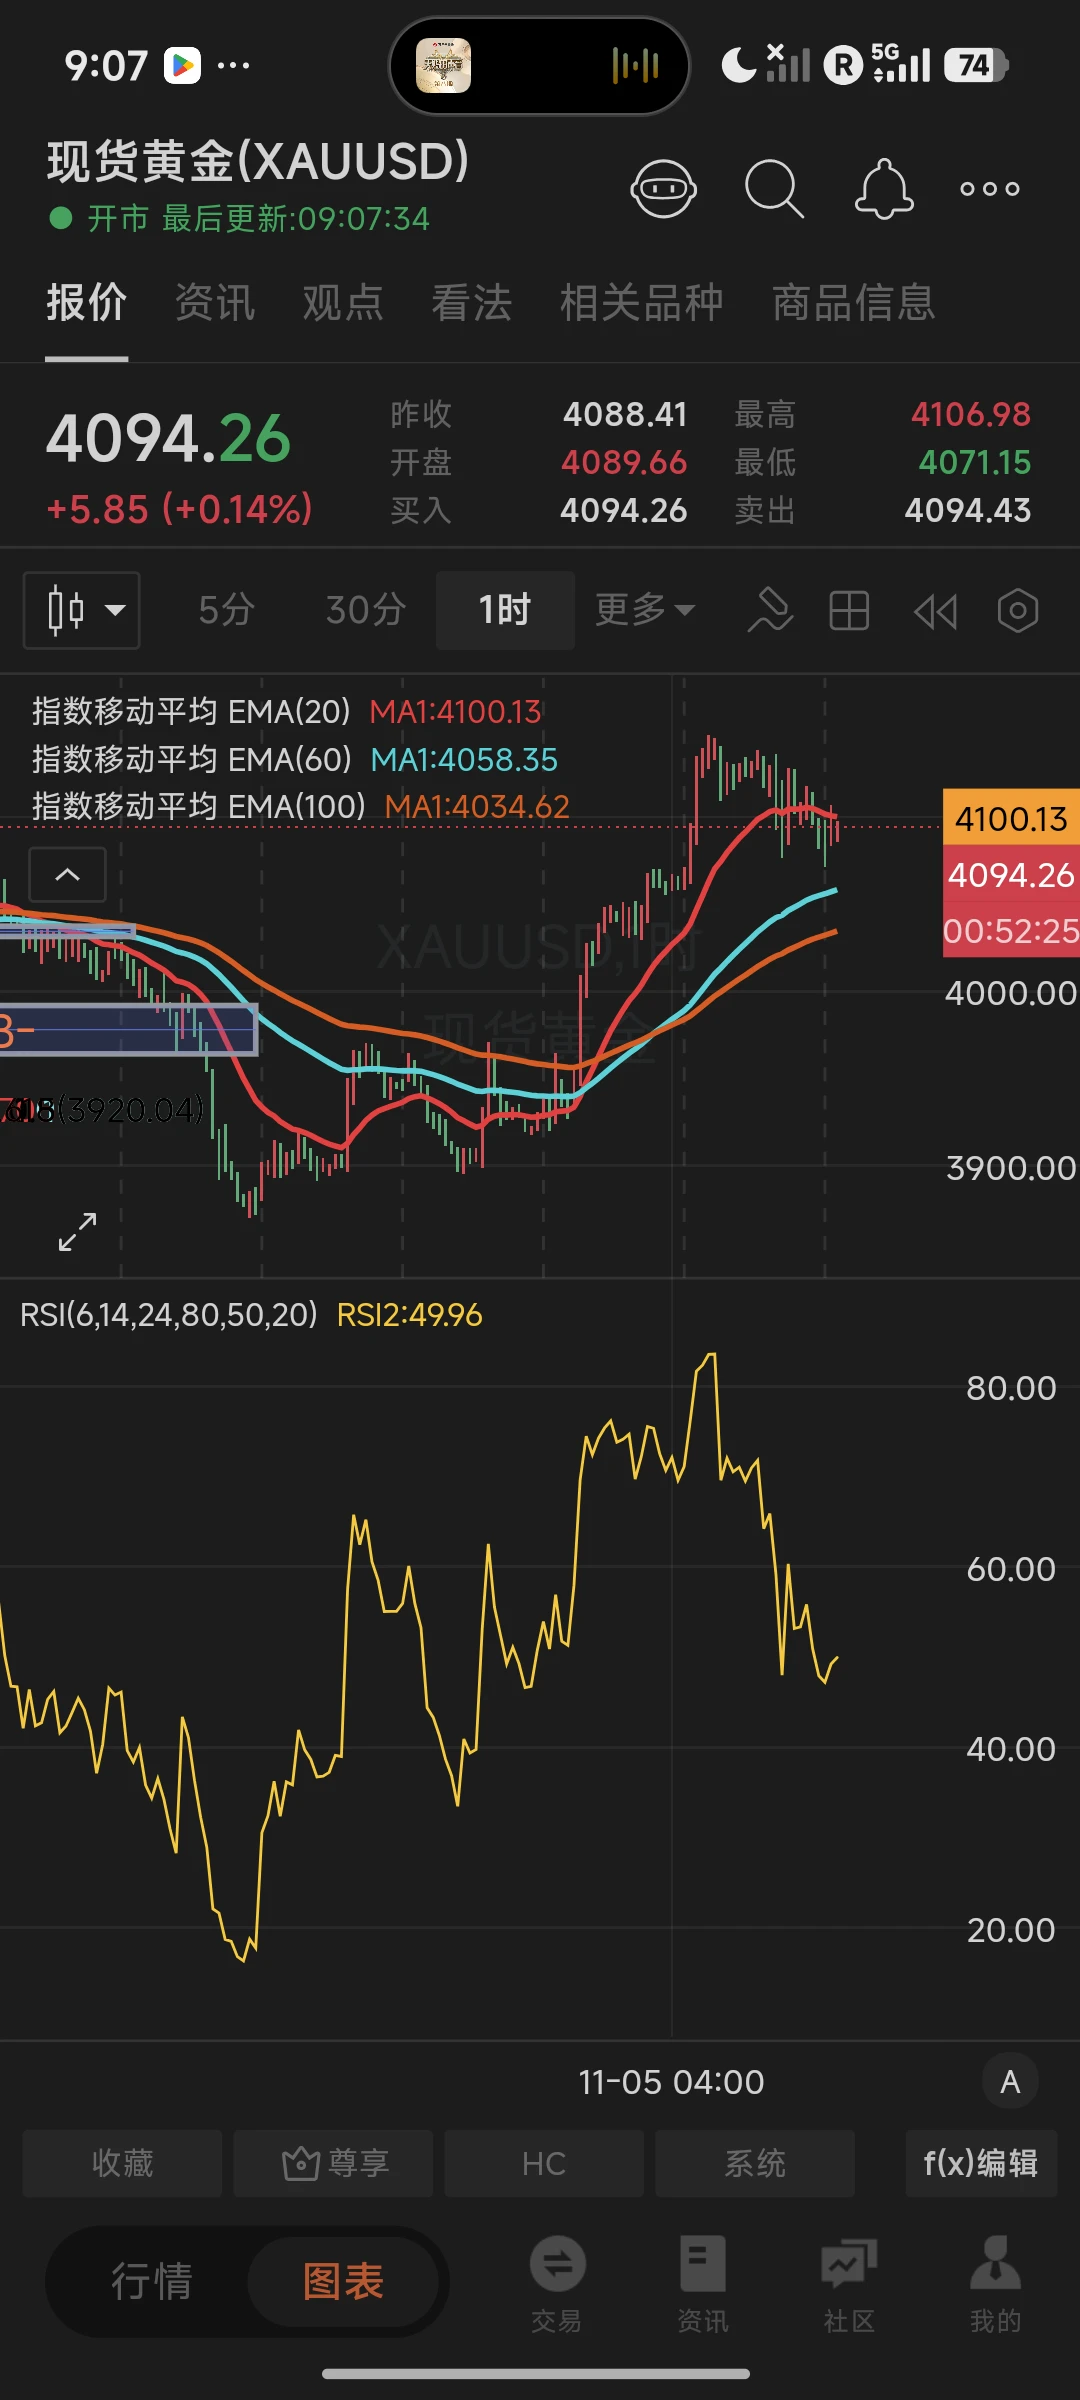
11.5 XAUUSD Asian-European Session Outlook$XAUUSD

Yesterday, the daily chart price was rejected near the resistance at 4143. Today, watch for a retest of this resistance during the day session. The next lower resistance is around 4126.

Resistance above: around 4126 (1h), around 4142 (4h, 1day), around 4178.6 (1day), 4420-4238 (1day)

Support below: 4064-4070 (4h), 4000-4014 (4h), 3966-3970 (1day)
post-image
XAUUSD-0.56%
  • 1
Brother Ma @elonmusk, give me some tokens. I can't take it anymore. Please, bro, just a little. I won't touch it again, I swear. Please, bro. Really, just a little. I swear I'll never touch this stuff again. I can't take it anymore, bro. I'm tossing and turning and can't sleep. Bro, I'm begging you, just give me a little. Give me some more, bro. I can't take it anymore. Please, bro, I feel like ants are crawling all over me. I feel like my whole body is shaking. I can barely breathe. Please, bro, just a little. I won't touch it again. Please, bro. Really, just a little. I swear I'll never touc
post-image
TOKEN-0.16%
Morning update with skyvera
live-cover
LIVE1,816
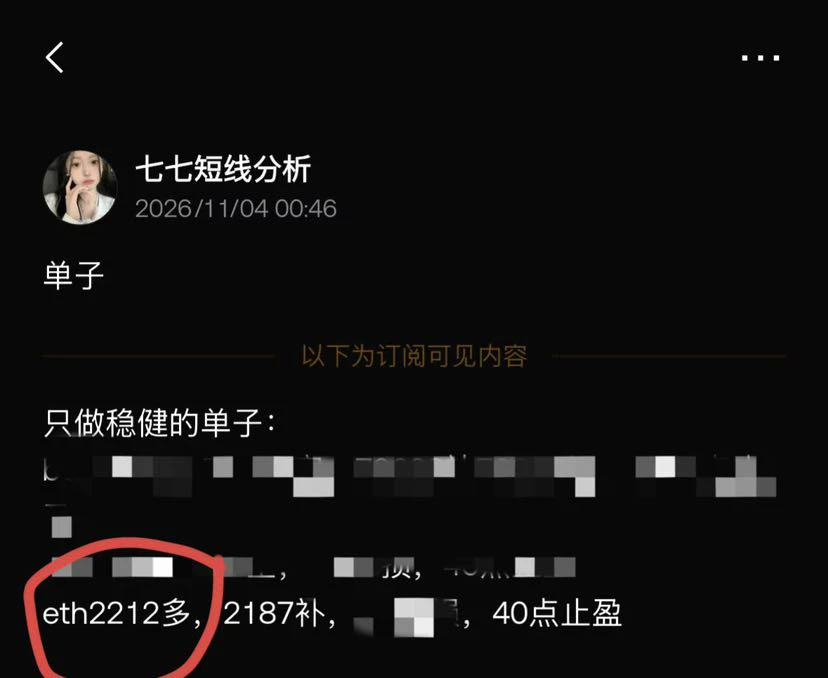
The previous long at 2212 got filled
post-image
  • 5
1: Congratulations to the subscribers! Last night’s JCT spot trade gained up to 18%, from the tweet price to the first take-profit level.
Recap:
Yesterday’s JCTUSDT pickup code: tweet price 0.00379, short.
Best entry: 0.004-0.0044. While I was writing the tweet, the coin wicked upward, reaching a high of 0.00459. To be safe, I moved both the original best entry and stop loss up a little. In hindsight, the price action after the wick was still stable. Of course, if the best entry wasn’t reached, only the initial position entered at the current price remained.
Stop loss: 0.0045
First take-profit
BTC-0.67%
ETH-1.26%
XAU+0.38%
GT-2.41%
  • 8
  • 2
$ACT Accumulation is complete, the big move is starting. Get on board quickly, guys🤩Go long now🔥🔥Tp1. 0.0096Tp2; 0.01Tp3: 0.0125Sl: 0.00872$LYN $XMR
post-image
ACT-1.19%
LYN-0.44%
XMR+0.00%
Morning updates with beautiful girl
live-cover
LIVE1,680
AI can't do without Trump, and crypto can't do without Trump. Those who voted must be regretting it now, right?🥹#美股史诗级抛售 $BTC ‌
post-image
BTC-0.65%
$AIN Israel's way of fleecing investors: advance notice
AIN+3.85%
  • 4
#ETH跌5.5% #WCTCS9 This Ethereum drop was first driven by pressure from U.S. stocks and macro factors, then compounded by ETH-specific capital flows. ETH fell harder than Bitcoin, indicating heavier selling pressure of its own.

U.S. stocks and macro factors are the main causes
Rate hike expectations rise: The probability of a rate hike in December climbed to around 75%, reducing the appeal of non-yielding coins.
Tech stocks lead the decline: Confidence in the AI narrative wavered, risk capital pulled back, and the crypto market was sold off in turn.
GDP comes in strong: U.S. GDP grew 3.4% in t
post-image
ETH-1.26%
  • 1
Are these 100-plus points being saved up to send red envelopes in the family group chat for Lunar New Year?
post-image
11.6 Market Trend Analysis

ETH Strategy Reference Setup
Rebound zone: short around 2250--2270
Stop loss: 2310
First target: 2200, second target: 2150

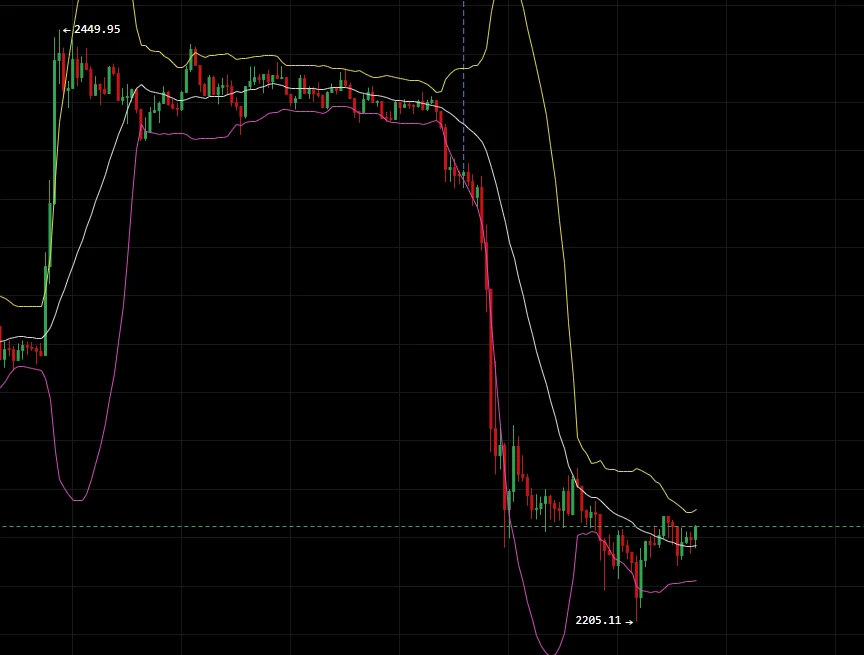
Dream of a surge shattered! A wave of heavy-volume selling directly reversed the short-term trend.

On the one-hour chart, after reaching a high of 2449.95, the market came under pressure and plunged. Heavy-volume long bearish candles successively broke through layers of key support, with the low reaching 2205.11 and the current price at 2238.32.
The previous bullish structure has been completely broken, with bearish selling pressure released i
post-image
BTC-0.65%
ETH-1.23%
Load More

Join 40 M users in our growing community

⚡️ Join 40 M users in the crypto craze discussion

💬 Engage with your favorite top creators

👍 See what interests you

Trending Topics

USStocksFaceHistoricSelloff

1 Views3.43k Discussing

U.S. stocks suffered a sharp selloff on Thursday, with the Nasdaq closing down more than 5% and the Philadelphia Semiconductor Index falling over 12%. AI and chip stocks including $NVDA and $AMD were hit especially hard. Markets are reassessing AI valuations, data-center spending and future returns. Is this just short-term deleveraging, or the start of a deeper correction in the AI trade? Which sectors are you watching next?

GateLaunchesPoSECProofOfSecurity

10.9k Views558 Discussing

USNonfarmPayrolls

8.57k Views3.96k Discussing

View More