
Square
Following
Hot
News
Notifications
Profile
Share your thoughts
placeholder
Article
idk what all the drama is about but I hope you guys had a great Saturday
post-image
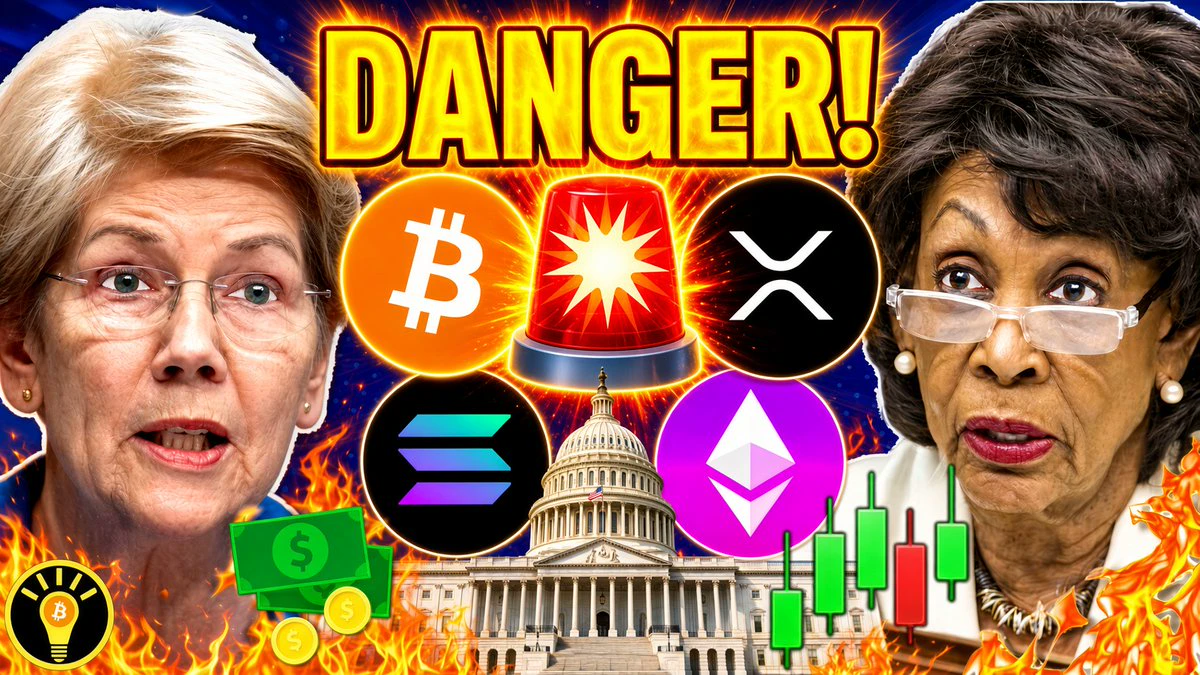
🚨WARNING! ELIZABETH WARREN TO ATTACK CRYPTO AGAIN WITH NEW SENATE BANKING POWER!
WATCH ▶️
#crypto #cryptonews #bitcoin #senate #congress #clarityact #stablecoins #banks #thinkingcrypto
post-image
BTC-0.67%
Trenches
ZIG
Z
bade
b
ZIG
0x8c...1145
Market Cap
$.
Change
.
24h Vol
$.
Holders
.
STONK
S
bade
b
STONK
6GmA...UNgx
Market Cap
$.
Change
.
24h Vol
$.
Holders
.
IDOL
I
bade
b
IDOL
0x3b...ab07
Market Cap
$.
Change
.
24h Vol
$.
Holders
.
MAGGIE
M
bade
b
MAGGIE
8rHo...PmZV
Market Cap
$.
Change
.
24h Vol
$.
Holders
.
FLOAT
F
bade
b
FLOAT
Bv1a...BMmr
Market Cap
$.
Change
.
24h Vol
$.
Holders
.
#USAIStocksHitHard 📉 US AI Stocks Hit Hard | Is the AI Rally Losing Momentum?

US AI and semiconductor stocks are facing renewed selling pressure as investors reassess valuations, earnings expectations, and the outlook for continued AI-driven growth.

⚠️ A sharp pullback in major AI names could put further pressure on the broader tech sector and potentially spill over into crypto markets.

👀 Traders are now watching closely for key support levels, upcoming economic data, and whether institutional investors see this dip as a buying opportunity—or the beginning of a deeper correction.

🔥 Is t
post-image
NDAQ+0.28%
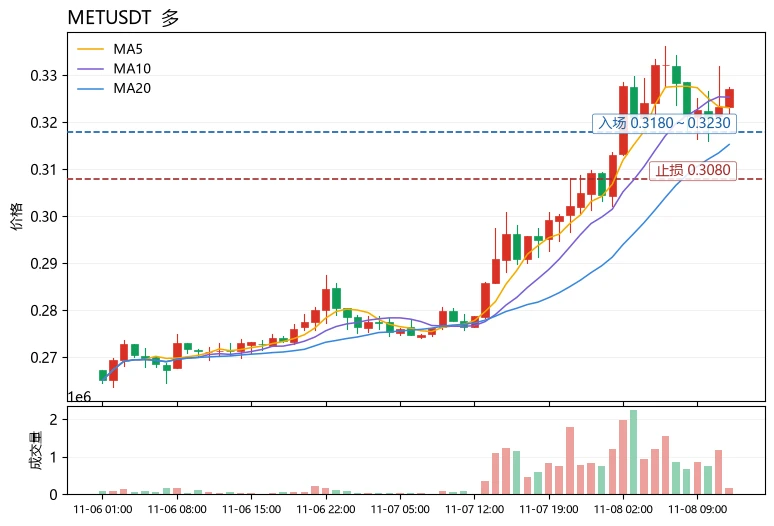
$MET Trend watch: After rising from the bottom area, trading volume has increased significantly as the price rebounded. It has moved back above the 7-day and 25-day moving averages, and short-term sentiment is warming. The market shows active capital inflows driving the move, with strong bullish momentum. There is still room for further upside, so the strategy is to add to long positions in line with the trend⬇️⬇️⬇️

MET +18.68%
Risk warning: The above is only my personal market view and does not constitute investment advice. Contract trading is highly volatile, so please manage your position
post-image
MET-0.16%
Layout: Bitcoin, Ethereum, Dogecoin
live-cover
LIVE880
  • 1
BTC | ETH | Gold | Crude Oil
live-cover
LIVE5,004
#BTCETFOutflowsContinue ETF Outflows Continue: What Does It Mean for the Bitcoin Market?

Bitcoin exchange-traded funds remain an important part of the cryptocurrency market because they provide traditional investors with a regulated way to gain exposure to Bitcoin. However, continued outflows from Bitcoin ETFs are attracting attention from traders, analysts, and long-term investors. When money continues to leave these investment products, it can create questions about institutional demand, market confidence, and the future direction of Bitcoin.

BTC ETF outflows mean that investors are withd
BTC-0.31%
  • 10
BTC Outlook for the Next Year: Analysis of Three Possible Market Scenarios!
In the cryptocurrency market, many investors want to know in advance how high BTC will rise over the next year. But predicting prices is never simple. Rather than trying to give a definitive target, it is better to analyze several possible scenarios based on different market conditions.
First, the bullish scenario: Continued inflows. If global liquidity conditions improve, institutional funds continue to enter the market, and demand keeps growing, BTC may regain upward momentum. In this case, the market could form a ne
post-image
BTC-0.67%
#Gate股票畅聊季
The global stock market is constantly evolving, creating new opportunities and challenges for investors. From technology and artificial intelligence to semiconductor companies, electric vehicles, banking, and energy, every industry is experiencing changes that can influence market performance. Gate's Stock Discussion Season brings the community together to explore these developments, share valuable insights, exchange trading experiences, and discuss the future of investing.

In today's financial environment, successful investing requires more than simply watching stock prices. Inves
  • 7
Is the Fed about to act again? Odds of a December rate hike surge to 77.7%—are Bitcoin and U.S. stocks ready?

The market had just breathed a sigh of relief, but the latest U.S. nonfarm payrolls data has reignited anxiety.
The U.S. added 165,000 nonfarm jobs in October, far more than the market expected. The strong jobs report has investors worried that the Fed may continue tightening policy.
Market bets on a December rate hike have reportedly climbed to 77.7%.
If expectations continue to rise, U.S. stocks and Bitcoin could both face renewed pressure.
Why?
Because a high-interest-rate environm
NVDA+2.80%
  • 15
#Ahr999EntersBottomBuyingZone

Ahr999 Enters the Bottom-Buying Zone: Is Bitcoin Finally Becoming Undervalued?

The Myth: A Low Indicator Means Bitcoin Cannot Fall Further

Does a low Bitcoin valuation indicator mean the market has already reached its bottom? Not necessarily. This is one of the most common misunderstandings among crypto investors.

The Ahr999 indicator has entered its historically recognized bottom-buying zone, bringing renewed attention to Bitcoin's long-term valuation. However, an attractive valuation does not guarantee an immediate price recovery. It tells us that Bitcoin i
post-image
BTC-0.67%
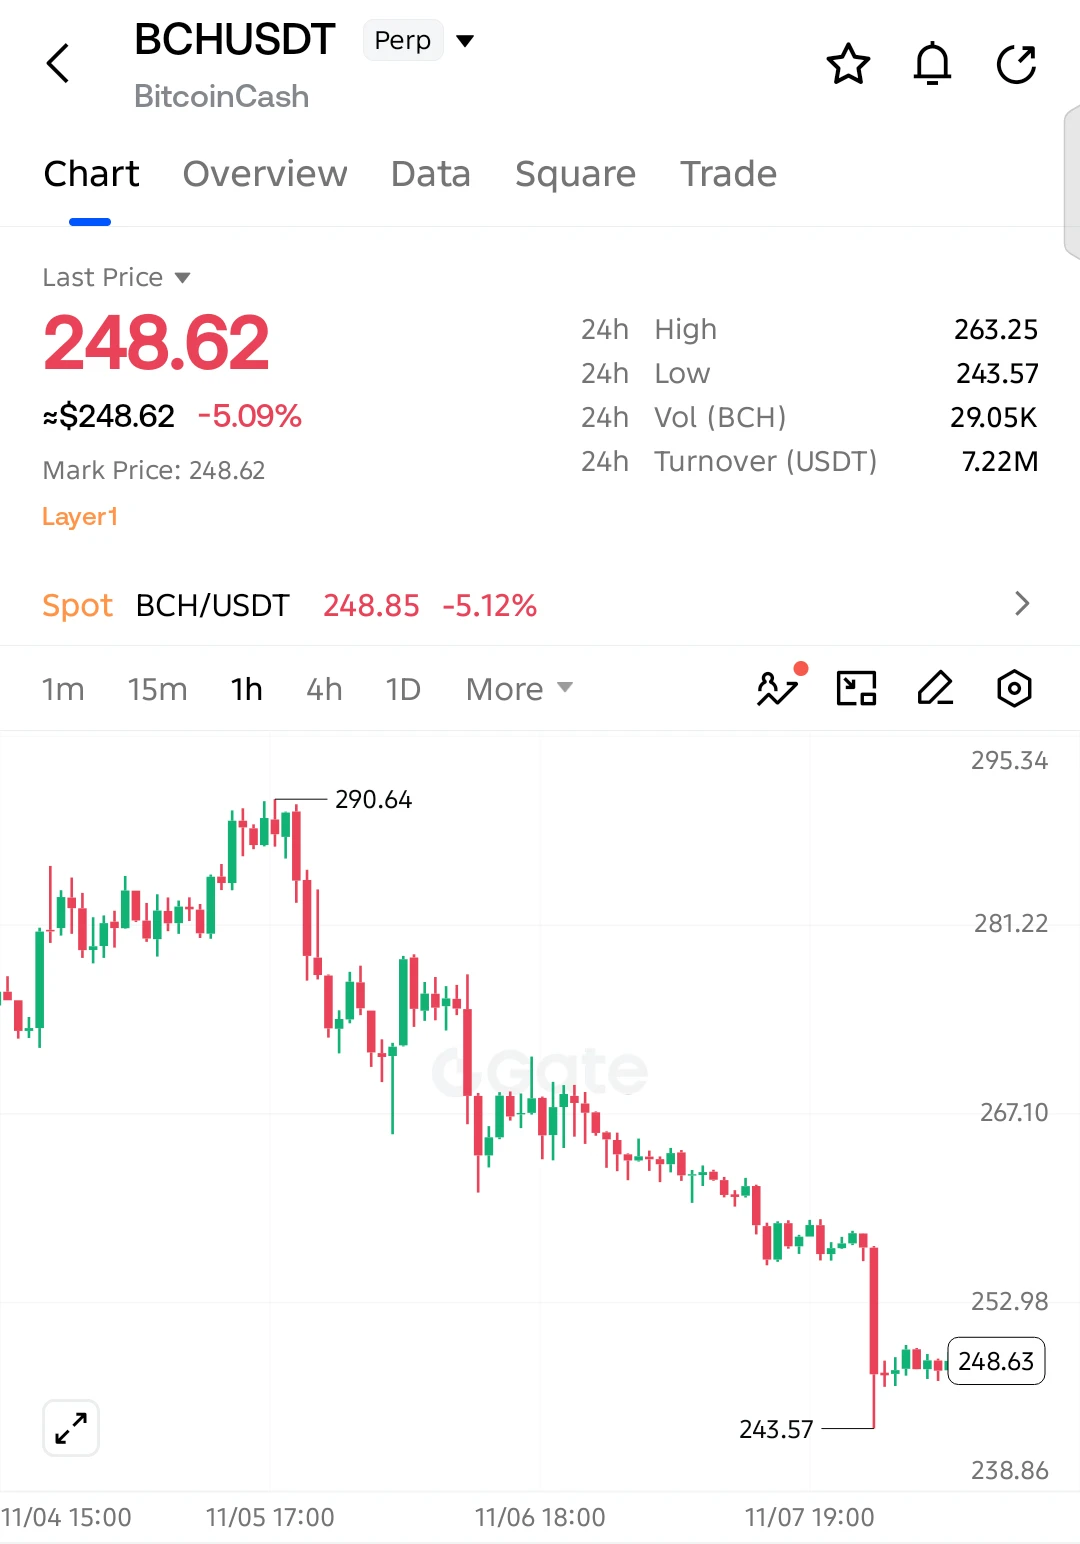
$BCH SHORT SETUP — SELLERS TARGET ANOTHER BREAKDOWN!

$BCH is down 5.09%, with selling pressure continuing after a sharp decline from 290.64. The bearish trend remains intact!

Entry: 248.62
SL: 253.40

TP1: 243.57
TP2: 240.00
TP3: 238.86
Final Target: 235.00

Sellers remain in control as $BCH struggles to recover above 253.00. The latest consolidation near the lows shows weak buying momentum, and a breakdown below 243.57 could trigger another decline toward 240.00 and potentially 235.00.

Invalidation: A sustained recovery above 253.40 weakens the bearish setup.
post-image
BCH+1.05%
  • 1
Are Bitcoin ETFs being shunned by institutions en masse? $870 million in outflows—is the bull market’s engine running out of fuel?

The Bitcoin market has recently staged a large-scale real-life version of Fast & Furious: prices haven’t fully recovered, but ETF funds have already started accelerating their exit.
U.S. spot BTC ETFs saw cumulative net outflows of nearly $870 million this week, and institutional funds have clearly become more cautious.
People used to think ETFs were a supercharger for Bitcoin, but now it seems even an engine can stall.
So, does this mean the bull market is over?
BTC-0.31%
$RITUAL USDT - 0.029569

1. PROJECT DETAILS
Ritual is a Layer 1 for AI. It puts AI inference on chain. Devs can build AI apps that run in smart contracts. Focus is on open AI, proof, and compute. Token is used for fees, staking, and rewards for node runners. AI + Layer 1 hype keeps it on watch lists.

2. WHY IT ROSE TODAY
Price up +43.17% to 0.029569. 24h High 0.035519 Low 0.020360. Sharp pump from 0.016110 low. MA5 at 0.027664 is below price. MA10 at 0.023877 is below price. MA30 at 0.022947 is far below price. MACD at 0.001161 is above zero. DIF 0.001727 above DEA 0.000566. That shows strong
post-image
  • 5
The crypto wallet that lets you log in with one tap using a Google account has run into trouble.
Keplr is a veteran wallet in the Cosmos ecosystem. You can log in directly with a Google or Apple account without writing down a seed phrase. The feature relies on a third-party service, Web3Auth.
Now Web3Auth’s system has a vulnerability, and Keplr has confirmed that the private keys of some users who logged in this way were exposed. Some accounts had already seen transfers they hadn’t initiated, so Google and Apple logins were suspended immediately.
The most worrying part is that some people open
post-image
ATOM+0.49%
Many people rush to buy the dip when they see negative funding rates, but overlook that relative strength is the source of excess returns. During the same period, $TRX$TRX rose just 1.04%, with a 1.12% range, and its Bollinger Bands were nearly flat—a typical low-volatility sideways market; $UNI $UNI rose 1.94%, with a 5.2% range and an RSI of 55, merely following the rally moderately. Meanwhile, $MET rose 18.20% in 24 hours, with a range of nearly 19%. MA5 crossed above MA20 and the price held above the moving averages, while the RSI of 66.7 had not yet entered overbought territory. Its signi
post-image
UNI+3.05%
MET-0.33%
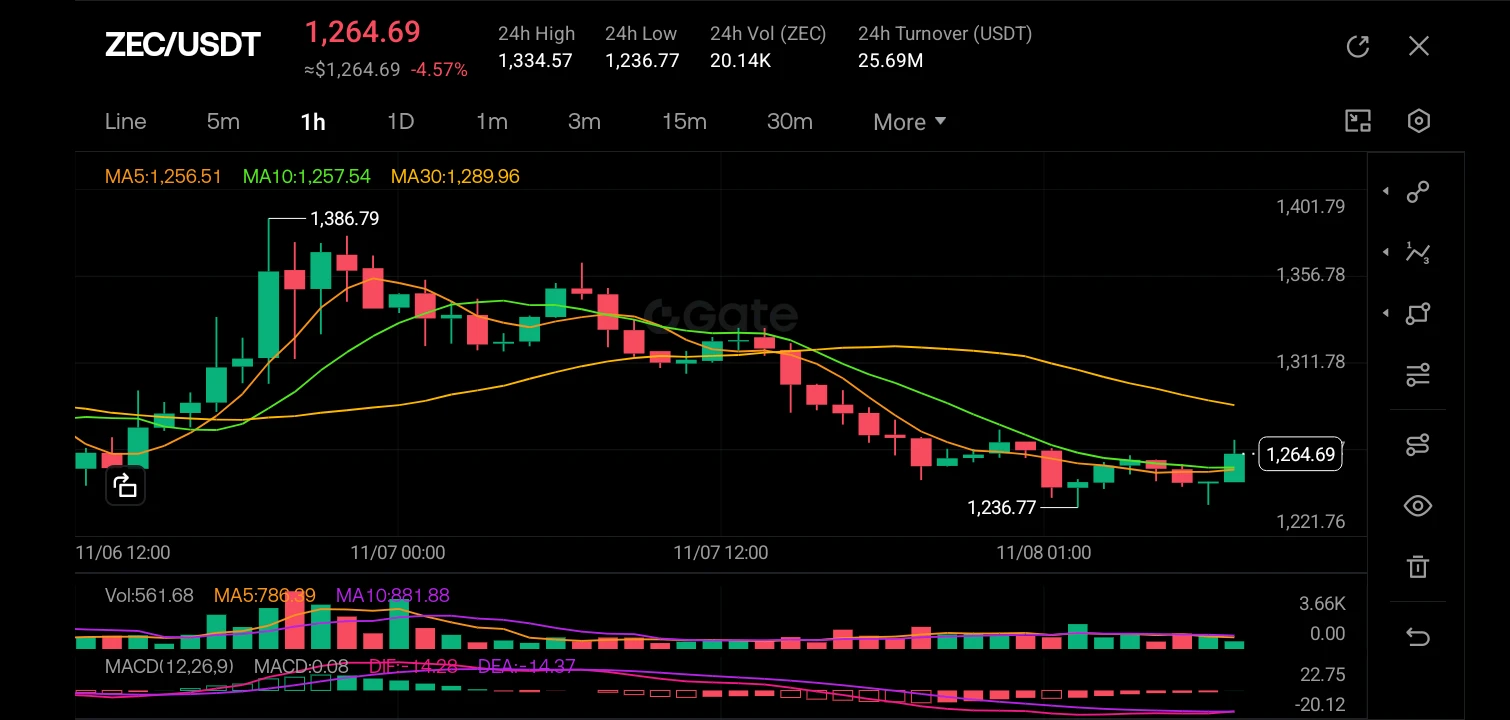
$ZEC ‌
The 1-hour chart reveals a definitive shift in market structure from a bullish uptrend to a corrective phase; after peaking at 1,386.79, the price action has formed a series of lower highs and lower lows, currently consolidating near the 1,264 level. The asset is trading below the yellow MA30 (1,289.96) which acts as dynamic resistance, while the shorter-term MA5 and MA10 have flattened out, indicating a momentary pause in the downtrend. The MACD histogram is hovering just below the zero line with a slight bullish convergence (golden cross forming), suggesting that the selling momentum
post-image
ZEC+1.16%
  • 3
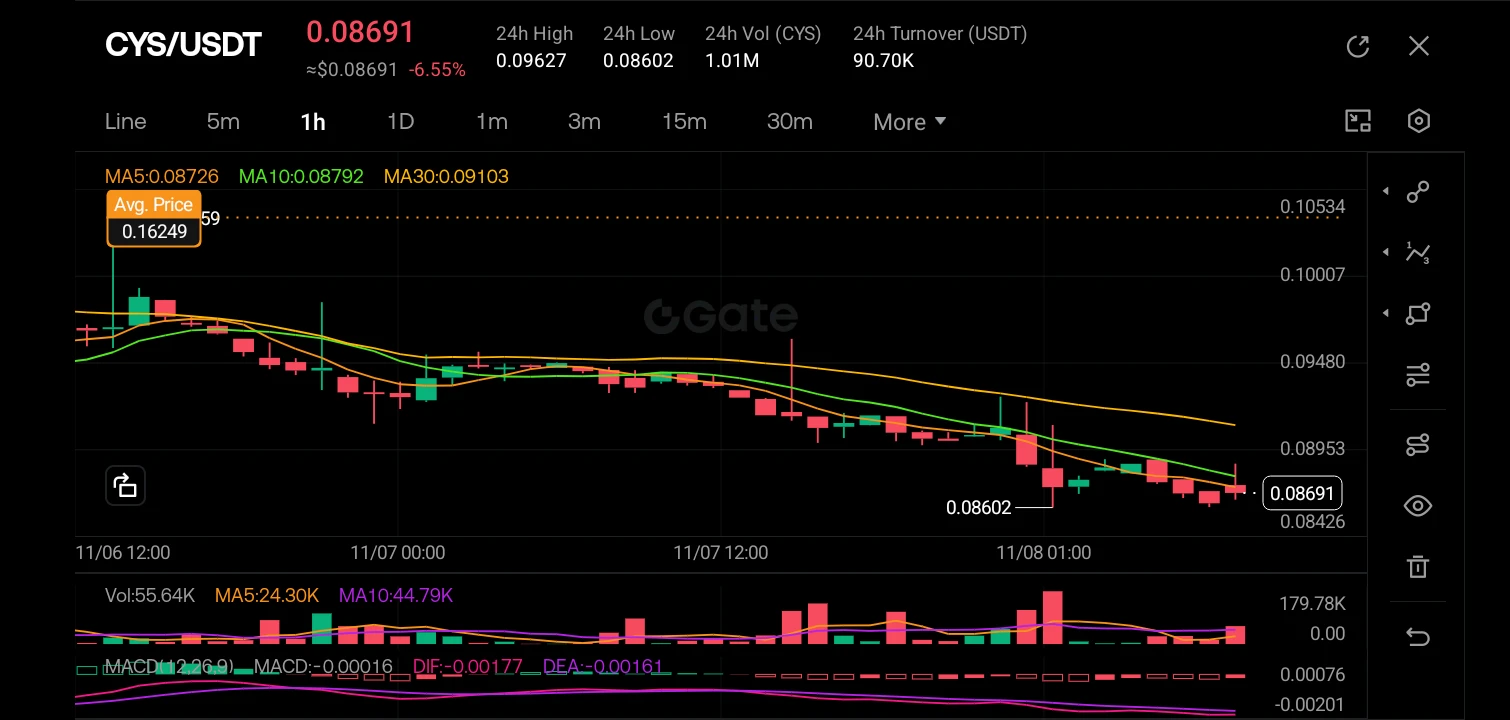
$CYS ‌
The 1-hour chart is locked in a brutal, unrelenting downtrend, with the price action consistently printing lower highs and lower lows while getting rejected by the descending moving averages (MA5, MA10, and MA30 are all fanned out bearishly above the price). The current price of 0.08691 is hovering dangerously close to the 24-hour low of 0.08602, indicating heavy selling pressure, and the MACD is deep in negative territory with the DIF and DEA lines pointing downward, confirming that bearish momentum is still in full control.

The recent price action features a series of predominantly
post-image
CYS-0.35%
  • 3
When BTC shows bearish divergence, does it mean a decline is imminent?
In BTC technical analysis, bearish divergence is often seen as a warning that an uptrend may be weakening. But many traders rush to short as soon as they spot bearish divergence, only for the price to keep rising instead of falling, ultimately getting caught on the wrong side of the market.
So how should bearish divergence be interpreted?
First, understand the basic principle of bearish divergence. When the BTC price keeps making new highs, but the peaks of the RSI or MACD gradually decline, bearish divergence may be formin
post-image
BTC-0.67%
Load More

Join 40 M users in our growing community

⚡️ Join 40 M users in the crypto craze discussion

💬 Engage with your favorite top creators

👍 See what interests you

Trending Topics

USCPIDataIncoming

2.71k Views1.49k Discussing

The U.S. October CPI report will be released on November 10 at 8:30 a.m. ET. September CPI came in at 3.7% year over year, and markets will be watching closely for signs that inflation is cooling, especially in core CPI. A softer-than-expected reading could strengthen rate-cut expectations, while hotter inflation may pressure risk assets through higher Treasury yields and a stronger dollar. How do you think this CPI print will move $BTC, U.S. stocks and gold?

USAIStocksHitHard

24.25k Views3.7k Discussing

USNonfarmPayrolls

42.24k Views4.4k Discussing

View More