Share your thoughts
placeholder
Article
This move is so clear, I don’t even need to think—the account is dancing on its own.

The last thing I saw before bed a few days ago, $SOL was still moving sideways at the bottom, with buying pressure gradually strengthening—a clear sign it was building momentum. I figured the risk at this level was limited, so I placed my position there, set a stop-loss, and went straight to sleep.

Then I woke up this morning to find the price had shot straight to 106.55. From 84.84, the paper gain is +2380.4%.

Feels great, but don’t be greedy for the last bite. I took profit on 80% first, moved the rem
post-image
SOL+4.10%
ZEC+16.28%
ETH+1.97%
MARKET PREDICTION
live-cover
LIVE1,167
#交易机器人 , come copy-trade me. I only used 5x leverage but achieved average daily returns of around 20%.
post-image
JUST IN: A single address labeled "Big Brother Ma Ji" holds about $146M in BTC/ETH longs with ~15.95x leverage, and ~$9.14M NAV. Significant liquidation risks loom on ETH BTC longs if volatility spikes. $BTC $ETH
post-image
BTC+0.42%
ETH+1.97%
#Gate60MillionUsers
60 MILLION USERS.
60 MILLION STORIES.
BUT TODAY, I WANT TO TELL YOU MINE. 💙🔥
When Gate officially reached the incredible milestone of 60 MILLION global users, I didn't see it as just another number on a celebration banner.
I stopped for a moment and thought about what that number actually represents.
60 million people.
60 million different journeys.
60 million different reasons for entering crypto.
60 million different dreams, mistakes, lessons, opportunities and unforgettable moments.
Behind every account is a person.
Someone who discovered Bitcoin for the first time.
S
post-image
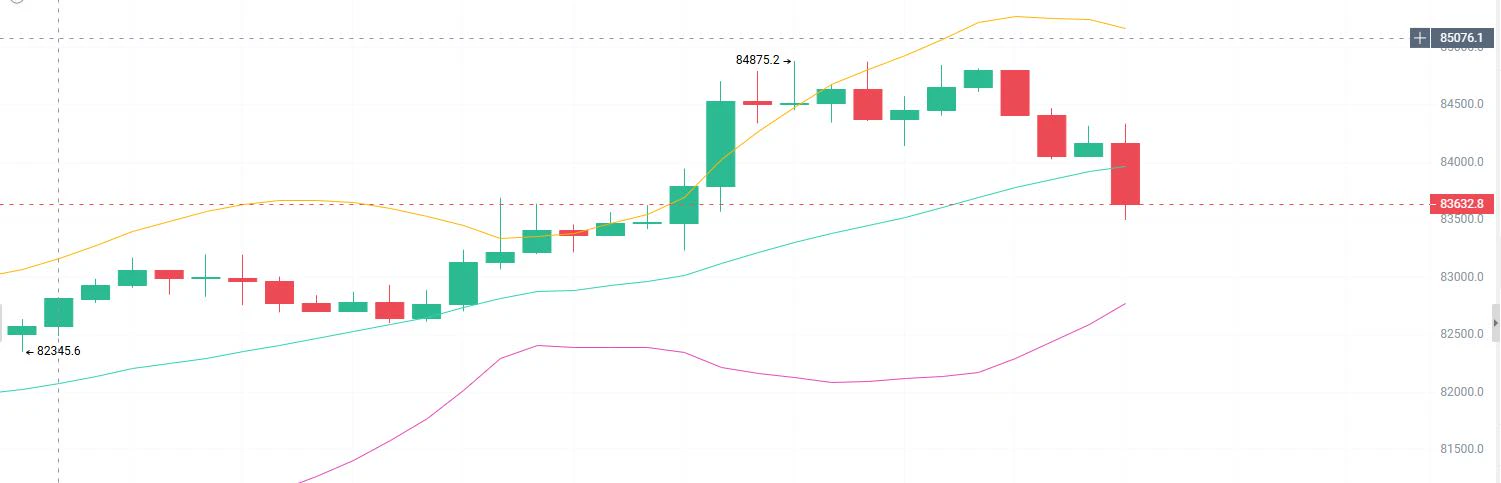
BTC is consolidating in a narrow range near the $80,000 mark, up 0.19% over the past 24 hours and +2.17% over the past 7 days. Spot ETFs saw net inflows of $3.8 billion over three weeks, while Thailand’s former prime minister publicly voiced support for a national Bitcoin strategic reserve, providing support at the bottom; meanwhile, concerns over the unwinding of yen carry trades are suppressing breakout momentum—the range-bound pattern may persist in the short term, with direction depending on subsequent events such as the Federal Reserve decision and the Senate CLARITY vote#美国8月非农超预期
post-image
BTC+0.42%
Pons and Fomo led the pack in the last 24h revenue, each around $1.8M and higher than Hyperliquid’s ~$866k, with Pons 5th and Fomo 6th on the crypto protocol revenue leaderboard. $PONS $FOMO $HYPE RLIQUID
post-image
PONS+1.78%
HYPE+4.88%
Most traders will fade this 95% confidence LONG on $HYPE /USDT — and that’s exactly why it prints.

$HYPE /USDT - LONG

Trade Plan:
Entry: 87.582 – 87.942
SL: 86.036
TP1: 89.056
TP2: 89.919
TP3: 91.213

Why this setup?
- 4h timeframe shows a bullish 1D trend, but the real edge is the 15m RSI at 67.96 — not overbought yet, just warming up.
- Entry zone 87.58–87.94 is tight, with ATR (1h) at 0.719 — momentum is coiled, not exhausted.
- Why now? TP1 at 89.056 is only 1.5% away, but the structure suggests this is the launchpad, not the ceiling.
- Invalid only below 82.588 — that’s a 6% bu
HYPE+4.77%
#Gate事件合约晒单挑战
The is a great opportunity for traders to turn their market views into clear, engaging, and shareable trading ideas. Event contracts bring a unique perspective to trading because they focus on specific outcomes and require participants to think carefully about probability, timing, market sentiment, and the information that could influence an event.
What makes this challenge exciting is that every trade has a story behind it. Instead of simply sharing an entry, participants can explain why they chose a particular contract, what information shaped their view, and which factors co
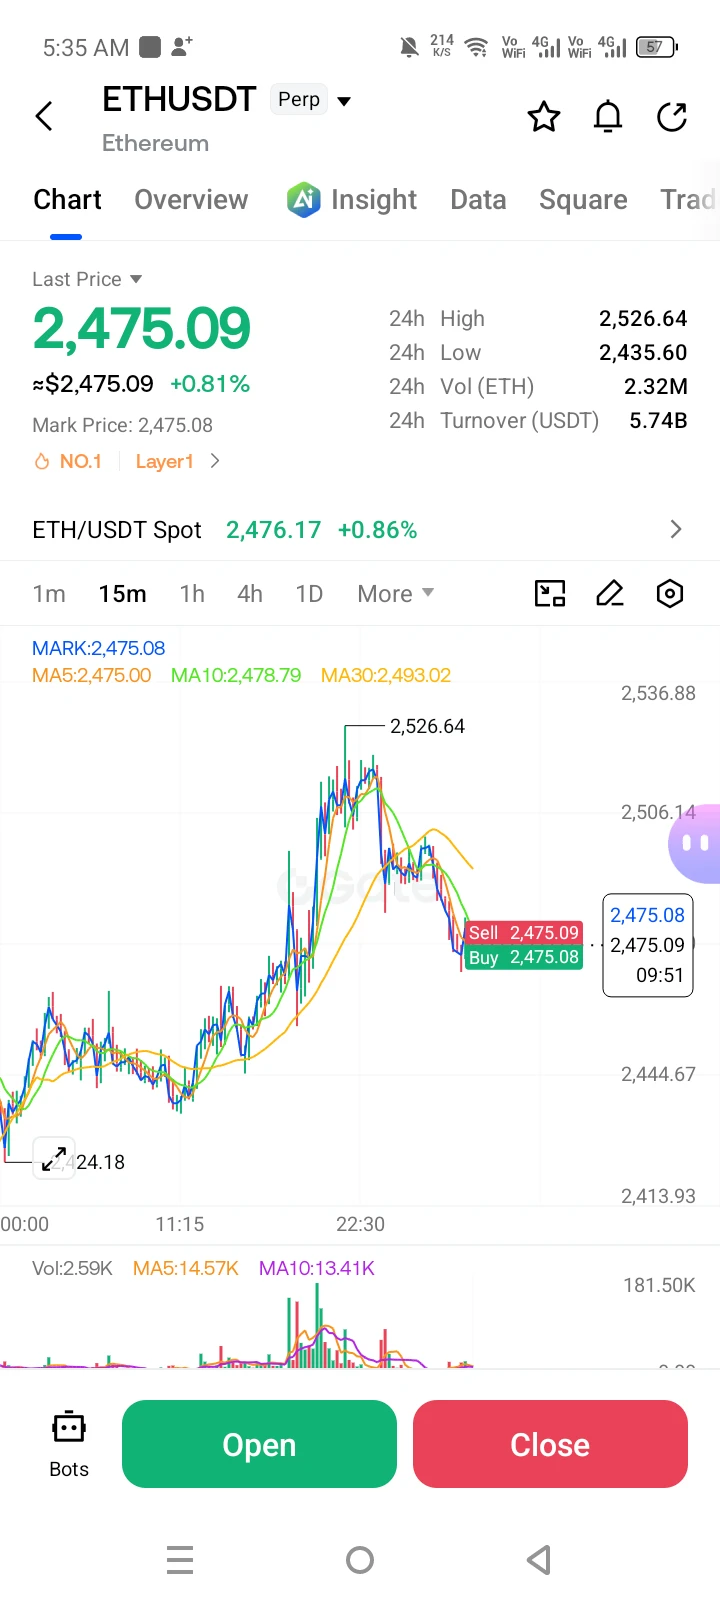
ethereum:native looks bullish consolidation
post-image
ETH+1.97%
Everyone’s chasing gold—until the 4h chart whispers a different secret about $XAUT /USDT.

$XAUT /USDT - SHORT

Trade Plan:
Entry: 4423 – 4425
SL: 4433
TP1: 4417
TP2: 4413
TP3: 4406

Why this setup?
- RSI (15m) at 41.88: momentum is fading, not flipping.
- ATR (1h) at 3.71: tight coils spring fast—this one’s primed.
- 1D trend is *range*, so the real play is timing the fade, not the breakout.
- Entry zone 4424 with TP3 at 4406 gives you a 0.4% scalp while invalidation sits far at 4451.
- Why now? The “safe haven” narrative is stale—shorts are armed before the weekly close.

Debate:
XAUT-0.07%
Name one stock that will 100% do this.
post-image
$ZAMA
UPDATE
#ZAMA is getting ready for a good bullish wave. Expecting 50%+ gain here ✍🏻
#ZAMAUSDT #ZAMABTC #BTC #Bitcoin #NFTs
post-image
ZAMA+19.49%
BTC+0.42%
This COTI surge has completely caught me off guard—up 25% in 24 hours, ripping from 0.0147 to 0.0190, with $45 million in trading volume. That’s not volume retail traders can generate.
Here’s a reference for bottom-fishing: the Fear and Greed Index is currently at 67, leaning greedy but not yet extreme. Funding rates flipped positive from -0.03% last night to +0.01%, and shorts are being liquidated. The last time COTI saw this kind of simultaneous rise in price and volume was in November last year. Back then, after funding rates turned positive, the price went on to gain another 35% through mo
COTI+19.14%
This wave was purely driven by good market sentiment—I casually tossed out some coins, and one just happened to land on my head. When I opened the chart this morning, I saw $HYPE still grinding around 83.212. Support had held, and volume had not deteriorated. I judged this to be the entry point and called for a long position.

And the result? The current price has already reached 87.632, and my account directly spit out a juicy +375.11% gain. The brothers on board should have woken up laughing. It was truly sluggish at first, but the breakout feels just as good.

The market is won by waitin
post-image
HYPE+4.77%
SOL+4.10%
DOGE+4.47%
Many Agent marketplaces directly separate buyers and sellers at the product entry point.
@termix_ai's AACP has a small but, in my view, crucial design: it first gives an Agent an on-chain identity, while whether it is the employer or the contractor is decided at the task level. The same Agent can post a task, lock a budget, and wait for others to submit quotes this time; next time, it can bid, deliver, and get paid.
The identity stays the same, while the role changes.
This may not matter much for human platforms, but it matters a lot for Agents. After a coding Agent receives a task, it may wel
post-image
Everyone’s chasing $SNDK /USDT longs at 1790—but the 4h clock just ticked past the exit.

$SNDK /USDT - SHORT

Trade Plan:
Entry: 1787.9 – 1791.9
SL: 1809.5
TP1: 1775.2
TP2: 1765.4
TP3: 1750.7

Why this setup?
Why now?
- 1D is range, not breakout—so upside is capped, not expanding.
- 15m RSI at 67.97: overheated micro-momentum, ripe for a snap-back.
- ATR 1h at 8.16 means moves are tight but violent—1775 (TP1) is a 0.8R gift.
- Entry zone 1787.9–1791.9 is a liquidity shelf; shorts here bank on failed retests.
- Confidence 55% isn’t screaming—but in a range, that’s enough to fade t
SNDK+2.00%
The year-end Bitcoin target price given by major global financial institutions and top AI models has reached $95,000–$150,000 per coin, while Ethereum’s target is $3,175–$4,500 per coin; patiently hold spot #BTC收复8万美元
TradingKingGaoYuliang
Core Logical Reasoning
Driver 1: Macroeconomic Monetary Environment (the Biggest Short-Term Variable)
• Current Headwind: The probability of a rate hike in September has risen to 62%, while the rate cut previously expected by the market has yet to materialize. The Fed’s dot plot shows rates at around 3.25%–3.40% by the end of 2026, but CME FedWatch pricing puts the probability of a rate cut this year below 10%.
• Key Timing: The September FOMC meeting (mid-to-late September) is the short-term watershed moment. If a rate hike is implemented, BTC could fall to $72,000–$75,000 in the short term; if the Fed unexpectedly pauses, the Q4 rally could begin immediately.
• Powell’s Term: His term expires in May 2026. Changes in the Fed’s leadership will bring policy uncertainty, but the market has gradually priced this in.
Driver 2: ETF Fund Flows (Structural Support)
• Pressure in the First Half: Spot BTC ETFs saw monthly net outflows of $4.06 billion in June, the largest redemption record since their launch, directly causing BTC to fall from $110,000+ to the July low of $59,000.
• A Turning Point in August: Over the past 60 days, Bitcoin whales have accumulated approximately $2.75 billion, while ETFs turned back to net inflows in late August (exceeding $1 billion in a single week). Exchange balances continue to decline, with investors shifting to cold storage, indicating that selling pressure is drying up.
• Solid Cumulative Base: Cumulative net inflows into spot BTC ETFs remain at approximately $55 billion, with total assets under management of around $109 billion. This is the biggest difference between this cycle and previous ones—institutional capital is already in the market rather than waiting on the sidelines.
Driver 3: Cycle Position (Deeply Corrected)
• BTC’s maximum decline in the first half of 2026 was approximately 30% (from $111,000 at the beginning of the year to $59,000 in July), and its current price of $80,000 is in the middle of a rebound.
• Historically, in post-halving cycles (the April 2024 halving), the second Q4 often sees a second wave of gains due to reduced miner selling pressure and an institutional allocation window.
• However, it should be noted that this cycle is more institutionalized, so volatility may be smoothed out, making a repeat of the multi-fold gains seen in 2021 unlikely.
Driver 4: Ethereum’s Independent Logic
• ETH/BTC Exchange Rate: Currently around 0.031, it is in a historically low range. If risk appetite recovers in Q4, ETH typically has greater upside elasticity.
• Stablecoins and Tokenization: Standard Chartered raised its year-end ETH target from $4,000 in June to $7,500, primarily because the growth in network utility driven by stablecoin issuance and asset tokenization has not yet been reflected in the price.
• Yield Characteristics: ETH staking provides an annualized yield of approximately 3%–4%, making ETH more attractive than BTC as an “interest-bearing asset” in a falling-rate environment.
• Risk: Spot ETH ETF inflows remain consistently weaker than those of BTC. If this trend continues, ETH may continue to underperform.
IV. Key Indicators to Watch (Tracked Over the Next 3 Months)
1. September FOMC Decision: Rate hike vs. pause will determine the direction of Q4’s opening
2. Weekly Net Inflows into Spot BTC ETFs: Three consecutive weeks of positive inflows = confirmation of a bottom
3. Whether BTC Can Hold Above $85,000: This is the 200-day moving average level; holding above it would open up room toward $100,000
4. ETH/BTC Exchange Rate: A break above 0.035 = a signal that ETH is beginning to outperform
5. U.S. Inflation Data: If CPI continues to decline, rate-cut expectations will heat up again#美国8月非农超预期
BTC+0.42%
ETH+1.97%
Everyone’s chasing the next 100x—but ESPORTS just flashed a signal that quietly kills leveraged longs.

$ESPORTS /USDT - SHORT

Trade Plan:
Entry: 0.01460 – 0.01466
SL: 0.01496
TP1: 0.01438
TP2: 0.01421
TP3: 0.01396

Why this setup?
- 4h bias is SHORT with 95% confidence—that’s not a whisper, that’s a scream.
- Daily trend: bearish. The 1D structure is already bowing down; we’re just riding the follow-through.
- Entry zone locked at 0.01463, with TP1 at 0.01438 and TP2 at 0.01421—that’s a clean 3% drop before you even blink.
- RSI on 15m sits at 45, still room to fall before hitting o
ESPORTS-1.48%
Load More

Join 40 M users in our growing community

⚡️ Join 40 M users in the crypto craze discussion

💬 Engage with your favorite top creators

👍 See what interests you

View More