Square
Following
Hot
News
Profile
Share your thoughts
placeholder
Article
Tether can't leave Bitrue over NEAR anymore; the exchange just shut USDT withdrawals on that network. Most pauses like this are routine maintenance, but $USDT bound for a NEAR wallet is stuck there for now.
USDT+0.00%
$ETH
Hong Kong plans to put 400 ounces of gold on the blockchain
One token represents an entire gold bar
Traditional gold is going on-chain too
Damn
Guys
Crypto circles talk about BTC and ETH every day
I didn’t expect Hong Kong to turn its attention to real gold and silver this time
The Hong Kong SAR government recently revealed
It plans to launch an interbank tokenized gold trading project
It is preparing to launch a gold token representing one standard 400-ounce gold bar
How much is 400 ounces?
That works out to about 12.44 kilograms
That’s so little
It’s a bit different from what I imagine
post-image
ETH-1.23%
Trenches
ZIG
Z
bade
b
ZIG
0x8c...1145
Market Cap
$.
Change
.
24h Vol
$.
Holders
.
BTC
B
bade
b
BTC
C5xp...pump
Market Cap
$.
Change
.
24h Vol
$.
Holders
.
HIGH
H
bade
b
HIGH
7ymF...high
Market Cap
$.
Change
.
24h Vol
$.
Holders
.
STONK
S
bade
b
STONK
6GmA...UNgx
Market Cap
$.
Change
.
24h Vol
$.
Holders
.
LEEROY
L
bade
b
LEEROY
98HE...pump
Market Cap
$.
Change
.
24h Vol
$.
Holders
.
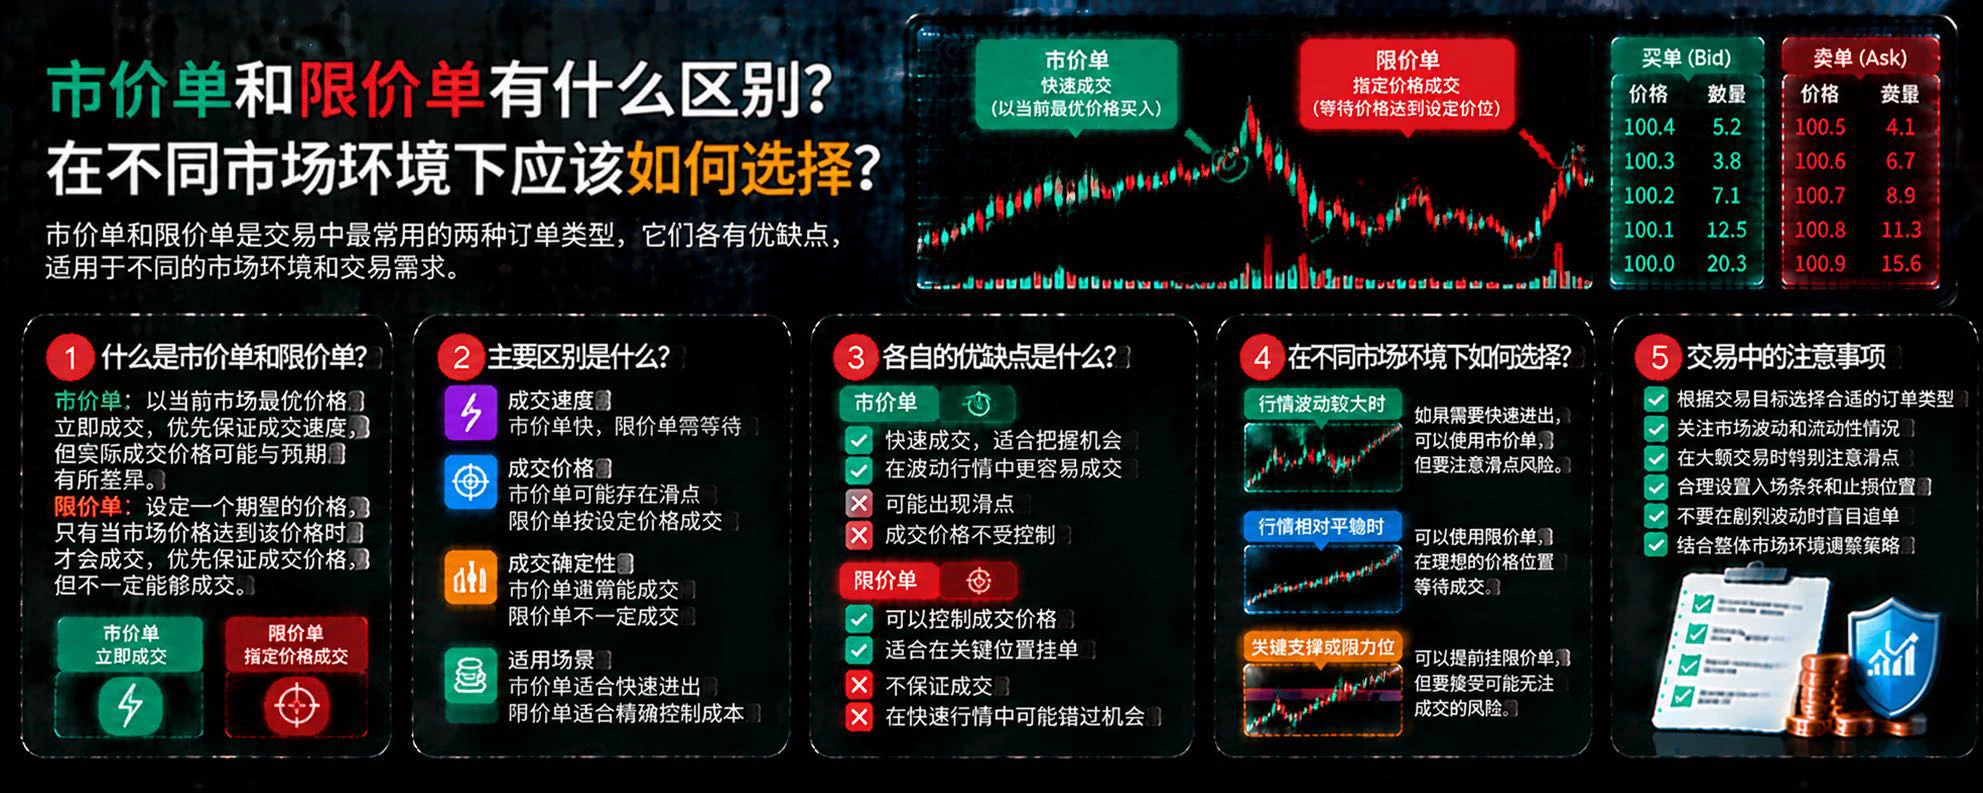
What is the difference between market orders and limit orders? How should you choose in different market conditions?
In cryptocurrency trading, the order type you choose affects not only how quickly your trade executes, but also the actual execution price. Market orders and limit orders are the two most common order types. Understanding the difference can help reduce unnecessary trading costs.
First, what is a market order?
A market order is an order that executes as quickly as possible at the prices currently available in the market. Its advantage is that it usually fills quickly, but the fin
post-image
(new streamer)market update
live-cover
LIVE1,564
#民主党赢得美国两院 #美股财报季
The possibility of Democrats winning control of both chambers of the US Congress is an important political development that could influence the direction of American financial markets, economic policies, and investor expectations. Congressional control matters because decisions made in Washington can affect government spending, corporate taxation, business regulations, infrastructure investment, and the overall economic environment. Investors are therefore paying close attention to how a potential political shift could influence the next stage of the US economy.
If Democrats
$ETH The bulls’ next target is $2,550! After breaking decisively above $2,400, Ethereum is showing strong bullish momentum. The price is currently consolidating around $2,427, and if it rises again, ETH could move toward the $2,550 target. The key is to hold above the breakout zone. Can ETH reach $2,550 in the next move?
post-image
ETH-1.26%
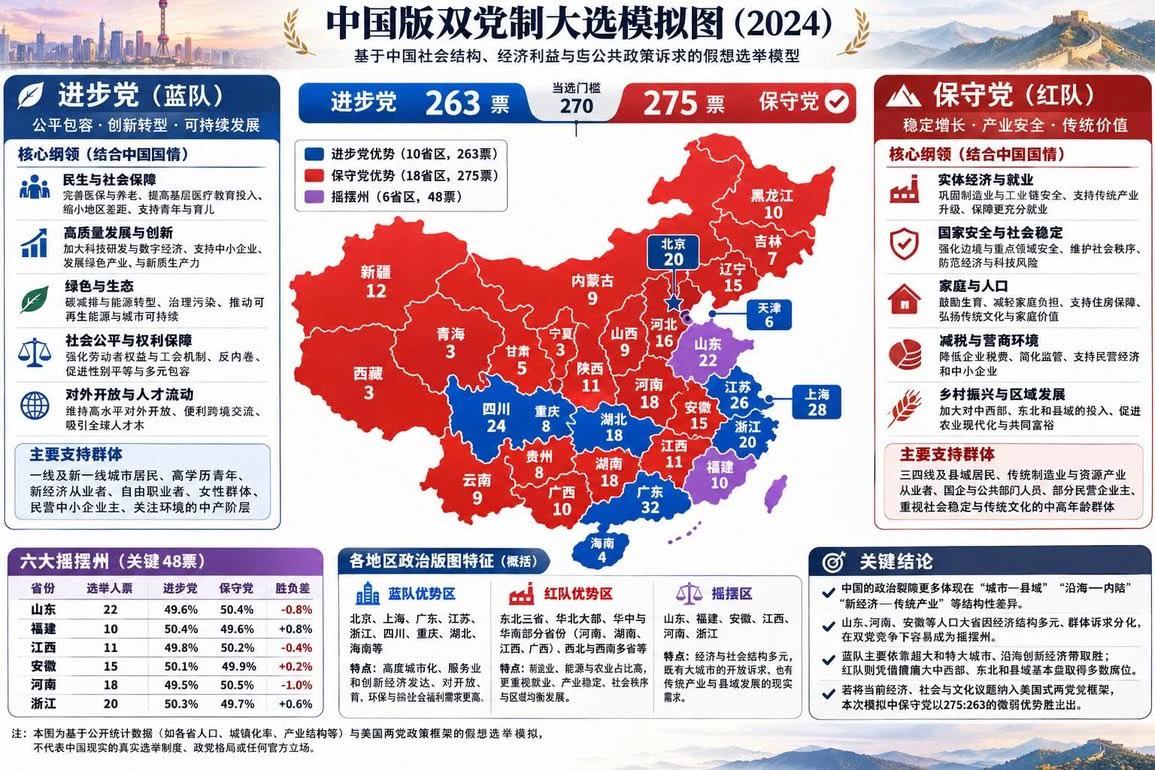
GPT actually thinks Fujian and Shandong would be swing states. I don’t get it!
post-image
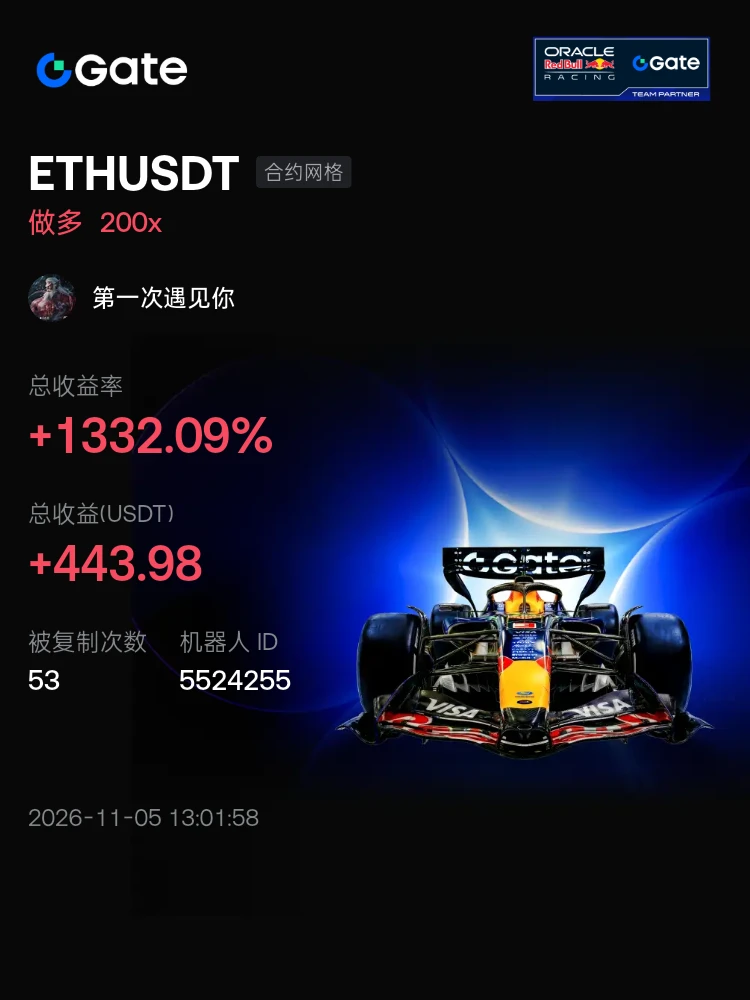
#交易机器人 I'm using the ETHUSDT contract grid bot on Gate—join me and copy my trades
post-image
$KOR A needle is coming any moment now
post-image
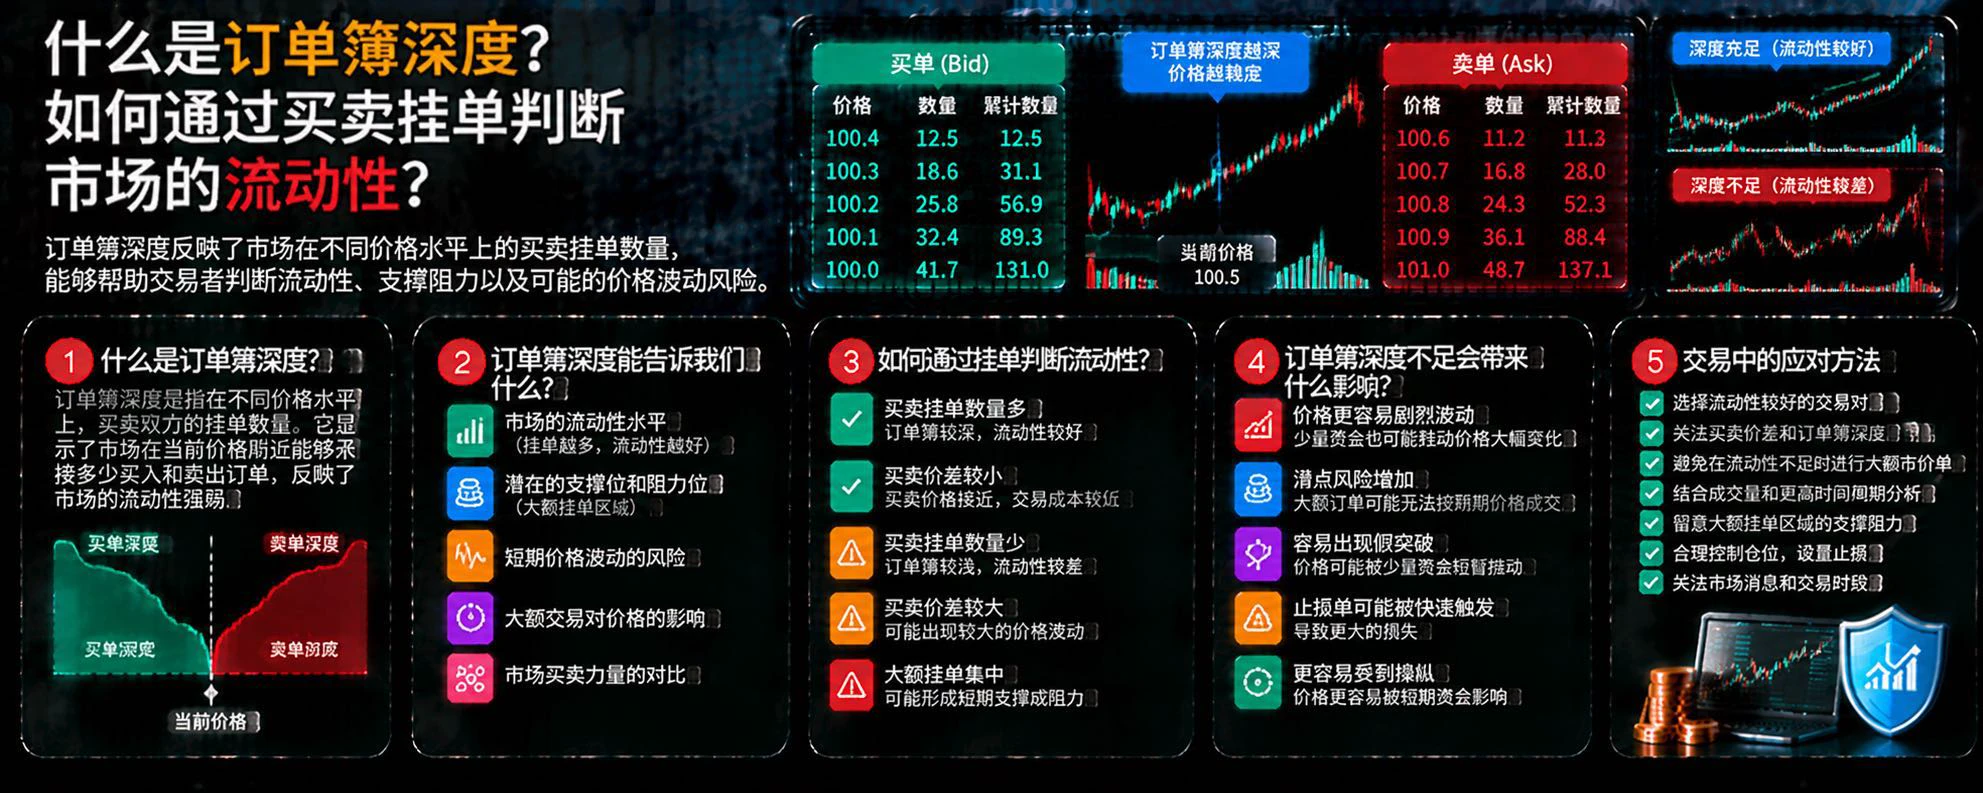
What Is Order Book Depth? How Can Buy and Sell Orders Help Assess Market Liquidity?
In cryptocurrency trading, you can’t tell whether an asset is easy to trade by looking only at its price and trading volume; you also need to examine the order book. The order book shows buy and sell orders at different prices, helping traders understand market liquidity and the potential price impact of large orders.
First, what is order book depth?
Order book depth reflects the quantity and size of buy and sell orders at different price levels. Typically, buy orders cluster below the current price, while sell
post-image
Oil prices have fallen, so will stocks definitely rise? Don’t celebrate too soon—there’s an economic trap lurking beneath the surface!
When they see Brent crude fall below $100, some people’s first reaction is: Lower energy costs mean higher corporate profits, so is the stock market about to take off?
That logic makes sense, but it’s only half the story.
If oil prices fall because supply has increased while global demand remains healthy, companies can benefit from lower costs, and consumers will have more money to spend elsewhere, which could naturally support risk assets.
But if oil prices fa
SATS-1.29%
  • 1
Zec market update
live-cover
LIVE2,351
#10月非农数据聚焦
The October US Nonfarm Payrolls report is becoming an important focus for financial markets as investors look for fresh signals about the strength of the American economy. Employment data plays a major role in shaping economic expectations because the labor market influences consumer spending, business confidence, inflation, and the Federal Reserve's monetary policy decisions.
The October jobs report will provide important information about how many jobs were added during the month, whether unemployment is increasing or decreasing, and how wages are developing. These figures can hel
BTC-0.67%
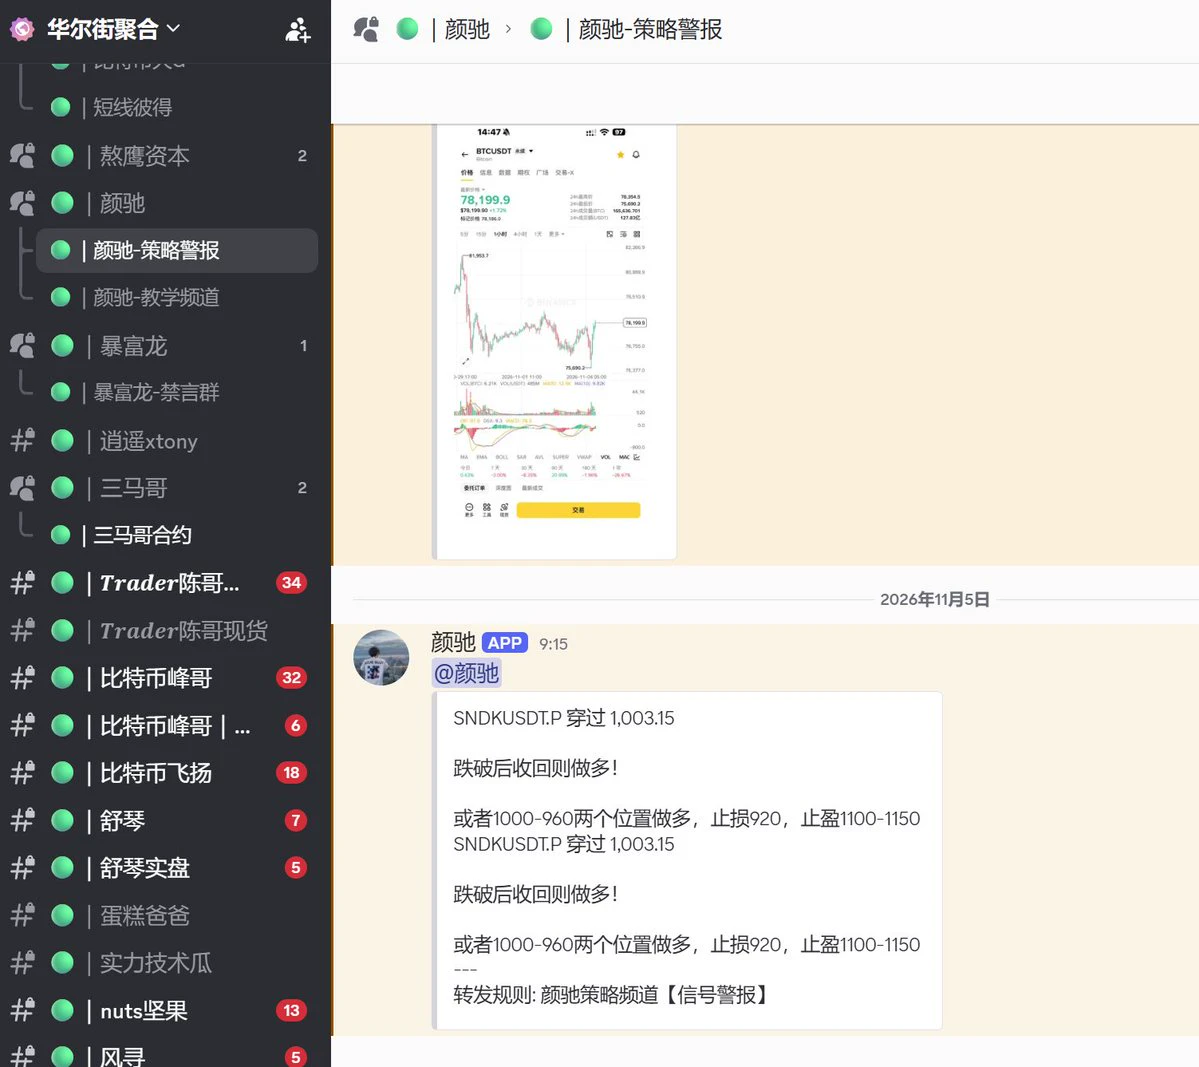
Yan Chi: Go long if SanDisk breaks below 1003.15 and then reclaims it, or go long at 1000–960. Stop-loss: 920; take-profit: 1100–1150.
#US stocks
post-image
SNDK-7.93%
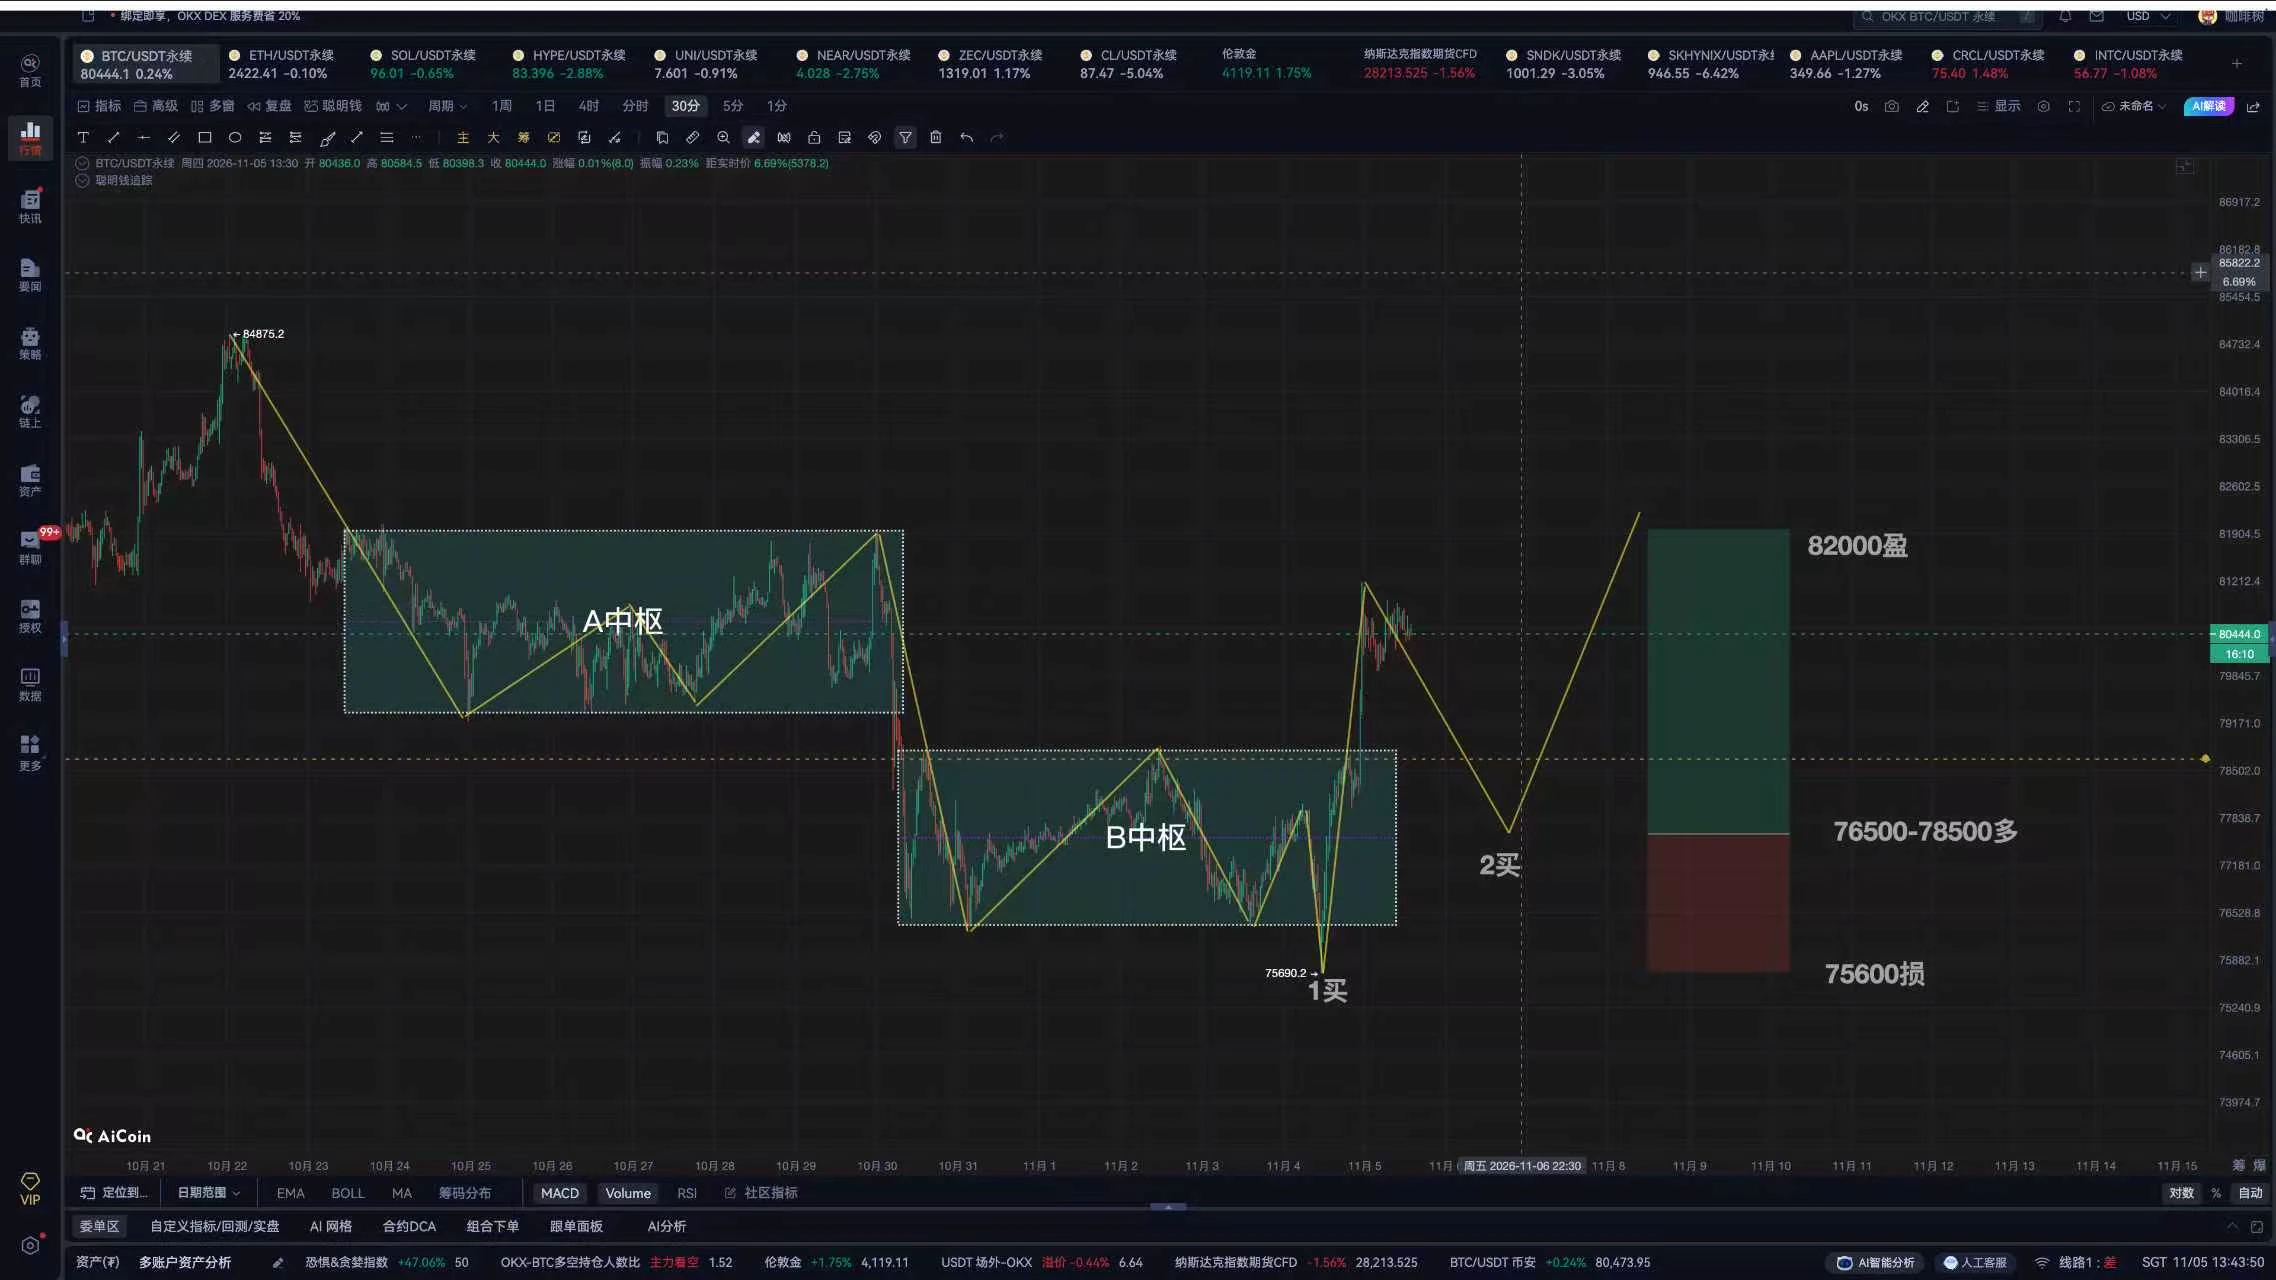
$BTC Many people can't tell a Type 1 buy point from a Type 2 buy point
After a rebound from a Type 1 buy point, the market pulls back again. This time, the pullback doesn't break below the Type 1 buy point's low, and the level where the pullback bottoms is the Type 2 buy point.
The advantage of a Type 2 buy point is that it's more reliable than a Type 1 buy point.
If you missed the Type 1 buy point, you can re-enter at the Type 2 buy point; if you already hold a core position, the Type 2 buy point is also a good opportunity to add to it.
There are three possible levels for a Type 2 buy point
post-image
BTC-0.65%
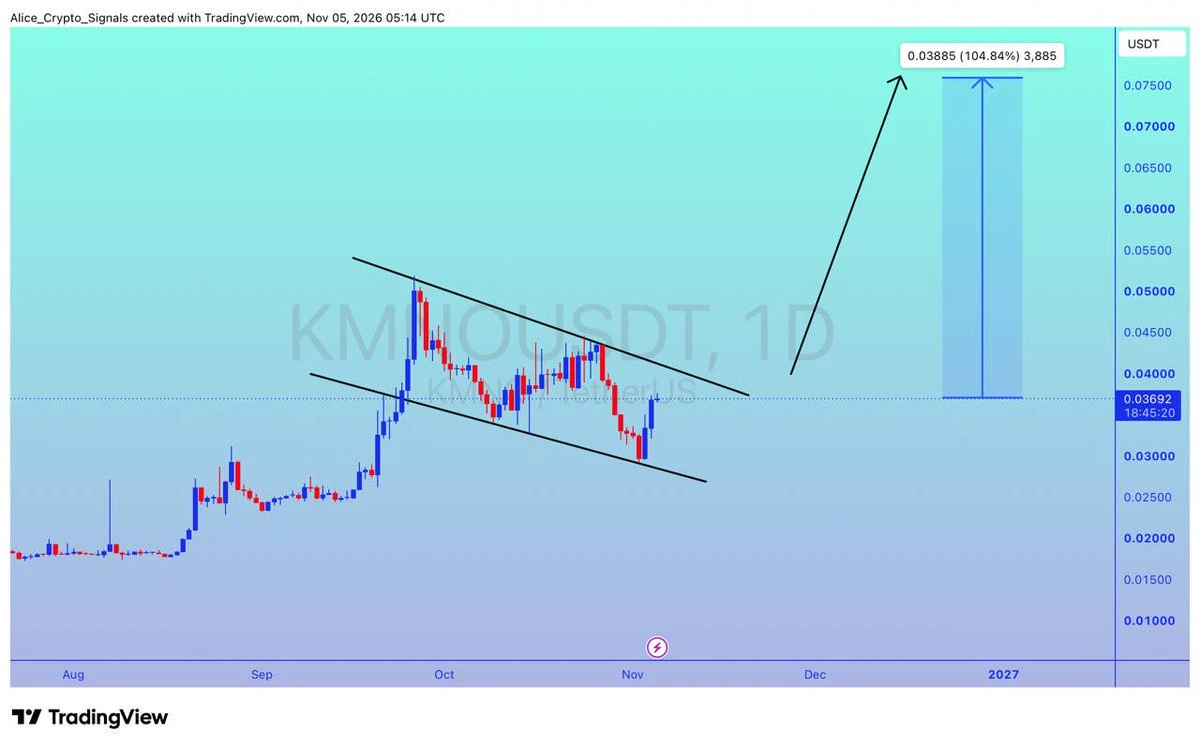
$KMNO
UPDATE
#KMNO is looking for breakout. After this breakout we can see 100%+ gain here ✍🏻
#KMNOUSDT #KMNOBTC #BTC #Bitcoin #Nfts
post-image
KMNO+3.65%
BTC-0.67%
ZEC 1-hour timeframe: After rising along the upper Bollinger Band, the price pulled back slightly and is now holding above the middle band. The Bollinger Bands are gradually narrowing, signaling a short-term consolidation structure. The TTMU long/short indicator favors bulls, and net capital inflows continue, keeping bullish momentum intact. The previous rally tested the area around 1352 and met resistance, making this a key short-term barrier. The middle Bollinger Band below provides strong support; holding above it on a pullback would keep the bullish structure intact. A high-volume break ab
post-image
BTC-0.67%
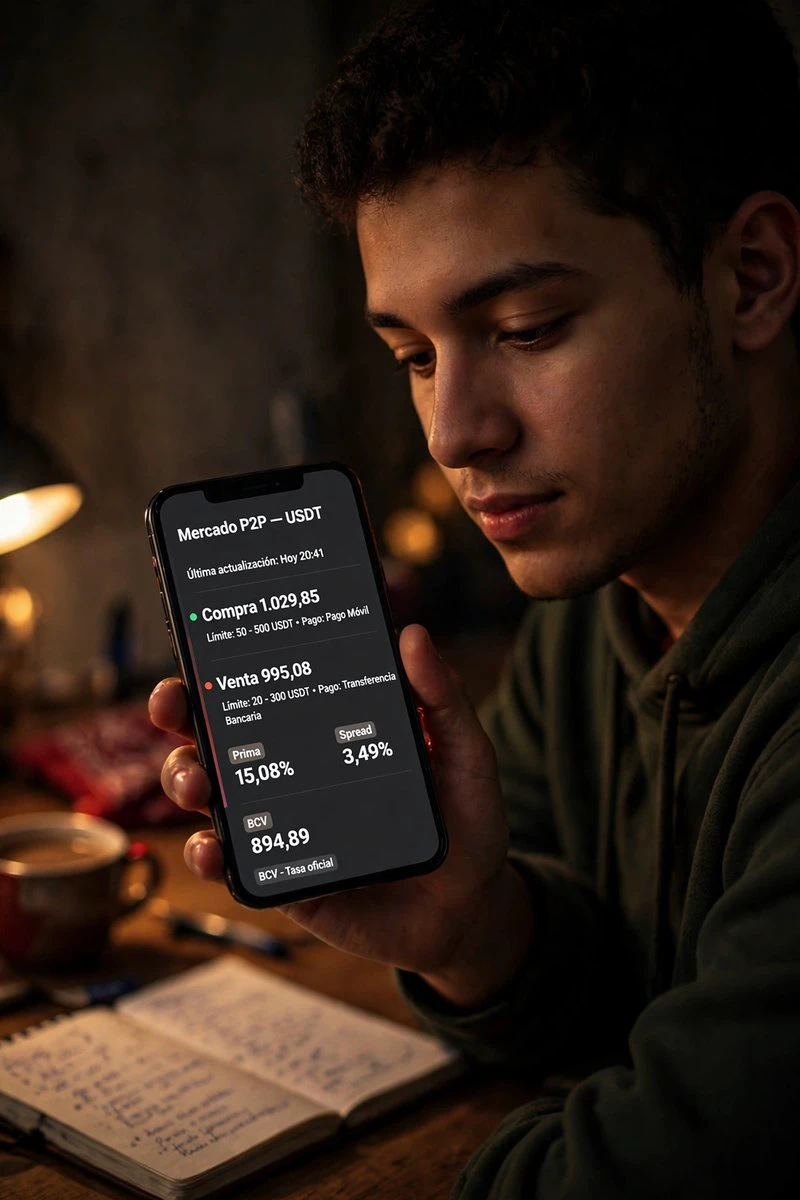
📊 Looking only at the first P2P ad is the fastest way to get the calculation wrong.
We published a step-by-step guide to reading volume and spread correctly: using today’s market data, not the price listed first.
Today’s snapshot, according to the P2P Radar:
• USDT buy price: Bs. 1.029,85
• USDT sell price: Bs. 995,08
• BCV official rate: Bs. 894,89
• Premium over BCV: 15,08%
• Overall P2P spread: 3,49% (Bs. 34,77)
• Offers observed: 176
But the overall average hides what matters. At the top of the order book—the best prices available right now—the story is different:
• Best price to buy USDT
post-image
#USNonfarmPayrolls $BTC $XAUUSD $SPX
#10月非农数据聚焦 #DailyStandouts
Tomorrow’s jobs report might be the most “good news is complicated” data point of the month. A few days ago I would have said strong jobs equals bullish. In this market, I’m not sure that’s true anymore.
1. Why a strong number isn’t automatically good
The Fed held rates at 3.75% to 4.00% on Oct 28, but the conversation isn’t about cuts. It’s about whether another hike comes in December, and futures are pricing that at roughly 80%. The 10-year yield is sitting near 4.9%. So the data isn’t judged by “is the economy fine?” It’s ju
BTC-0.65%
XAUUSD+1.59%
SPX+0.33%
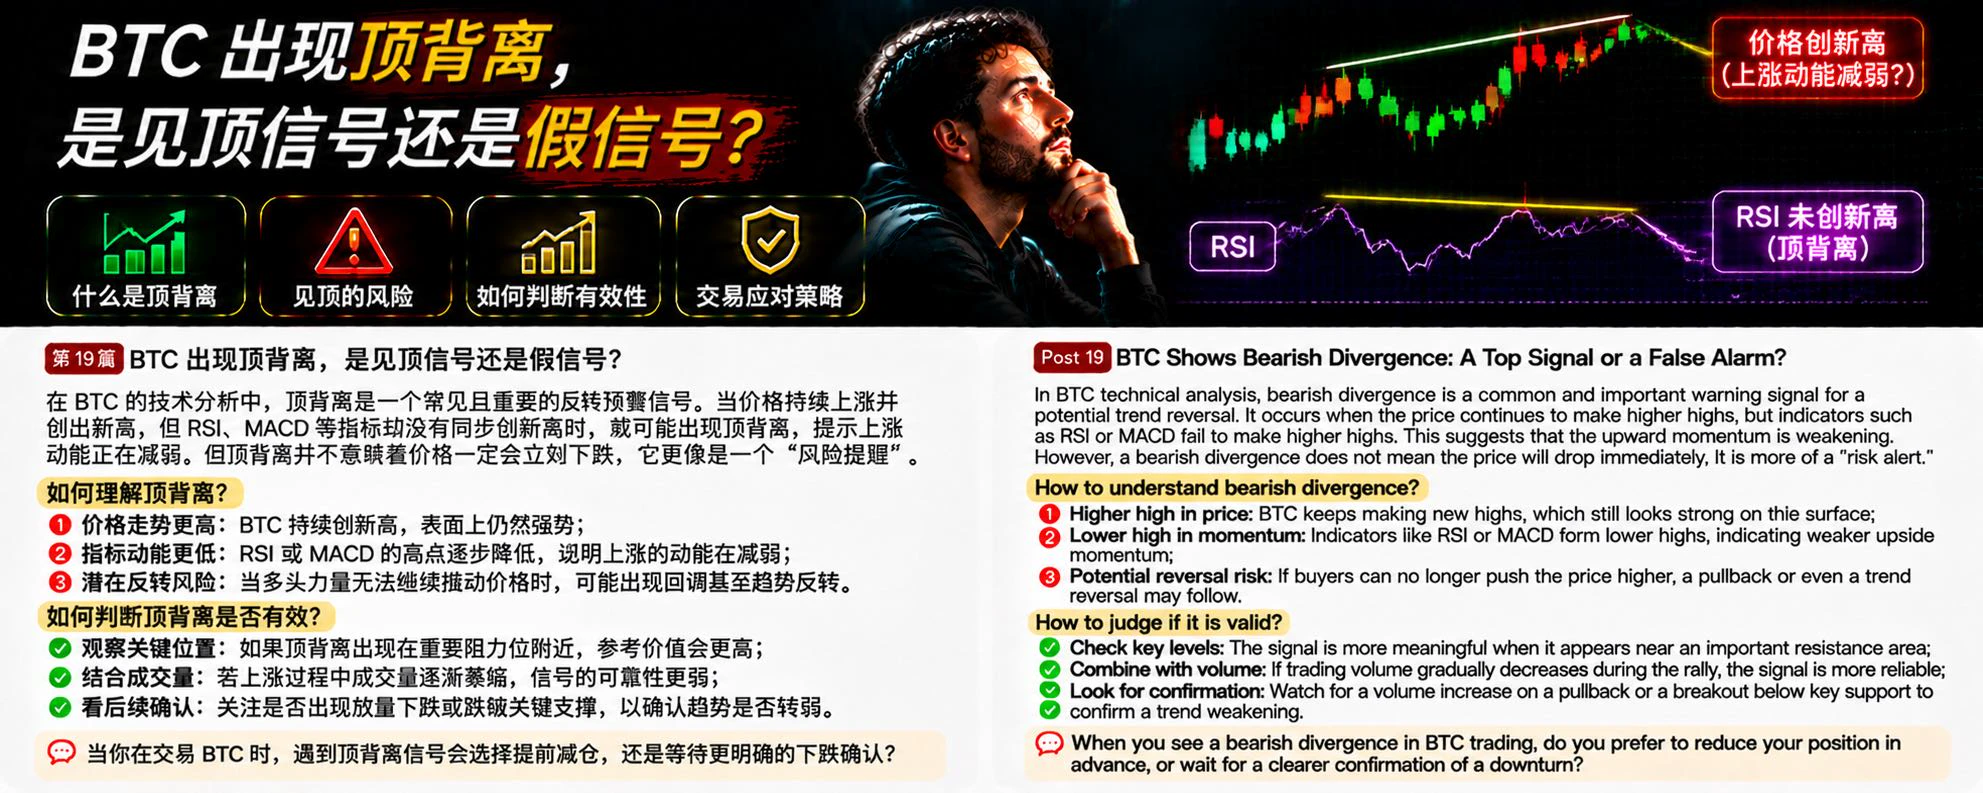
In BTC technical analysis, bearish divergence is a risk warning signal worth watching. Many traders see the price continually making new highs and assume the uptrend remains strong. But if the price keeps rising while indicators such as RSI or MACD fail to make new highs in tandem, bearish divergence may be forming.
What is bearish divergence?
Simply put, the price makes a higher high, while the technical indicator forms a lower high. This suggests that although the price is still rising, the momentum driving it higher may be weakening.
Why is bearish divergence worth watching?
First, upward m
post-image
BTC-0.67%
Load More

Join 40 M users in our growing community

⚡️ Join 40 M users in the crypto craze discussion

💬 Engage with your favorite top creators

👍 See what interests you

Trending Topics

BTCBackAbove80K

33.91k Views41.21k Discussing

After a sharp dip, Bitcoin climbed back above $80,000 on May 9 and is currently trading around $80,200. Over 50,000 traders were liquidated in the past 24 hours amid fierce long-short battles. The recurring Iran-U.S. tensions remain the primary short-term variable. Following U.S. airstrikes, Iran\'s Revolutionary Guard claimed to have breached the Strait of Hormuz defense line, leaving the ceasefire outlook uncertain. On the technical side, the daily SMA20 ,$77,970 serves as key support, with the RSI recovering from oversold levels to 43. The $80,000 level is both a psychological barrier and a bull-bear dividing line.Holding above it could lead to a challenge at $85,000, while a break may trigger a retest of the $77,000 area.

DemocratsWinBothChambers

18.46k Views446 Discussing

GateLaunchesTaiwanStockTrading

15.45k Views313 Discussing
View More