Share your thoughts
placeholder
Article
$BEAT Signal】4H spike and pullback + order book under pressure, short setup
$BEAT The 4H upper wick hit 0.0982, and the pullback closed at 0.0941, below EMA20 at 0.0951. The buy ratio was 0.47, with short-term selling pressure continuing to materialize. RSI was 44, while the 4H MACD histogram was +0.0014, with bearish momentum not expanding. The order book bid/ask ratio was 1.11, and the depth imbalance was 5.41%, indicating solid bids below. The funding rate was 0.0050%, OI Stable, and conditions were insufficient for a short squeeze. The risk-reward ratio at this level is 1.50, with a nearb
post-image
BEAT+39.92%
Market 📊 Flash | $BTC , ‌$ETH Some ETFs Recorded Net Inflows, $SOL Slight Outflows
On the U.S. trading day of September 11, the latest disclosed ETF fund flows:
🟠 BTC: Currently counted net inflow of $6 million
IBIT data is still unavailable; the full-day net amount remains to be confirmed. Data
🔵 ETH: Currently counted net inflow of $49.3 million
Of this, ETHW saw an inflow of $29.1 million and FETH an inflow of $11.4 million; ETHA and ETHB have not yet been updated. Data
🟣 SOL: Net outflow of $300,000
All products listed have been updated; the outflow came from BSOL. Data
Don't rush to
BTC+0.52%
ETH+2.67%
SOL+2.39%
  • 3
  • 1
CPI JUST MADE THE FED’S NEXT MOVE A LOT MORE INTERESTING.
The market was hoping for a clear path toward rate cuts.
But the latest inflation data didn’t give traders that comfort.
#ShareWeekly #weeklyshare
August CPI increased 0.4% from the previous month, while yearly inflation reached 3.4%. Core CPI also rose 0.3% month-over-month, coming in hotter than the 0.2% expected.
That might sound like a small difference.
For markets, it isn’t.
The Fed wants inflation moving closer to its 2% target before it can comfortably lower rates. A stronger CPI number gives policymakers another reason to stay
post-image
LAB+82.18%
LSK+51.42%
Bitcoin ETF Flows Stay Strong, Could Nearly $1B Weekly Demand Support BTC?
live-cover
LIVE1,171
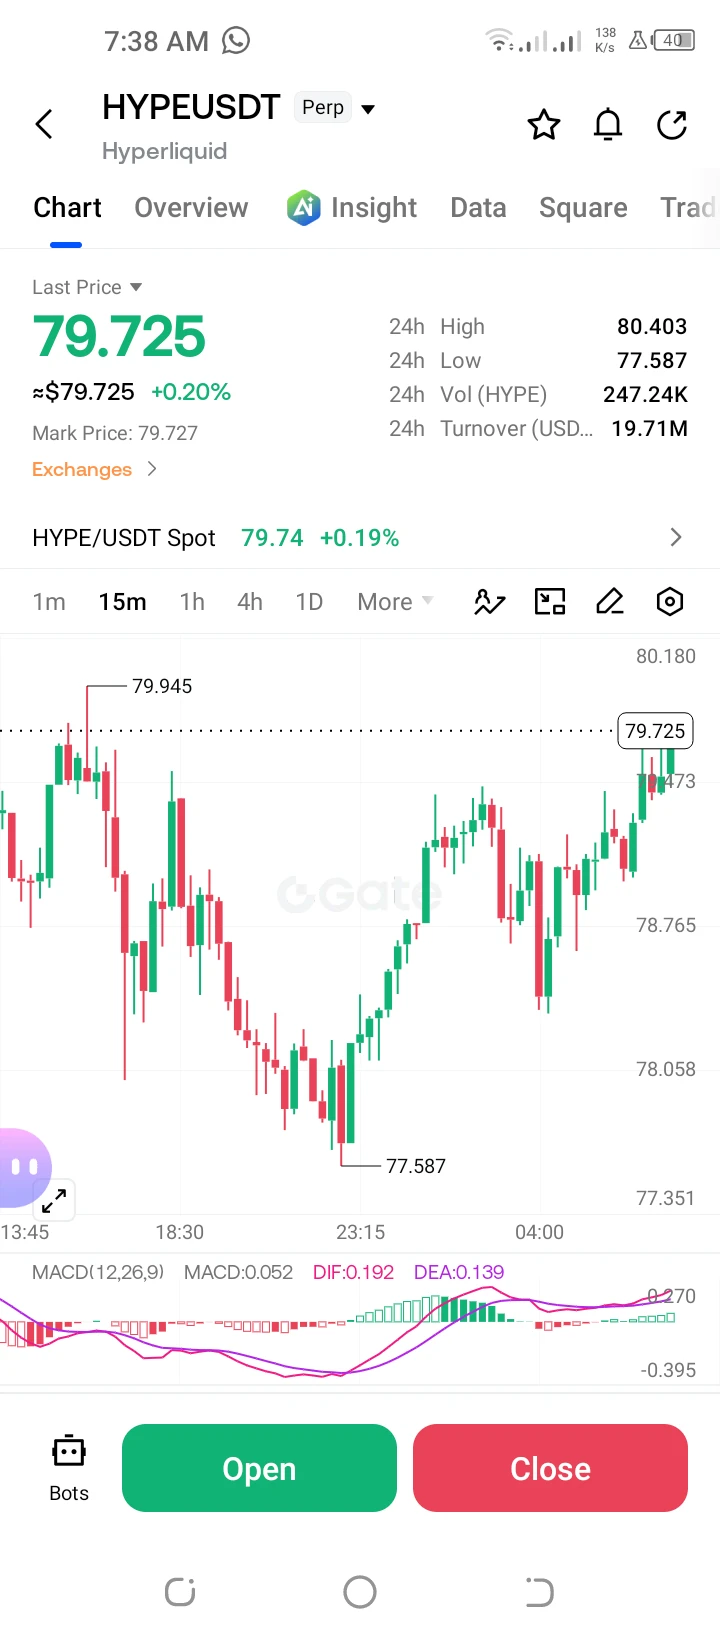
Loracle’s HYPE short is slipping again — another $3.92M realized loss as it trims some shorts and spot hoards, extending 30-day losses to ~$16.41M. $HYPE
post-image
HYPE+0.19%
New update 🥰🌹
live-cover
LIVE1,066
Why ONDO short sellers are quietly preparing for a move that most traders are ignoring right now.

$ONDO /USDT - SHORT

Trade Plan:
Entry: 0.3492 – 0.3518
SL: 0.3629
TP1: 0.3412
TP2: 0.3350
TP3: 0.3256

Why this setup?
Why now? The 1h price sits at 0.3506, barely above a tight entry zone between 0.3492 and 0.3518, while the 15m RSI reads 49.03, hinting at balanced but fragile momentum. The 1h ATR of 0.005181 shows the market is compressed enough for a sharp directional break, and the 1D trend being range-bound suggests exhaustion. The setup targets TP1 at 0.3412 and TP2 at 0.3350 on a short
ONDO+1.44%
This return has me feeling both thrilled and terrified, worried the market will wake up tomorrow and blacklist me. While everyone else was running, $BNB quietly emerged from a structural bottom: buying pressure kept intensifying, and pullbacks barely gave anyone a chance to hesitate.
The range I gave at the time was around 641.25, and after placing the order, I stopped letting it affect my mindset. I opened the chart today to find the current price at 729.05, with the floating profit on this position reaching +972.21%. Luck is determined by the market, but the plan was set in advance.
Reviewi
post-image
BNB+3.27%
ADA+0.92%
ETH+2.67%
#AugustCoreCPIBeatsExpectations
#ShareWeekly
BTC/USDT Technical Analysis
Current Zone: ~$77,300
Entry: $76,500–$77,200
Support: $76,000–$76,500
Resistance: $80,000–$82,000
Stop Loss: $74,900
Take Profit: $79,500 / $80,500 / $82,000
Market Outlook:
BTC is holding near the key $76K–$77K demand zone. A sustained move above $80K could open the way toward $82K, while a breakdown below $76K may increase downside pressure toward $72K–$73K.
Bias: Neutral to cautiously bullish above $76K.
Trade with proper risk management. This is technical analysis, not financial advice.
BTC+0.50%
  • 3
  • 2
Your rich era is coming
post-image
$XRP XRP is doing what it does best in uncertain times — hovering just above a critical technical line, waiting for the macro weather to clear.
The token is trading around $XRPon September 11, up slightly on the session but down more than 6% over the past seven days . It is a market of compressed anticipation, where the price action feels less like a trend and more like a pause before resolution.
The Technical Setup: A Coiled Spring
The 200-day Exponential Moving Average sits at approximately $1.34,and XRP is currently trading just 0.9% above it . This is the first real test of that long-term
User_any
$XRP XRP is doing what it does best in uncertain times — hovering just above a critical technical line, waiting for the macro weather to clear.
The token is trading around $1.36 on September 11, up slightly on the session but down more than 6% over the past seven days . It is a market of compressed anticipation, where the price action feels less like a trend and more like a pause before resolution.
The Technical Setup: A Coiled Spring
The 200-day Exponential Moving Average sits at approximately $1.34, and XRP is currently trading just 0.9% above it . This is the first real test of that long-term trend line since the August breakout, and the market is treating it with appropriate gravity .
Look at a three-hour chart and the story becomes clearer. XRP bottomed at $0.9877 on August 17, then ran roughly 70% in three days, spiking to the $1.66 area on August 22 . That vertical move left a long upper wick — the signature of a move that ran out of buyers rather than one that found value. Since August 23, the chart has printed a textbook sequence of lower highs: $1.55, then $1.50, then $1.47, then $1.46 on September 4, then $1.44 on September 9 .
That is distribution, not accumulation.
Momentum indicators tell a similar story. The 14-period RSI on the three-hour chart reads around 34.90, with its signal line at 35.39 . RSI dropped to roughly 25 overnight — deeply oversold — and has bounced from there, but it remains below its signal line. Oversold in a downtrend is not a buy signal on its own. It is simply a reason the fall paused .
On the daily timeframe, RSI sits near 53, suggesting neutral momentum, while the MACD below zero reinforces waning bullish pressure .
The compression is tight. The current three-hour candle has a range of barely one cent, opening at $1.34866 with a high of $1.35933 and a low of $1.34772 . Compression that tight, directly on a major moving average, does not last. Something has to give.
The Macro Overhang: CPI and the Fed
The reason for the hesitation is not hard to find.
Markets are pricing roughly a 60% chance of a 25 basis point rate hike at the September 16 Federal Reserve meeting — a complete flip from the hold expectations of late August . Strong August payrolls at 162,000, core PCE at record highs, and rising oil prices tied to geopolitical tensions have all pushed yields higher .
August CPI lands today. As Crypto Finance analysts put it, "the next few sessions will determine whether investors are right to challenge policymakers, or whether policymakers respond with more force than the market currently expects" .
High-beta assets get sold first in a tightening environment. XRP is high-beta.
If the Fed does hike on September 16, it will drive up Treasury yields and the Dollar Index, triggering outflows from high-risk assets like tech stocks and cryptocurrencies . XRP has already declined under the weight of this macro risk-off sentiment .
The technical damage could be severe. If XRP loses its defensive line at $1.30, it would open up downside potential targeting the psychological $1.00 mark — approximately a 23% drop from current levels .
The XRP-Specific Catalyst: CLARITY Act Vote
There is a second, more specific reason for XRP's recent weakness, and it has nothing to do with the Fed.
On September 15 at 2:15 p.m. Eastern, the Senate holds a cloture vote on the motion to proceed to the CLARITY Act . This is not a vote to pass the bill. It is a procedural vote to allow debate, and it needs 60 votes. Republicans hold 53 seats, which means at least seven Democrats must cross over .
The market does not believe it happens. Polymarket has put 2026 passage odds at around 20%, while Galaxy Digital and the Solana Policy Institute have both assigned roughly 10% odds before the midterms . Senator Cynthia Lummis has warned that failing now could push market structure legislation out to 2030 .
XRP rallied in August partly on CLARITY optimism. The last three weeks look a lot like that optimism being priced back out .
The Fundamentals: Quietly Building
But here is where the story gets interesting. While price action languishes and macro headwinds dominate headlines, the underlying network continues to expand.
Institutional adoption is accelerating. A regional South Korean bank recently became the first to run Ripple Payments, processing 24/7 near-real-time cross-border settlements . This matters because it opens a pathway for other institutions to follow.
Tokenized assets on the XRP Ledger have hit $3.72 billion, a stunning 30-fold increase year-over-year . The recent integration between Ripple Custody and SettleMint's asset lifecycle system — aimed at regulated institutions wanting compliant access to XRPL tokenization — represents the first such solution designed specifically for institutional participants .
Network activity is rising. XRPL cumulative transactions have surpassed 3 million . Ripple's stablecoin RLUSD now has over half its supply on XRPL, with market cap up 23.4% . Payment volume on the XRP network increased 26% to 462.9 million XRP, while payment count rose 33.8% to approximately 827,800 .
ETF flows remain resilient. Despite the price decline, US-listed spot XRP ETFs recorded approximately $5 million in inflows on Thursday, extending a three-day streak . Cumulative inflows now sit at $1.7 billion, with net assets under management averaging $1.45 billion . James Seyffart of Bloomberg has been cited noting that ETF flows have been "more resilient than expected," with cumulative totals around $1.8 billion .
Analyst Zach Rector captured the tension well: XRPL tokenized assets have grown 30x year-over-year, but the ledger's utility must expand from billions to hundreds of billions for triple-digit price targets to become mathematically realistic .
The Market Cap Context
There is a competitive dimension worth noting. XRP's market cap sits at approximately $85 billion, while BNB's is around $95 billion . The gap between them has narrowed to roughly $10 billion, down from $5 billion at the start of September .
With approximately 62.74 billion XRP in circulation, every $0.10 move adds roughly $6.27 billion to the market cap . For XRP to close the gap with BNB at current supply, it would need an additional $0.15 to $0.17 per token — assuming BNB's market cap stays flat .
But as the data shows, not all activity is broad-based. While payment volume and payment count rose, successful transactions fell 37.5%, active users dropped 22.4%, and total transactions declined 29.1% to 1.8 million . The network is being used more intensively for payments but not necessarily growing across all activity metrics .
What to Watch
September 15: Senate cloture vote on the CLARITY Act. A failure here removes a near-term catalyst and could push XRP toward the $1.27-1.25 support zone .
September 16: Federal Reserve decision. A hike validates the hawkish repricing and likely pressures XRP further. A hold, especially with dovish language, could trigger a relief rally .
The $1.30 line: This is the immediate support level to defend. A sustained break below opens the door to $1.00 . Above, resistance sits at the 200-day EMA around $1.36, with a stronger barrier at the Parabolic SAR near $1.57 .
The setup is binary. Either the macro backdrop improves and XRP reclaims its recent highs, or the technical breakdown accelerates. The network's fundamentals are improving. The price is not. That divergence rarely lasts forever — but it can last longer than most traders can afford to wait.
#AugustCoreCPIBeatsExpectations #ShareWeekly
$XRP
repost-content-media
  • 2
$RIVER In 24 hours, it surged from 1.0140 to 1.4060, with 74.8M in trading volume and a 28-point range—this isn't a pump, it's a short-seller meat grinder.
In the 6th to 12th months after the past three halvings, small-cap, high-volatility coins have followed this script: first a wick that blows out shorts, then range-bound attrition, and finally acceleration. At 1.3710, the price is right at the upper edge of the 4-hour chip concentration zone.
My trading logic is simple—don't chase highs; wait for a pullback. Scale in between 1.28 and 1.30, with the position capped at 15% of total capital,
RIVER+35.26%
#GateMeme #GT
GT Reclaims $9.39: Is the Next Move $10?
GT is back in focus.
GateToken is currently around $9.39 USDT, gaining approximately 3.18% over the past 24 hours. For me, the important part is not simply that GT is green today. The bigger question is whether this move can develop into a stronger trend and eventually push GT through the major psychological resistance at $10.
After recovering from the lower $6–$8 region, GT has gradually improved its market structure. Now the chart is approaching a level that could determine the next phase.
$10 Is the First Major Test
At $9.39, GT is onl
GT+1.83%
  • 1
🌈 Gate Live Streaming Inspiration — September 12: Crypto Market Focus
The cryptocurrency market is once again giving traders, investors, and market watchers plenty to discuss. Following the latest CPI data and a series of important developments across crypto, traditional markets, payments, and technology stocks, volatility remains high and sentiment is shifting rapidly.
One of the biggest stories today is Ethereum (ETH) and its renewed momentum. After the latest inflation data provided some relief to markets, Ethereum managed to push toward the $2,600 level, marking an important milestone for
GateLive
🌈 GateLiveStreamingInspiration -September 12
Go live with the following topics now to receive extra official support and promotional exposure!
Today's Topic Recommendations:
🔹 Despite a trading volume of $223 billion over the past 30 days, Ran Neuner notes that Hyperliquid still faces regulatory risks
🔹 Bitcoin News | Bitcoin rebounded $3,255 from a low of $76,046 following the CPI release, breaking past $79,000
🔹 Circle announces plans to acquire Tazapay for $400 million
🔹 Stocks | Optical communication stocks rose over 3% as the investment thesis for the photonics industry regained its footing
🔹 A wave of liquidations triggered by bearish bets fueled an Ethereum rebound
🔹 Bitcoin (BTC) dipped below 77,000 USDT, falling 0.37% in 24 hours
🔹 Supported by easing core CPI, Ethereum hit $2,600 for the first time in seven months
🔹 Market News | CPI data impacts Brent crude ($109) and rate hike odds (76%)—Bitcoin held the $77K level, altcoin leverage saw a sharp pullback, and the "golden cross" failed its initial test
Choose any topic to start a live stream, and you'll have a chance to be featured on the official website's homepage!🔥 Start streaming now: https://www.gate.com/live/apply
repost-content-media
This trend is so obvious I don’t even need to think—the account is dancing on its own💃.
During the repeated intraday swings, $HEMI stood out the most on my watchlist, rising sluggishly, with every rebound being a fake move and the price-volume divergence outrageously obvious. No one was buying at higher prices—what else could this be but distribution? I opened a short directly at 0.008967, with the stop-loss placed above the key level from the previous wave.
Looking again just now, the price had already touched 0.006786, with +480.88% booked in the account. I got the timing right, so there’s
post-image
HEMI-3.72%
BNB+3.27%
SOL+2.39%
Join the Elite Trader Championship, climb the leaderboard, and win exclusive rewards. https://www.gate.com/competition/lead-trader/s1?ref_type=165&ch=Direct&ref=UFRFAQ0M
post-image
USDT.D rejected from 7.12% supply and dropped into 6.87% demand. A relief bounce toward 7.05–7.10% could pressure BTC and alts, but another rejection may target 6.73%. A breakdown there would strengthen bullish momentum across crypto markets. Manage risk, trade levels.
post-image
BTC+0.50%
#交易機器人 I am using the ETHUSDT futures grid bot on Gate. Come copy-trade with me!
post-image
GOLD TESTS YOUR PATIENCE. BITCOIN TESTS YOUR COURAGE. KASPA TESTS YOUR CONVICTION.'
Don’t chase certainty in a dynamic market. Research the technology. Understand the risk. Believe in the vision.
Kaspa is building a different path — Proof of Work, BlockDAG, speed and scalability.'
The market does not reward opinions. It rewards conviction, patience, discipline and risk management.'
DYOR. Think Long Term. Stay Disciplined. Explore (KAS).'
$BTC $kaspa
#Bullrun #Kaspa #BTC #Web3 #BLOCKCHAIN
KasPa
KasPakas
Gate.Fun
MC:$5.94KHolders:1
0%
BTC+0.50%
Do people prefer win rates or returns?
post-image
Load More

Join 40 M users in our growing community

⚡️ Join 40 M users in the crypto craze discussion

💬 Engage with your favorite top creators

👍 See what interests you

View More