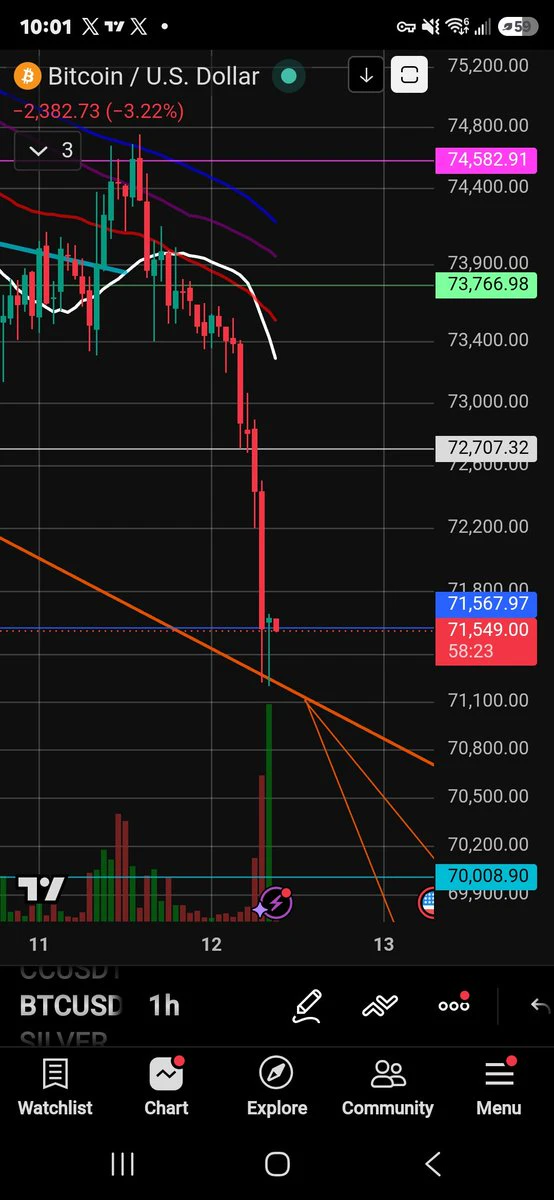
$BTC and #美股 Plunges: Has the Cause Been Updated? The Kurumi Effect? Recently, there’s been a short-video meme: “Whenever Kurumi updates, U.S. stocks plunge.”
After the latest episode of this anime came out, U.S. stocks suffered a historic sell-off, wiping out nearly $3 trillion and making history right before our eyes.
For those who haven’t heard of it, here’s what the anime “FX Fighter Kurumi” is about: a college student wants to earn back the money her mother lost trading forex with leverage, so she follows in her mother’s footsteps and opens positions, then dances on the edge of liquidation every day. The latest episode came out, and U.S. stocks really did deliver—Nasdaq fell 5.52% in a single day, the S&P 500 dropped 4.36%, and nearly $3 trillion vanished overnight. Netizens went wild. Meanwhile, someone posted a picture showing various train delays in Tokyo, dubbed the plunge the “Kurumi effect,” and even joined it with the “Ding Xie effect” as sworn brothers.
When episode six of the anime came out, what happened to U.S. stocks was just like what happened in the anime. How many people have become Kurumi? One line came crashing down, and amid the past-tense AI boom, how many retail investors firmly believed that computing power never sleeps and NVIDIA and semiconductor stocks would always have a solid floor? Any pullback was a golden opportunity to buy. But today, semiconductors were down to just 1/6 conductors; faith in the solid floor was gone, utterly wiped out.
The market has never gone easy on you just because you’re having a hard time!
But really, don’t blame anime. Just look at how many negative factors there have been lately: a hack, wars, midterm elections, and so on.
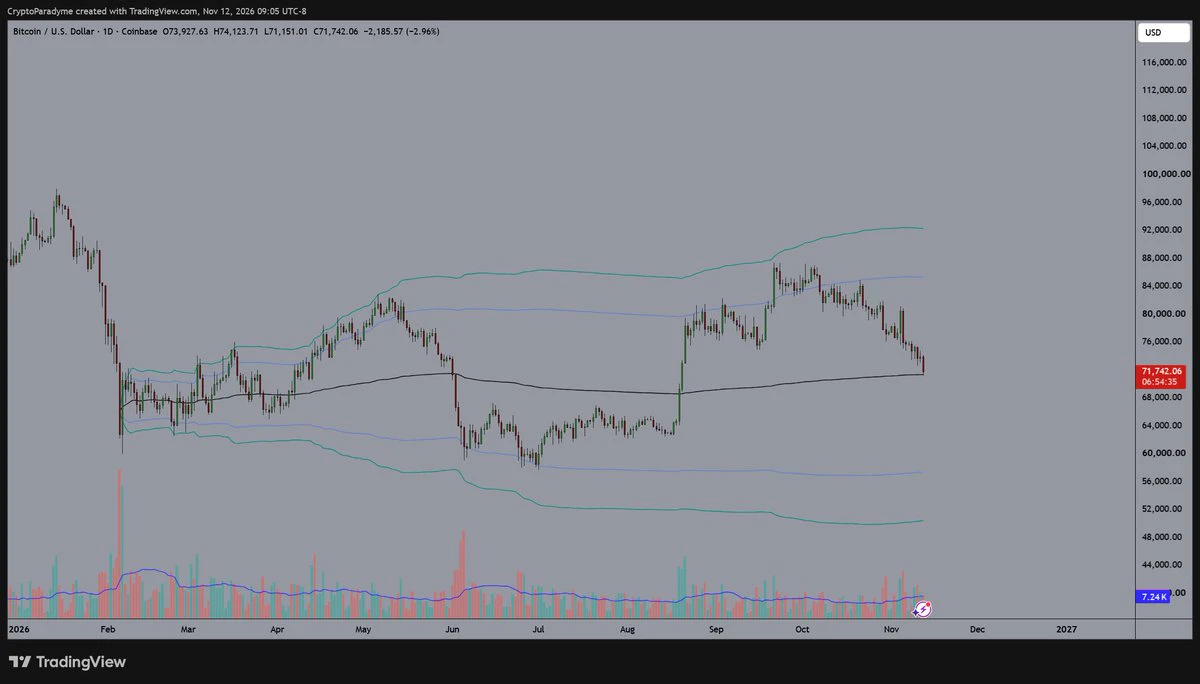
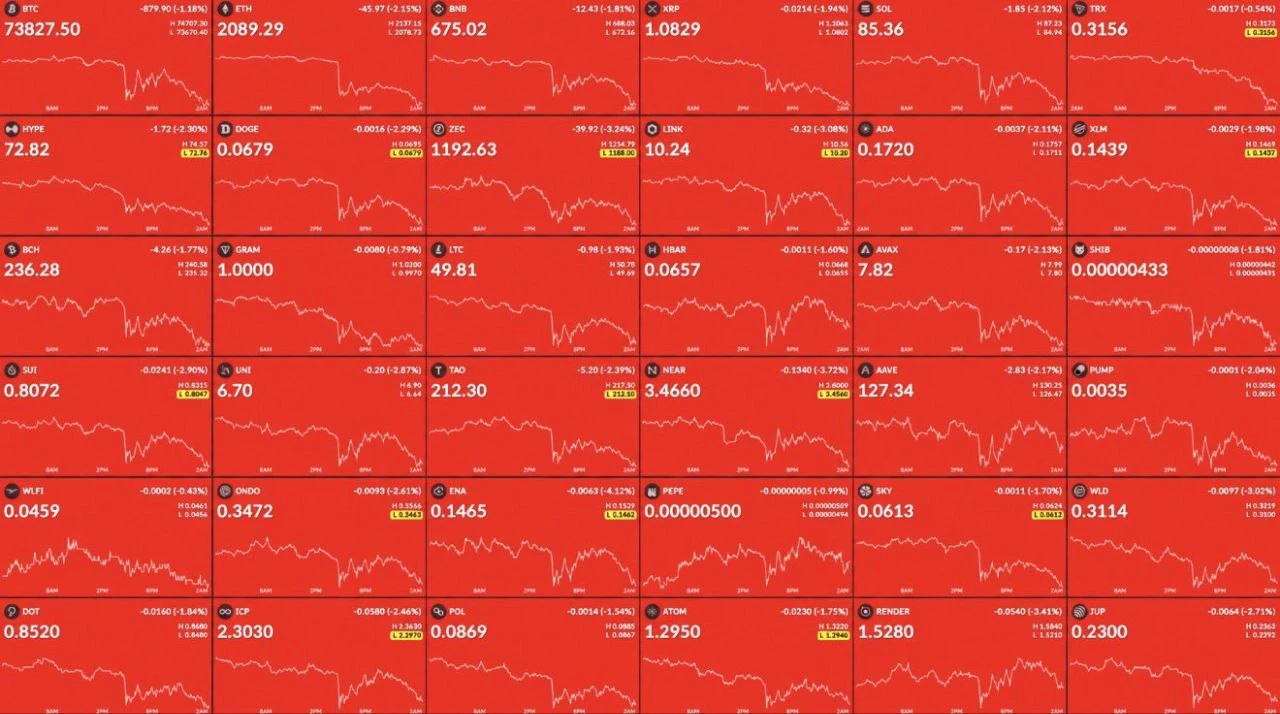
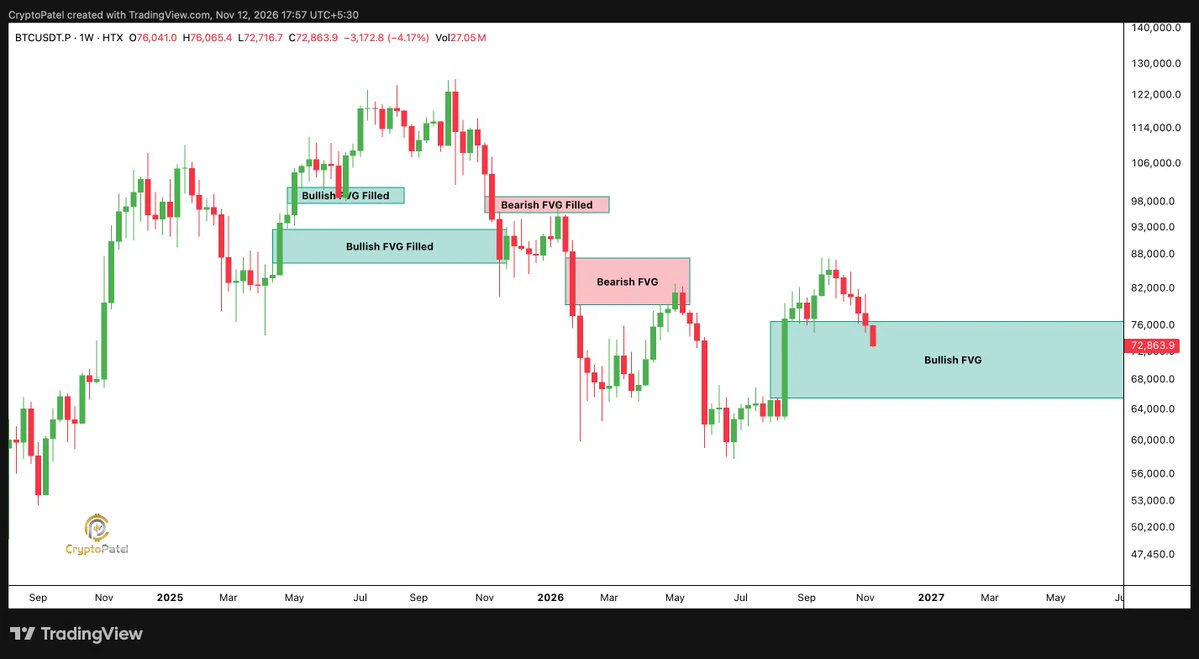
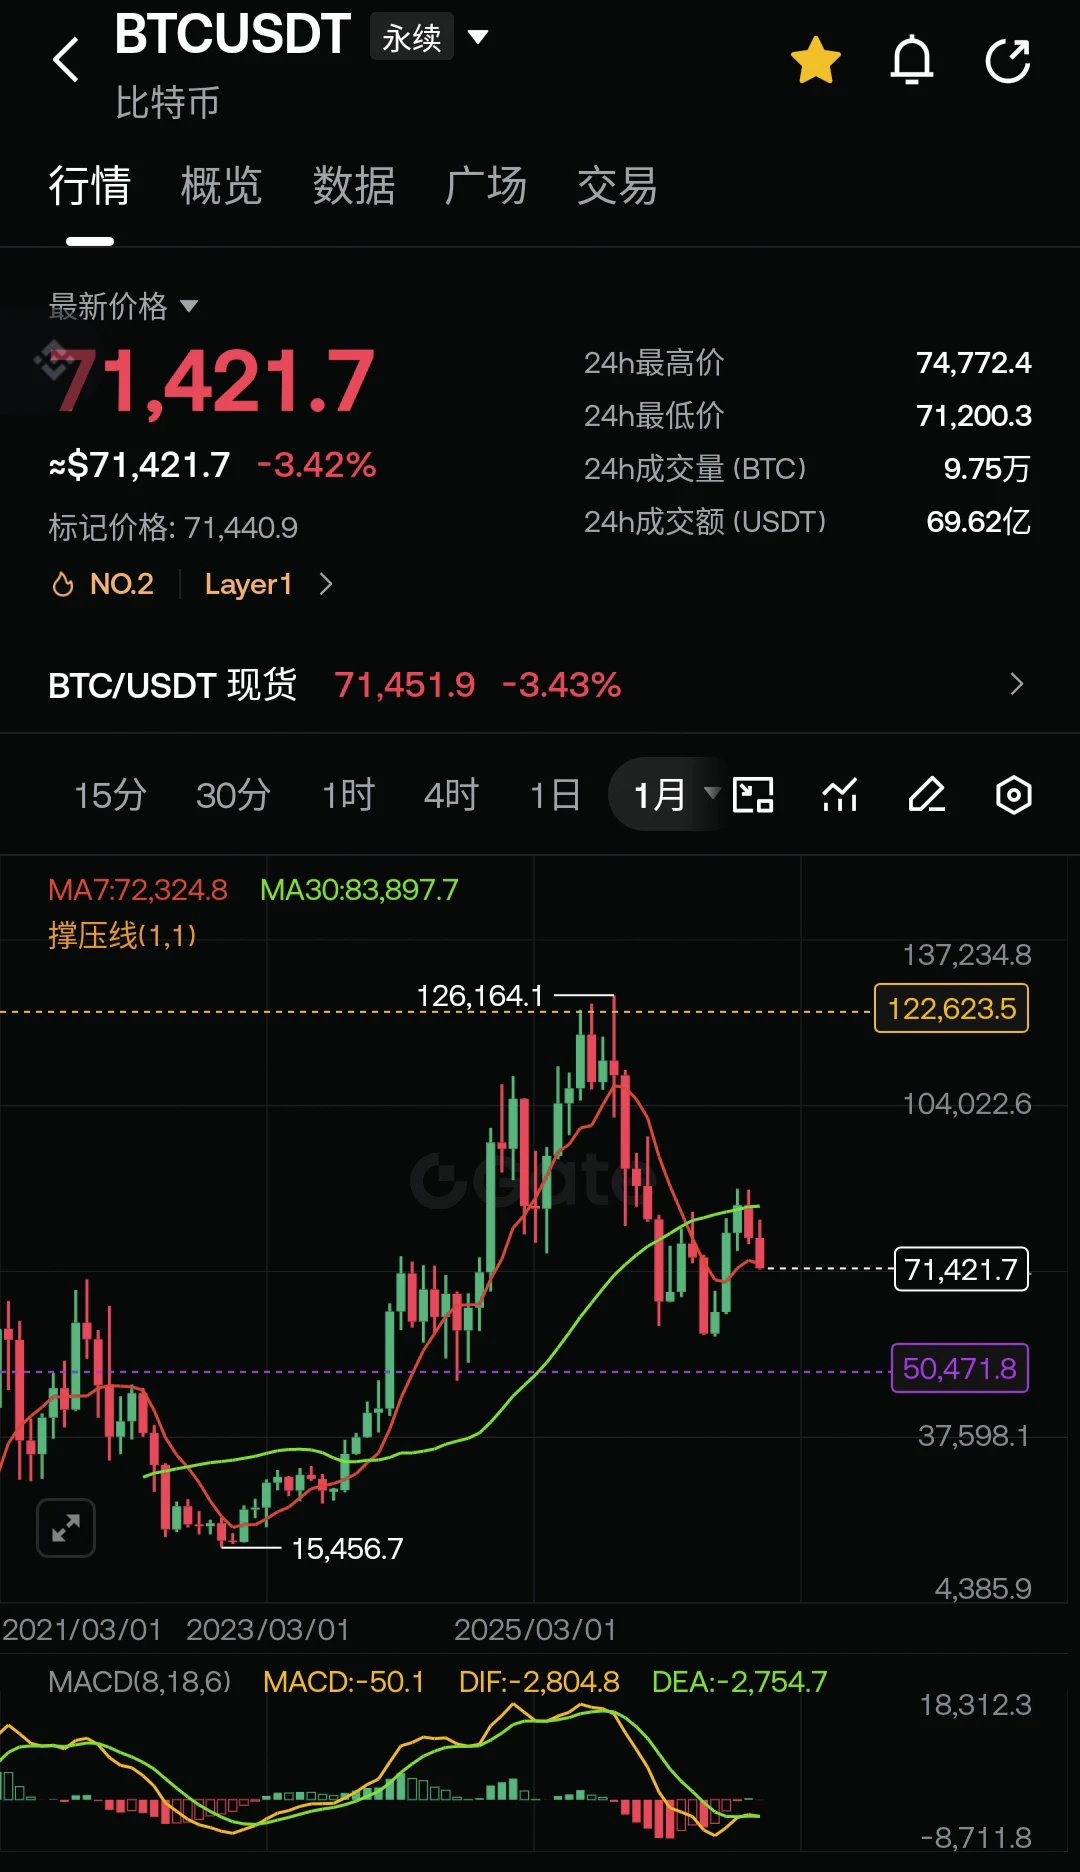
On November 4, Bitcoin even bounced back to $81,000 on the tailwind of the Dow’s 3% gain, looking like it was “moving independently of crypto.” Then the next day, the U.S. stock AI sector collapsed, the Nasdaq closed down 5.52%, and Bitcoin immediately plunged along with it, dropping from above $80,000 straight to $75,200, down about 5.5% for the day, with $140 billion in market cap wiped out in four hours. So much for “digital gold.” Gold edged up 0.9% that day, but Bitcoin followed the Nasdaq. The mood had been optimistic that day, but 24 hours later the Nasdaq was slapped down 5.5% by the AI sector, and Bitcoin plunged along with it. As of November 7, it was hovering around $75,700, with less than 1% movement in 24 hours—looking just like someone who’d just been beaten up, crouched in a corner catching their breath.
The trigger for this decline wasn’t an on-chain security incident or a regulatory crackdown, but a collective collapse in the U.S. stock AI sector. The Nasdaq plunged 5.52% that day, the Philadelphia Semiconductor Index crashed 12.25%, AMD fell more than 17%, and NVIDIA dropped over 9%. Bitcoin wasn’t immune; it just fell a few hours later than chip stocks.
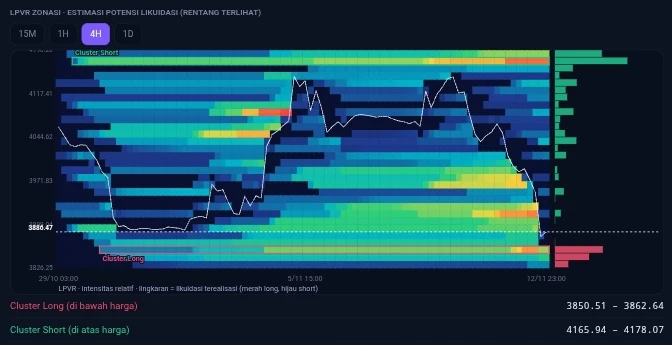
Liquidation data says more about the nature of the move than prices do. About $1.17 billion in crypto derivatives positions were forcibly liquidated in 24 hours, including $342.5 million in Bitcoin-related liquidations, 90.9% of which were longs—about $276 million in bullish leveraged positions wiped out in the same window. This wasn’t a “normal pullback”; it was a targeted cleanup of crowded longs. The overwhelming majority of BTC bets were on prices rising, meaning the drop itself became a self-reinforcing process: price falls → stop-losses triggered → leveraged positions liquidated → price falls further.
The chain reaction started in Washington, not on-chain. After Democrats won both chambers in the midterm elections, markets rapidly repriced the approval and regulatory headwinds facing AI data centers, and the chip, memory, and optical communications sectors were the first to collapse. Institutions moved in the same direction: for the week ending November 6, U.S. spot Bitcoin ETFs saw net outflows of $1.28 billion, their worst weekly performance since late June, wiping out all cumulative net inflows for 2026. BlackRock’s IBIT saw $403 million in outflows on Friday alone, accounting for 88% of that day’s total outflows. The ETF channel has made the transmission between Bitcoin and institutional money in U.S. stocks extremely fast: AI stocks fall → risk budgets shrink → ETF redemptions → market makers and hedge funds reduce BTC positions → leveraged longs get liquidated. No link in the chain requires a “crypto-specific reason.”
Glassnode data quantifies this relationship to a degree that’s hard to dress up with a narrative: over the past 30 U.S. stock trading days, Bitcoin’s correlation with the S&P 500 reached 0.8, its highest level since 2020. A 0.8 correlation doesn’t mean “some connection”; it means that on most trading days, the S&P’s direction can almost explain Bitcoin’s. The claim that “Bitcoin is moving independently” has little empirical basis in light of these figures.
What deserves more serious attention is how the “digital gold” narrative performed during this decline. Gold did not follow risk assets lower during the same period, while Bitcoin moved in the exact opposite direction from gold and sold off in sync with risk assets. Bitcoin is far more volatile than gold, and its market structure relies heavily on ETFs and leveraged traders. Once institutional redemptions begin, derivatives amplify the selling pressure. This is not to say that the long-term fixed-supply thesis is entirely invalid, but when deleveraging and shrinking risk appetite are at play, Bitcoin’s trading-asset characteristics outweigh its store-of-value characteristics. Treating it as a “safe-haven core holding” in a portfolio is an untested assumption in this scenario.
What really warrants caution is not that the Kurumi effect has “come true” once again. It’s that when Bitcoin’s 30-day correlation with the S&P 500 rises above 0.8, when a single week of ETF outflows can wipe out the year’s inflows, and when more than 90% of Bitcoin liquidations come from longs, using “digital gold” or “independent asset” as a reason to hold it amounts to a failure of narrative-level risk management. You can choose to trade it, but you need to understand what you’re trading: right now, it’s a high-beta risk asset dominated by institutional capital, one that gets cut first in response to macro shocks. The narrative can remain, but it shouldn’t shield your position from the blow. #每周来晒 #Gate股票畅聊季
After the latest episode of this anime came out, U.S. stocks suffered a historic sell-off, wiping out nearly $3 trillion and making history right before our eyes.
For those who haven’t heard of it, here’s what the anime “FX Fighter Kurumi” is about: a college student wants to earn back the money her mother lost trading forex with leverage, so she follows in her mother’s footsteps and opens positions, then dances on the edge of liquidation every day. The latest episode came out, and U.S. stocks really did deliver—Nasdaq fell 5.52% in a single day, the S&P 500 dropped 4.36%, and nearly $3 trillion vanished overnight. Netizens went wild. Meanwhile, someone posted a picture showing various train delays in Tokyo, dubbed the plunge the “Kurumi effect,” and even joined it with the “Ding Xie effect” as sworn brothers.
When episode six of the anime came out, what happened to U.S. stocks was just like what happened in the anime. How many people have become Kurumi? One line came crashing down, and amid the past-tense AI boom, how many retail investors firmly believed that computing power never sleeps and NVIDIA and semiconductor stocks would always have a solid floor? Any pullback was a golden opportunity to buy. But today, semiconductors were down to just 1/6 conductors; faith in the solid floor was gone, utterly wiped out.
The market has never gone easy on you just because you’re having a hard time!
But really, don’t blame anime. Just look at how many negative factors there have been lately: a hack, wars, midterm elections, and so on.
On November 4, Bitcoin even bounced back to $81,000 on the tailwind of the Dow’s 3% gain, looking like it was “moving independently of crypto.” Then the next day, the U.S. stock AI sector collapsed, the Nasdaq closed down 5.52%, and Bitcoin immediately plunged along with it, dropping from above $80,000 straight to $75,200, down about 5.5% for the day, with $140 billion in market cap wiped out in four hours. So much for “digital gold.” Gold edged up 0.9% that day, but Bitcoin followed the Nasdaq. The mood had been optimistic that day, but 24 hours later the Nasdaq was slapped down 5.5% by the AI sector, and Bitcoin plunged along with it. As of November 7, it was hovering around $75,700, with less than 1% movement in 24 hours—looking just like someone who’d just been beaten up, crouched in a corner catching their breath.
The trigger for this decline wasn’t an on-chain security incident or a regulatory crackdown, but a collective collapse in the U.S. stock AI sector. The Nasdaq plunged 5.52% that day, the Philadelphia Semiconductor Index crashed 12.25%, AMD fell more than 17%, and NVIDIA dropped over 9%. Bitcoin wasn’t immune; it just fell a few hours later than chip stocks.
Liquidation data says more about the nature of the move than prices do. About $1.17 billion in crypto derivatives positions were forcibly liquidated in 24 hours, including $342.5 million in Bitcoin-related liquidations, 90.9% of which were longs—about $276 million in bullish leveraged positions wiped out in the same window. This wasn’t a “normal pullback”; it was a targeted cleanup of crowded longs. The overwhelming majority of BTC bets were on prices rising, meaning the drop itself became a self-reinforcing process: price falls → stop-losses triggered → leveraged positions liquidated → price falls further.
The chain reaction started in Washington, not on-chain. After Democrats won both chambers in the midterm elections, markets rapidly repriced the approval and regulatory headwinds facing AI data centers, and the chip, memory, and optical communications sectors were the first to collapse. Institutions moved in the same direction: for the week ending November 6, U.S. spot Bitcoin ETFs saw net outflows of $1.28 billion, their worst weekly performance since late June, wiping out all cumulative net inflows for 2026. BlackRock’s IBIT saw $403 million in outflows on Friday alone, accounting for 88% of that day’s total outflows. The ETF channel has made the transmission between Bitcoin and institutional money in U.S. stocks extremely fast: AI stocks fall → risk budgets shrink → ETF redemptions → market makers and hedge funds reduce BTC positions → leveraged longs get liquidated. No link in the chain requires a “crypto-specific reason.”
Glassnode data quantifies this relationship to a degree that’s hard to dress up with a narrative: over the past 30 U.S. stock trading days, Bitcoin’s correlation with the S&P 500 reached 0.8, its highest level since 2020. A 0.8 correlation doesn’t mean “some connection”; it means that on most trading days, the S&P’s direction can almost explain Bitcoin’s. The claim that “Bitcoin is moving independently” has little empirical basis in light of these figures.
What deserves more serious attention is how the “digital gold” narrative performed during this decline. Gold did not follow risk assets lower during the same period, while Bitcoin moved in the exact opposite direction from gold and sold off in sync with risk assets. Bitcoin is far more volatile than gold, and its market structure relies heavily on ETFs and leveraged traders. Once institutional redemptions begin, derivatives amplify the selling pressure. This is not to say that the long-term fixed-supply thesis is entirely invalid, but when deleveraging and shrinking risk appetite are at play, Bitcoin’s trading-asset characteristics outweigh its store-of-value characteristics. Treating it as a “safe-haven core holding” in a portfolio is an untested assumption in this scenario.
What really warrants caution is not that the Kurumi effect has “come true” once again. It’s that when Bitcoin’s 30-day correlation with the S&P 500 rises above 0.8, when a single week of ETF outflows can wipe out the year’s inflows, and when more than 90% of Bitcoin liquidations come from longs, using “digital gold” or “independent asset” as a reason to hold it amounts to a failure of narrative-level risk management. You can choose to trade it, but you need to understand what you’re trading: right now, it’s a high-beta risk asset dominated by institutional capital, one that gets cut first in response to macro shocks. The narrative can remain, but it shouldn’t shield your position from the blow. #每周来晒 #Gate股票畅聊季