
Square
Following
Hot
News
Notifications
Profile
Share your thoughts
placeholder
Article
#GoldNears3500
🥇 #GoldNears3500

Gold is getting closer to the important $3,500 level, and traders are watching this price zone very carefully.

The next move could be important for the gold market. If buyers maintain strong momentum, gold may move higher and test new resistance levels.

However, if sellers enter the market, we could see a pullback or a short-term correction.

Traders should also pay attention to US economic data, inflation reports, interest rate expectations, and dollar strength because these factors can influence gold prices.

Let's discuss!

1. Can gold break above $3,500
XAU+0.38%
X renowned trader mk4 closed out BTC short positions, capturing nearly $7,000 drop
live-cover
LIVE1,632
MU-13.88%
AAPL-1.83%
TSLA-7.56%
SPCX-7.38%
NVDA-13.84%
Trenches
PIEVERSE
P
bade
b
PIEVERSE
0x0e...25a9
Market Cap
$
Change
.
24h Vol
$.
Holders
.
IDOL
I
bade
b
IDOL
0x3b...ab07
Market Cap
$.
Change
.
24h Vol
$.
Holders
.
JAGENT
J
bade
b
JAGENT
0x8e...ae15
Market Cap
$.
Change
.
24h Vol
$
Holders
.
mihao
m
bade
b
mihao
4Cxj...pump
Market Cap
$.
Change
.
24h Vol
$.
Holders
.
Singularity
S
bade
b
Singularity
7R4M...pump
Market Cap
$.
Change
.
24h Vol
$.
Holders
.
Did you make a profit today?

The volatility of major coins is still somewhat underwhelming. Altcoins have been moving better. I trimmed part of my position and kept holding for just three days.

Those who followed along should have made some comfortable profits this time, right? Don’t get impatient. Use patience and time to generate profits—let time create room for growth.

A lot of people have recently added me to learn, and I’ve met many people like this. But trading is a gradual process, not a way to get rich overnight. As I always say, if you don’t want to learn, don’t contact me—I don’t
BULLA+10.92%
ETH-1.23%
$NEAR Nears 3.06 Resistance; Holding Above After a Breakout Is Key
$NEAR is currently priced at 3.003, up 4.018% over the past 24 hours. The intraday high is 3.06, and the low is 2.832. The 1-hour chart shows strength: the price has broken above the 1-hour EMA20 at 2.9471, and RSI14 is 74.11, nearing overbought territory. The price has touched the 1-hour resistance at 3.06, but whether it can hold above this level and continue rising is key.
The 4-hour chart also shows strength, with the price slightly above the 4-hour EMA20 at 2.9695, though it remains well below the 4-hour resistance at 3.47
post-image
$BTC is testing the patience of everyone who bought recently.
$15B in unrealized losses is no joke.
Weak hands are getting a masterclass in volatility.
How much selling pressure is actually left?
BTC-0.67%
  • 1
#USNOVJoblessClaimsBeatExpectations ### BTC Rebound Faces $60K Test 🚀

Bitcoin is trying to make a strong recovery after facing heavy selling pressure. The market is now watching an important level of $60,000. This level could play a major role in the next move of Bitcoin. Traders and investors are waiting to see whether BTC can move above this level and continue its recovery.

Bitcoin has faced a difficult market situation. Sellers have pushed the price down, and many traders are still worried about further losses. However, every market correction also brings new opportunities and new questi
post-image
BTC-0.67%
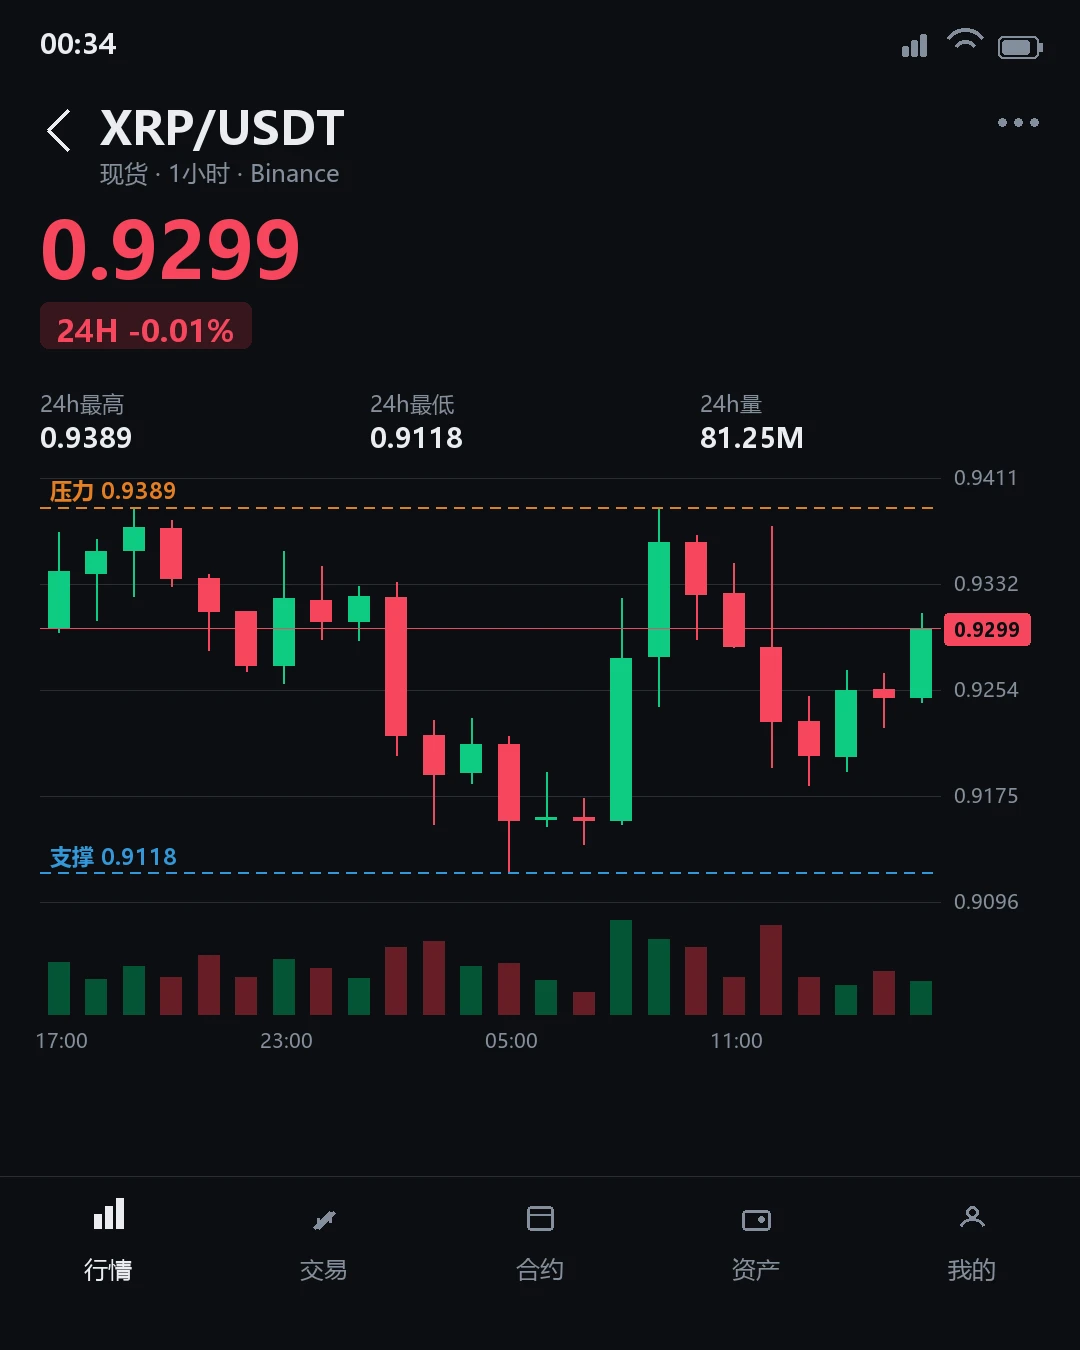
$XRP The current price is 0.9291, up 0.04% over the past 24 hours. However, the 1-hour timeframe looks strong, while the 4-hour timeframe looks weak, showing a clear divergence. The 1-hour RSI is 56.22, indicating short-term strength, while the 4-hour RSI is 44.16, indicating longer-term weakness. This conflict between timeframes can easily lead people to misread it as a trend reversal signal, when it may simply be short-term volatility.
I’d rather see this as direction not yet confirmed than rush to label it a rebound or pullback. The key thing to watch now is which timeframe changes directio
post-image
XRP-1.15%
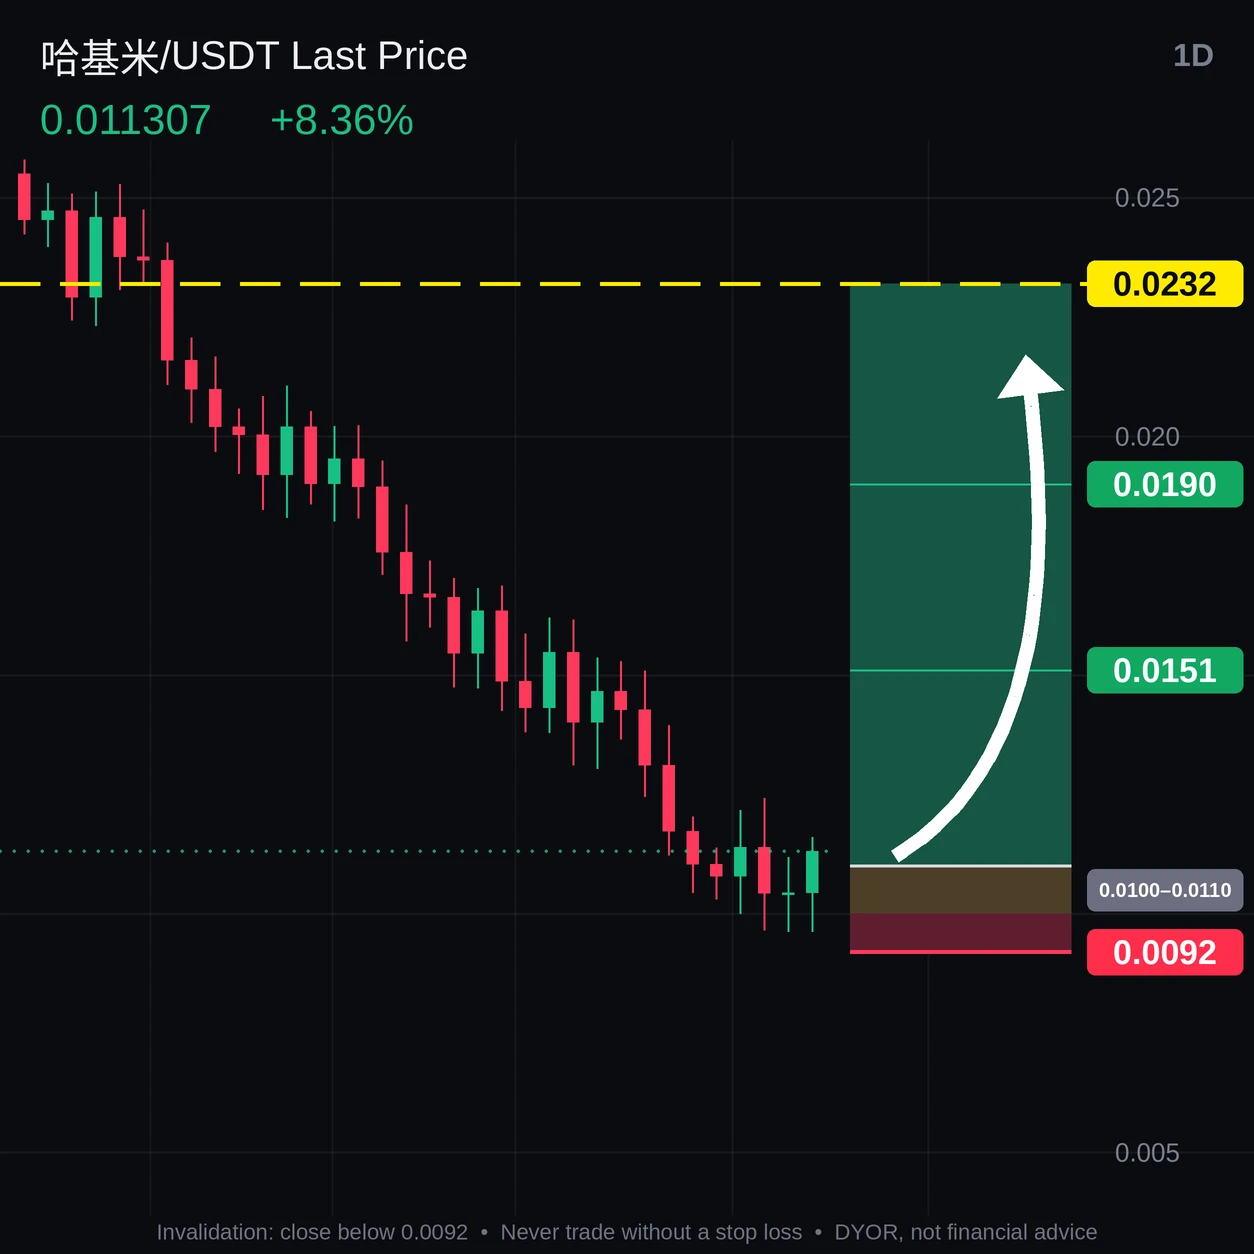
🟢 $Hakimi ‌ /USDT LONG

Entry: $0.0100 – $0.0110
SL: $0.0092
TP1: $0.0151
TP2: 0.0190
TP3: $0.0232

A daily close above $0.0115 would make the long considerably stronger.

⚠️ Invalidation zone: $0.0090 – $0.0097
post-image
哈基米-2.13%
  • 1
  • 1
Join the Gate 2026 Annual Gala: register to get 100 boost points and vote for your favorite stars of the year. For every 100 boost points you use, you get 1 draw chance(s) for a shot at surprise prizes. https://www.gate.com/competition/Annual-Gala?ref_type=165&ch=Direct&ref=VLIWBLOKUW
post-image
  • 1
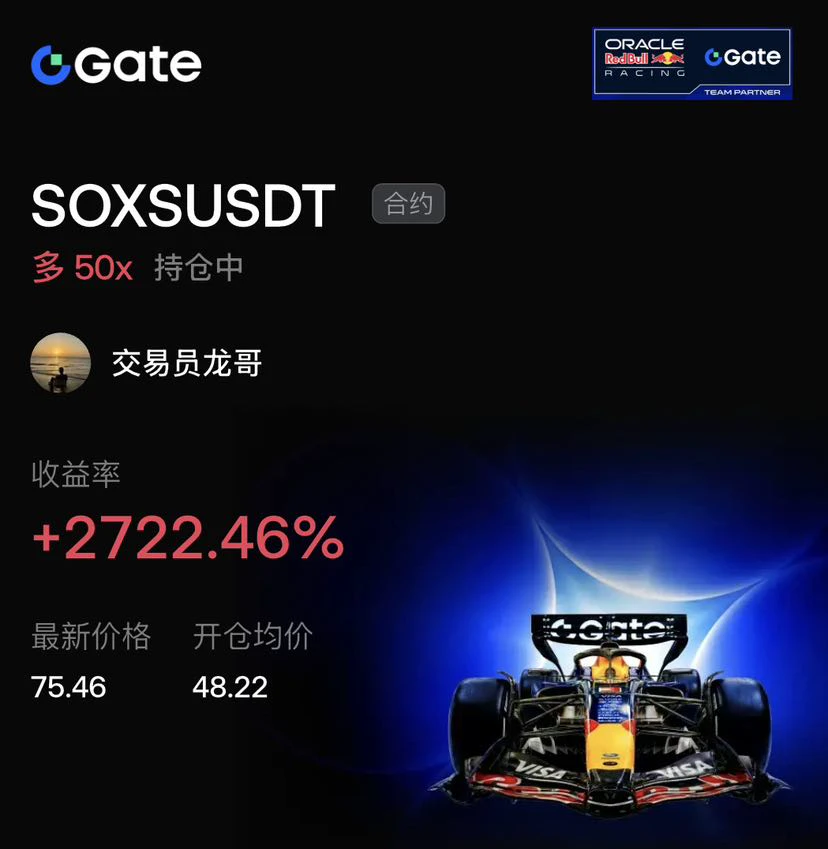
$SOXS From the low of 48.22, it blasted straight up to 75.46—the bulls took off without even leaving the shorts a splash!

The 48.22 bottom was obvious at a glance, so I slammed into a 50x long! A wick nearly liquidated me in seconds, but thankfully my break-even stop held firm, and I still pocketed a full 27x profit!

On the next pullback, keep longing above 72, with a stop at 70! Chase the long on a breakout above 78 and target 82! If it holds at 70, you can try a small long, with a stop below 65. If you’re slow to exit, you’ll go straight to zero$BTC $SOL
#BTC反弹后再争6万美元关口
post-image
SOXS+1.46%
BTC-0.65%
SOL-0.74%
#BTCReboundFaces60KTest #ShareWeekly

BITCOIN RECOVERS TO $60,750 AFTER BREAKING BELOW $60,000: IS THIS THE START OF A STRONGER BOUNCE OR JUST A TEMPORARY RELIEF RALLY?

Bitcoin is sending an interesting signal to the market. After briefly falling below the psychologically important $60,000 threshold, BTC has recovered to approximately $60,750, bringing fresh attention to the battle between buyers and sellers. This recovery is important because it shows that buyers are still willing to enter the market when prices move lower. However, the bigger question is whether this rebound has enough str
post-image
BTC-0.67%
What does $BTC mean? Two addresses suspected of belonging to the same institution have taken heavy long positions in Bitcoin. Looks like a rebound is coming on Monday!
post-image
BTC-0.67%
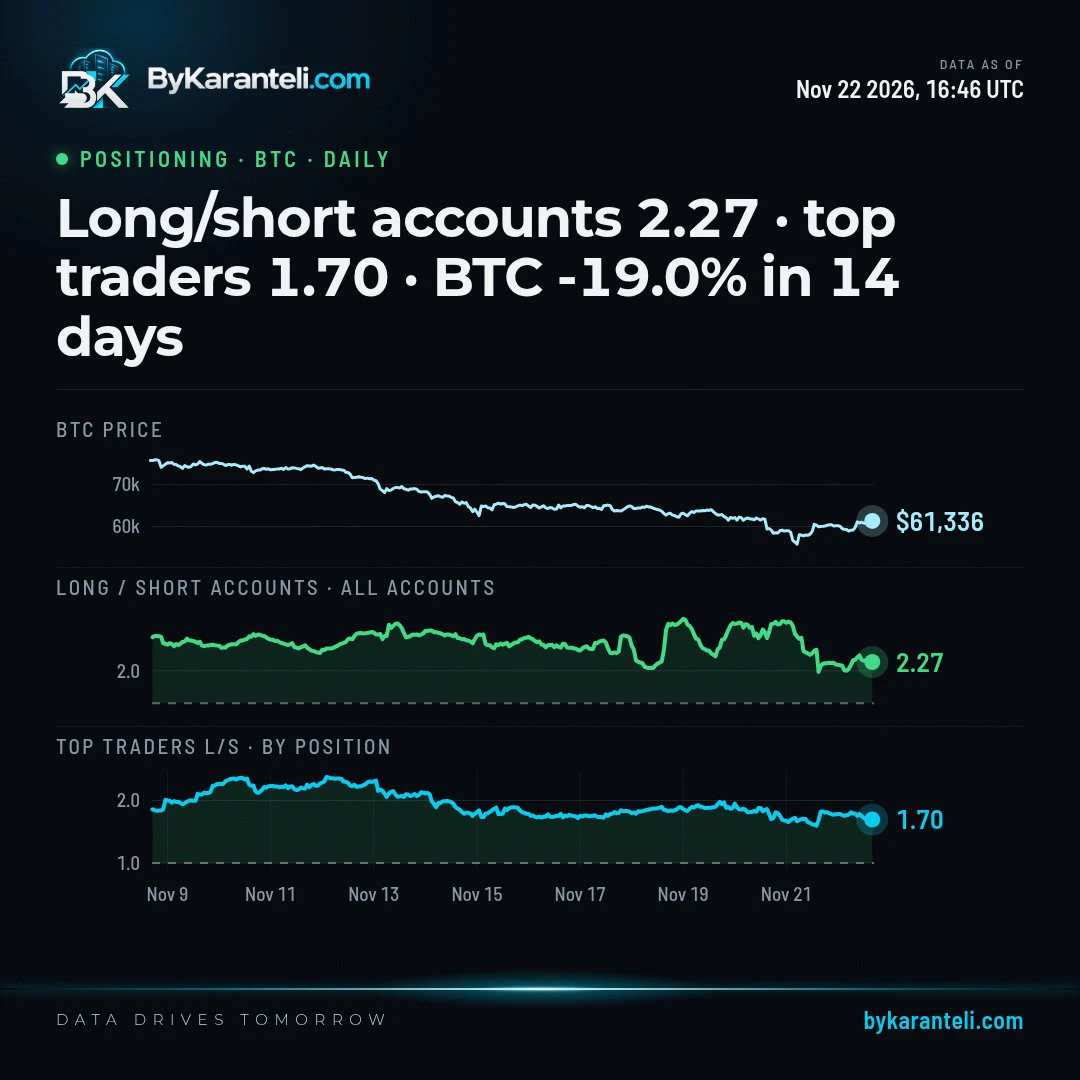
$BTC 's biggest traders lean long by headcount, and far less by the size of their bets.
Counted by account, top traders hold 2.59 longs per short. Weighted by position size, the same group reads 1.7.
post-image
BTC-0.65%
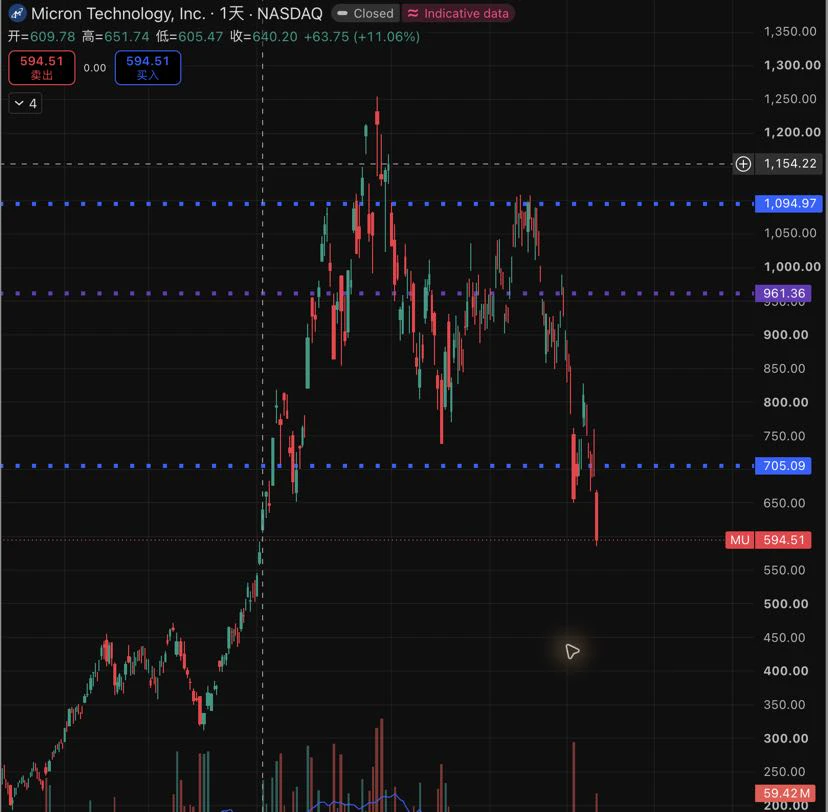
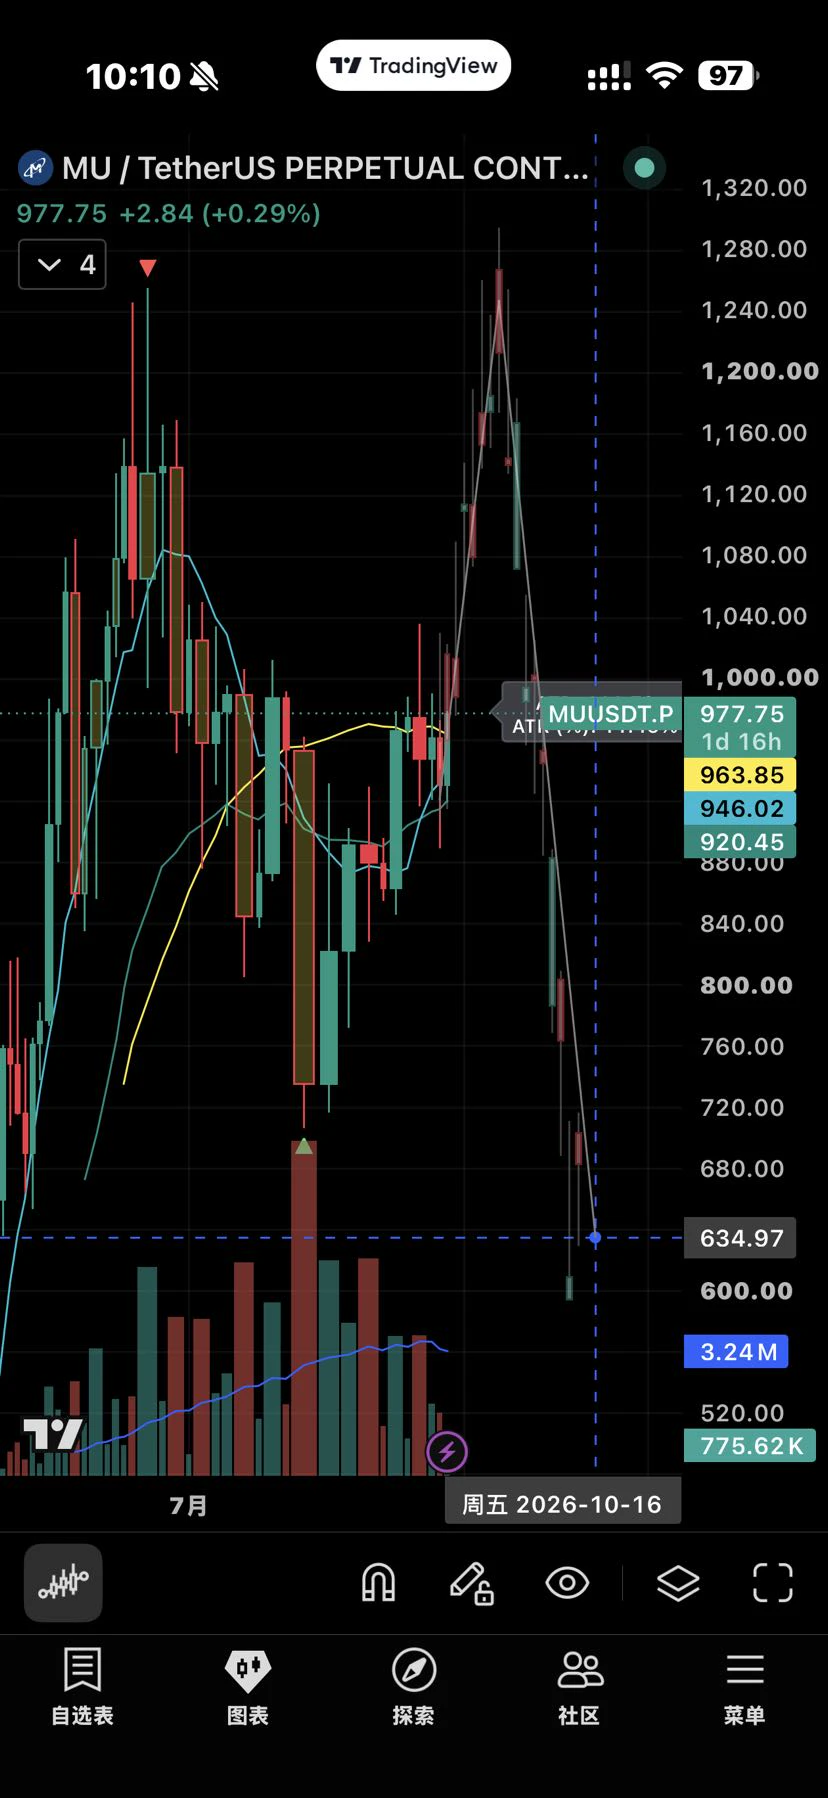
At the end of August, I drew a chart for everyone showing Micron's price action this year.
Now open Micron's candlestick chart and compare!
You'll know what you missed!
post-image
JsBigShark
Those holding short positions in Micron,
Hurry and close them out.
The market will most likely develop like this next.
#mu
repost-content-media
  • 8
  • 2
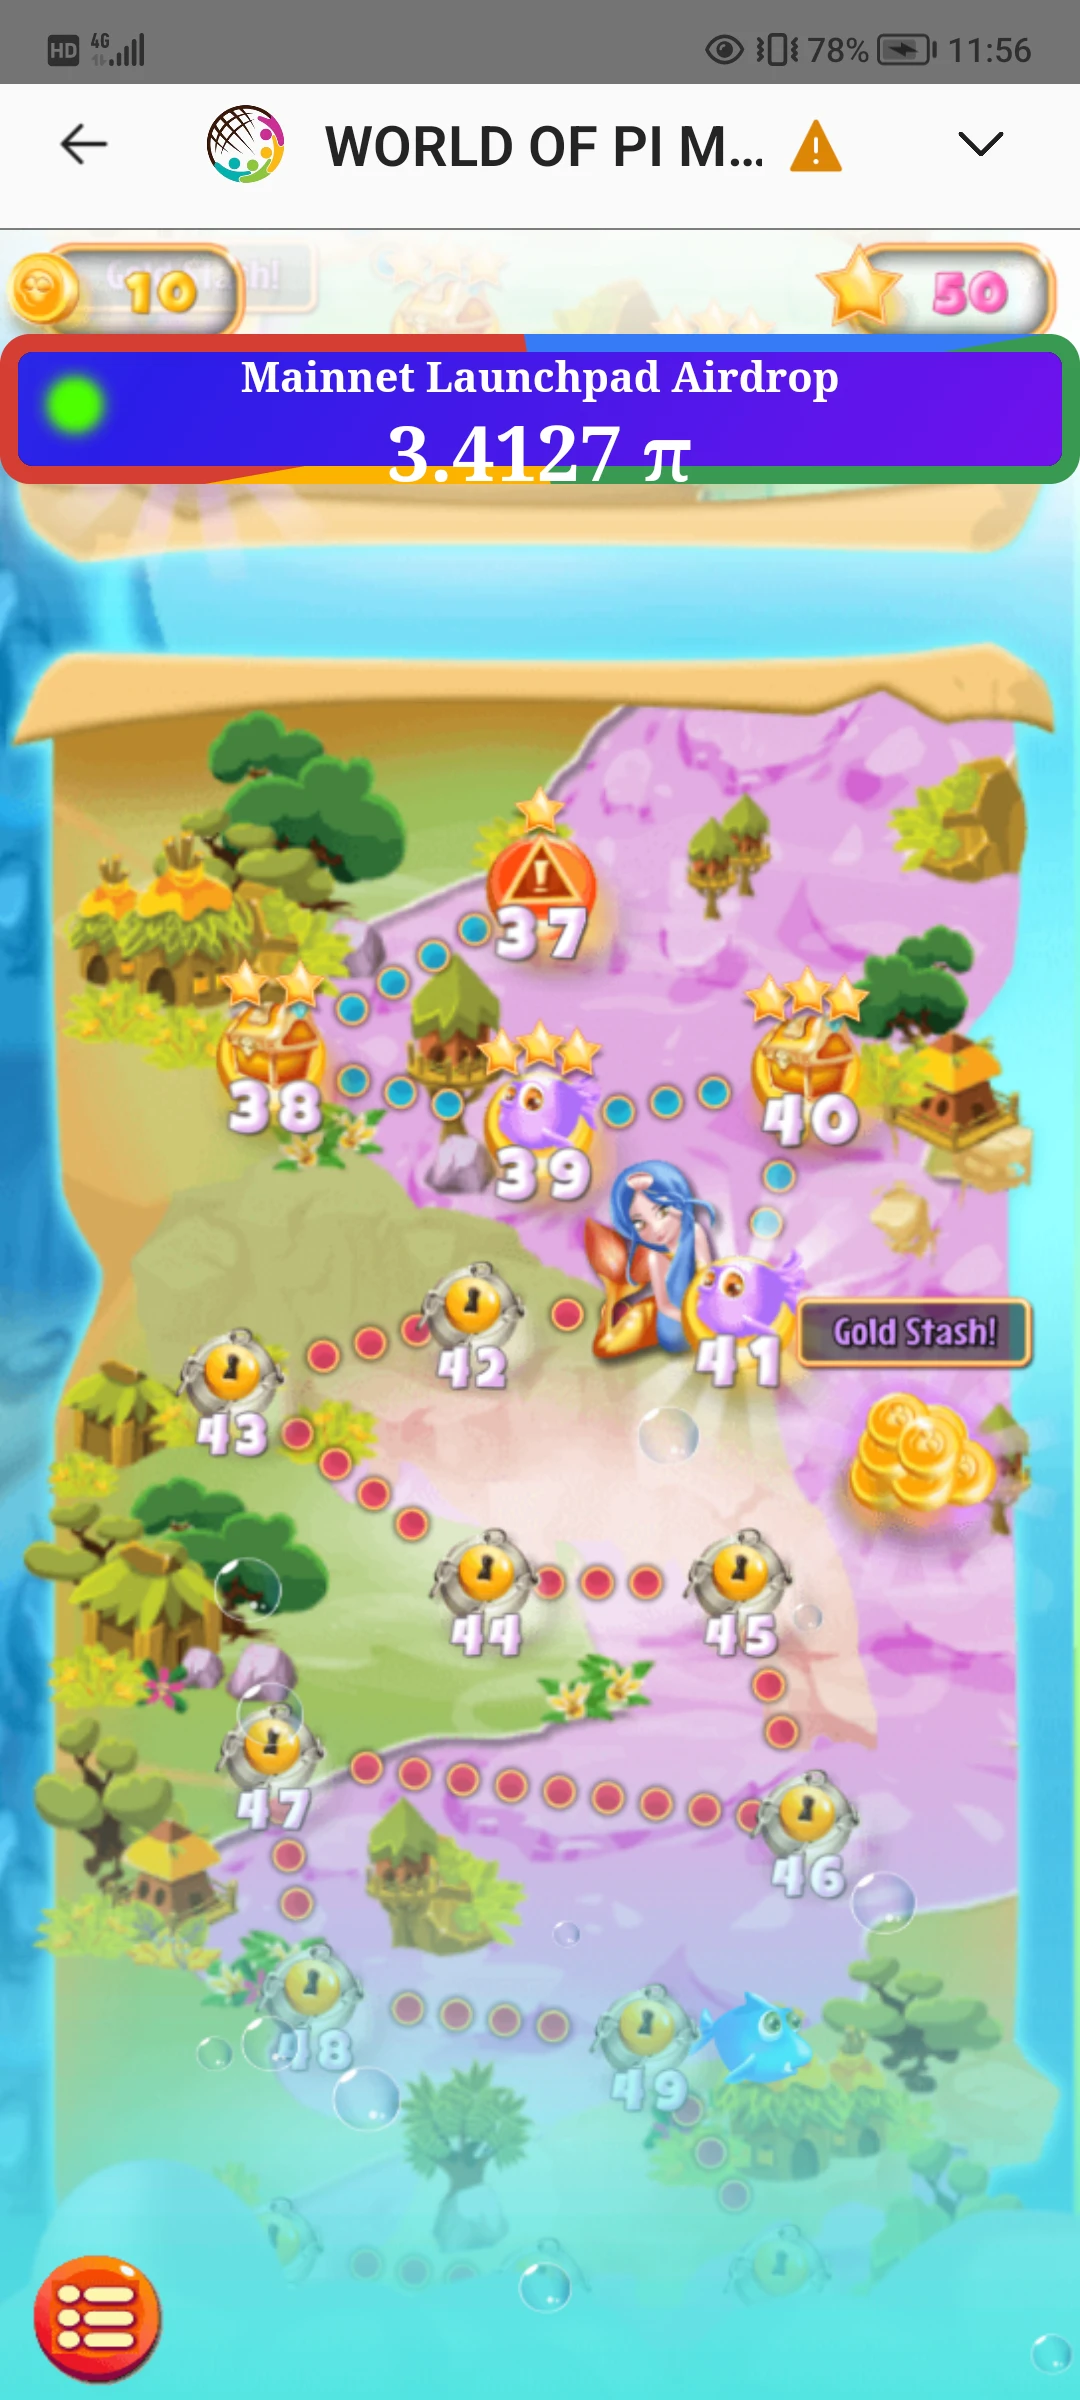
$PI Play casually and earn Pi easily. There are so many ecosystems, it’s really impossible to keep up. The ecosystem is opening up faster—seize the early ecosystem benefits
post-image
PI-0.60%
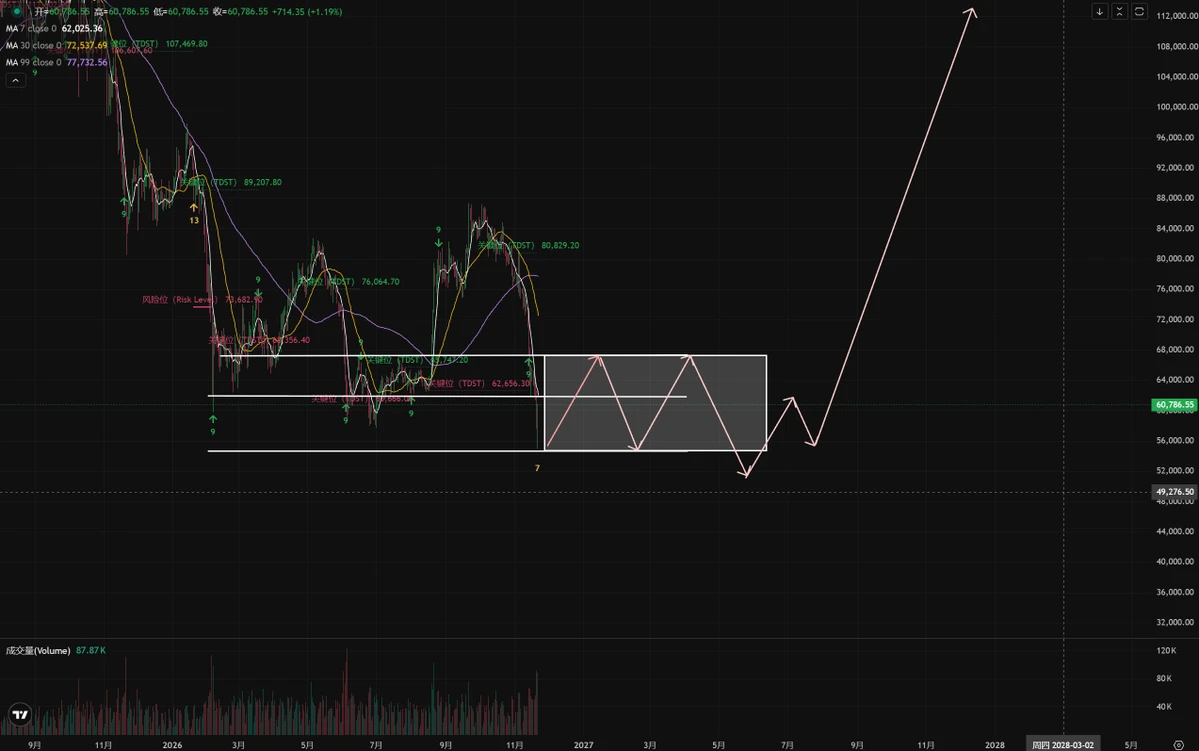
A lot of people regret #BTC not buying the dip at $55000 🤡
⚠️There’s actually absolutely no need to worry!
Not once in #BTC 's history has a bull market started with a wick!
Usually, it goes through an incredibly long “sideways period,”
sideways until the market has no liquidity, funding rates stay negative, and the “Fear” index remains at rock bottom.....
Then another sharp wick down! 🍌 is expected around (52000)
When everyone thinks it’s all over
the next bull market quietly begins......
Next cycle: $200000, see you at $200,000👀
⚠️ps: Those who didn’t buy the dip, don’t rush—there will
post-image
BTC-0.65%
  • 2
#GateLeadsRWAPerpExpansion
🚀 #GateLeadsRWAPerpExpansion

Gate is continuing to expand its presence in the Real-World Asset (RWA) market, bringing more attention to the connection between traditional financial markets and cryptocurrency trading.

RWA is an exciting part of the crypto industry because it connects blockchain technology with real-world assets such as gold, stocks, and other financial instruments.

Perpetual trading can also provide more flexibility for traders who want to follow market movements without directly owning the underlying assets.

I believe RWA has strong potential t
post-image
RWA-0.39%
XAUUSD-2.40%
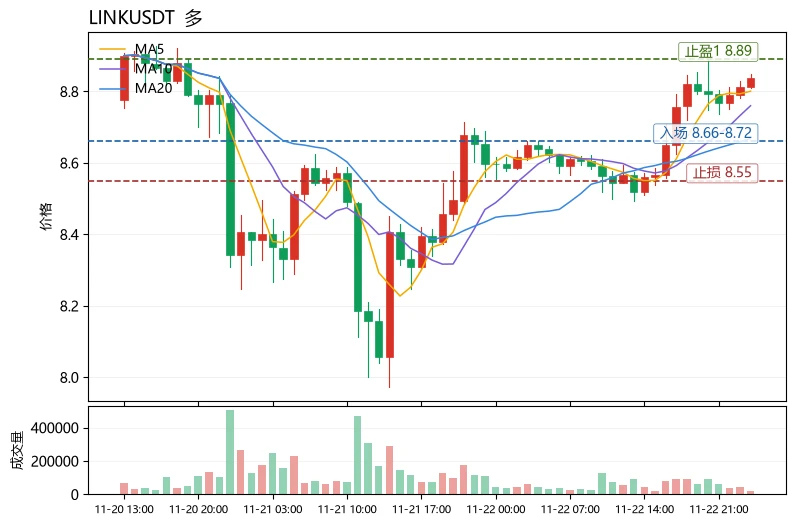
Can a bullish moving-average alignment alone justify chasing longs? Not necessarily; the key is the “health” of the trend.
Using $LINK as an example, here’s a reusable method for reading the chart: first, check the moving-average structure: MA5=8.80 has crossed above MA20=8.67, indicating an upward short- to medium-term trend—this is the prerequisite. Next, check momentum: the MACD histogram at +0.0188 remains bullish, but RSI=66.3 is nearing overbought territory, suggesting the rally is accelerating rather than just starting. Finally, check the price level: the current price of 8.837 is hugg
post-image
LINK-0.18%
TRUMP-0.95%
Market Update
live-cover
LIVE1,191
BTC-0.67%
Load More

Join 40 M users in our growing community

⚡️ Join 40 M users in the crypto craze discussion

💬 Engage with your favorite top creators

👍 See what interests you

Trending Topics

BTCReboundFaces60KTest

2.2M Views30.1K Discussing

BTC rebounded from around $55,300 on November 21, briefly reclaiming $60,000 before pulling back to around $59,300. The $60K level is back in focus as traders assess whether the recovery can last. Is this rebound a sign of stabilization or a short-lived recovery? Would reclaiming and holding $60K be enough, or do you need confirmation from trading volume and fund flows?

PCEAndGDPDataNextWeek

260.2K Views2.6K Discussing

GateDirectIPOPhase3ANTAllocates92100Shares

848.8K Views5.1K Discussing

View More