Square
Following
Hot
News
Profile
Share your thoughts
placeholder
Article
● Stop-loss setting: Set the stop loss after holding above 2550 (to prevent a false breakout).
● Take-profit targets: First target 2525, second target 2510 (lower Bollinger Band support).● Take-profit targets: First target 2545 (previous high resistance), second target 2555 (targeting 2570 after breaking the previous high).#晒出我的持仓收益#
post-image
BTC & GT Price Prediction - Will GT Hit $30?
live-cover
LIVE77
Which one of those #Memecoins will you never sell, no matter what #_____🚀
post-image
10.12 Trump: Russia and Ukraine agree to an “energy ceasefire”
This was the reason the crypto market rose during yesterday’s overnight session.
Trump posted on the 11th that Russia and Ukraine had agreed to an energy ceasefire: neither side would continue attacking the other’s energy infrastructure, such as refineries, oil and gas facilities, and power facilities. However, this is not a comprehensive ceasefire, and fighting will continue in other areas of the battlefield.
Zelensky initially said he was unaware of the agreement, but later stated that if Russia fulfills its commitment, Ukraine i
On Ethereum’s one-hour chart, the bullish momentum has clearly weakened after this rally, and the risk of a pullback is gradually accumulating. Technically, the price came under pressure and retreated after surging to touch the upper band, and has now fallen below it. Although the price is temporarily holding above the Bollinger middle band, trading volume during the rise has shrunk significantly compared with the earlier rally, showing insufficient willingness to chase higher. This rally was driven by short-term funds and lacks sustained buying support. The high-level consolidation is a typic
post-image
ETH+1.12%
$SUI Target Hit Short 75X Leverage Opened! 👀
post-image
SUI+1.36%
$ENJ 🚨 🚨 MASSIVE SEND ANYDAY NOW!! STACK UP WHILE YOU CAN!! 🚨 🚨
post-image
ENJ+1.20%
📊 In 2 years, about 700,000 people were withdrawn from crypto exchanges. BTC — the balance of sites decreased from about 3.15 million to 2.45 million coins, Coin Glass data show.
#LedgerLossesNear90Million $BTC ‌
post-image
BTC+0.85%
What’s the best option now for HODLers? 💚
#crypto #memecoins
post-image
When Volcker took over the Federal Reserve in 1979, the year-over-year U.S. CPI surged to 14.8% in March 1980. He did not choose to “wait and see.” Instead, he pushed the federal funds rate to around 20% and used money-supply targets to force inflation down. Three years later, CPI had fallen to around 3%, but the cost was two recessions, in 1980 and 1981–1982. The unemployment rate exceeded 10.8% by the end of 1982. Midwestern farmers, squeezed by high interest rates and collapsing land prices, drove their tractors to Washington and blocked the entrance to the Federal Reserve. That was not pol
post-image
$LUMIA : Two timeframes are in conflict; the key is not guessing the direction
$LUMIA 24 hours +20.74%, current price 0.1246. On the surface, this is merely a rise or fall, but the real conflict is hidden in the timeframes: the 1-hour chart is weak, while the 4-hour chart is strong. When the two charts give opposite answers, the least useful thing to do is pick the chart you prefer and believe it completely.
The opposing view also has clear invalidation levels. A break below the 1-hour support at 0.1015 would show that short-term buying support has failed its test; if the 4-hour support at 0.07
post-image
LUMIA+23.92%
$AVAX The higher it rises, the more people fear missing out, but what is truly lacking at elevated levels is not hype, but support when it pulls back.
This time, I’m not looking at the gainers and losers list, only the levels. The current price is 10.939, about 6.83% from the 1-hour support at 10.192 and about 0.56% from the resistance at 11.
My criteria are simple: only a breakout above 11 followed by continuation would count as follow-through higher; a break below 10.192 invalidates the original view. The 1-hour and 4-hour trends are both strong, with RSI at 84 and 72, respectively.
The deba
post-image
AVAX+6.09%
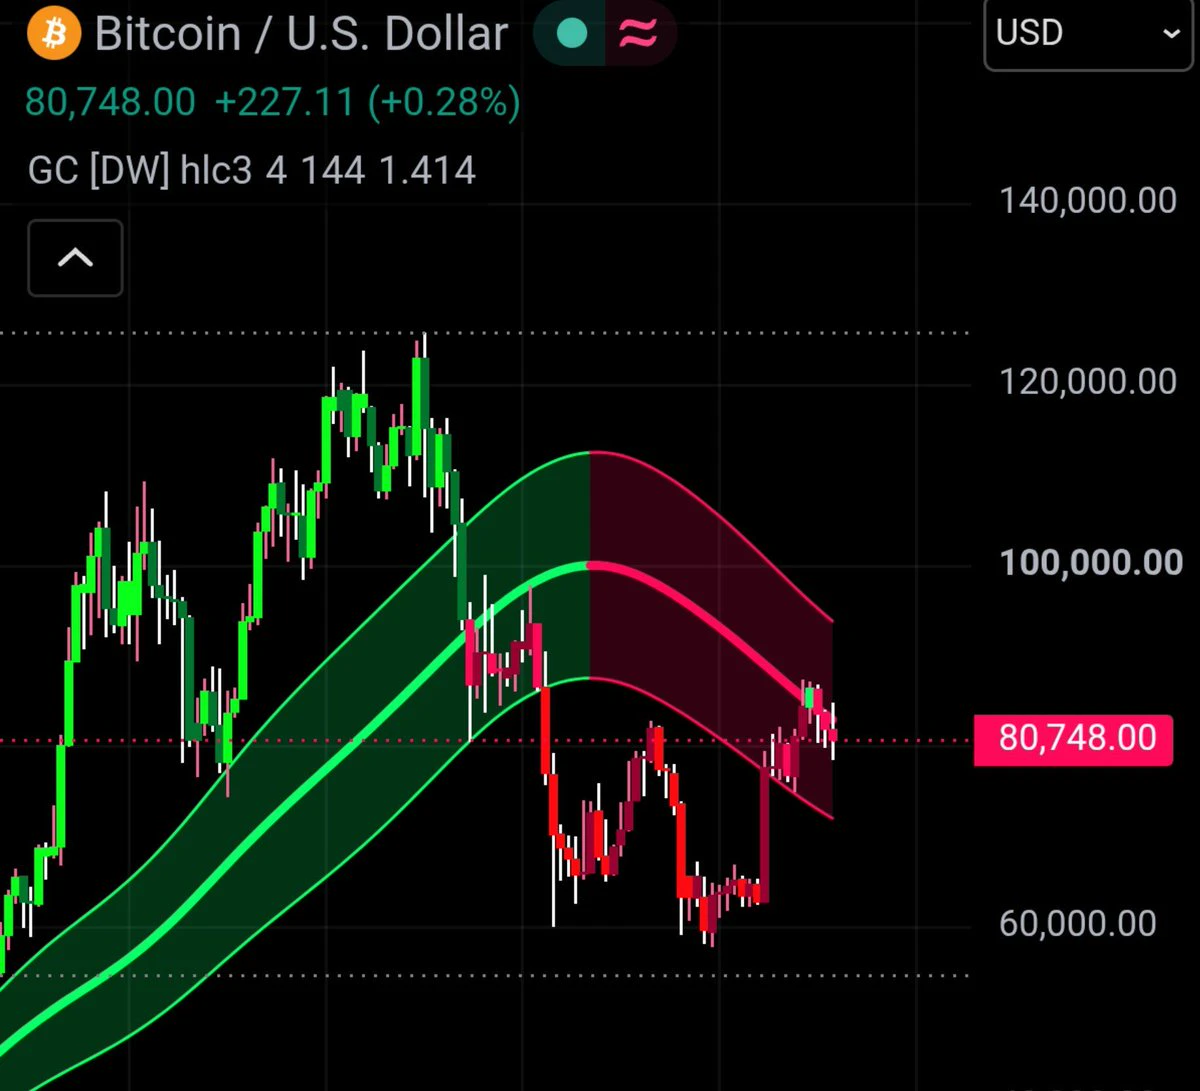
After Bitcoin’s candle close, trading volume has clearly shrunk. If my judgment is correct, this wave of decline will first drop to 80,000, then to 76,000, and finally find support in the 74,000–69,000 range.
Based on my own calculations, there will not be any sudden drop on Monday, Tuesday, Wednesday, or even Thursday. Instead, the price will repeatedly oscillate within the 83,000–84,500 range until all indicators recover to overbought levels, followed by a drop on Friday.
There is CPI data on Wednesday. If it meets expectations, that will be bullish. If the data is higher than before, I will
post-image
BTC+0.87%
#布局本周交易 #每周来晒 The weekend market is usually in a consolidation phase with relatively weak liquidity, making it suitable to focus on “defense + testing the market with light positions” to prepare for next week’s potential trend shift. Combining the current market conditions, fund flows, and macro expectations, the following are the weekend positioning ideas and next week’s market forecast:
I. Weekend Positioning Ideas (Defense-Oriented, Testing the Market with Light Positions)
1. Bitcoin (BTC): Range trading, combining defense with testing long positions
Testing longs at support: BTC has recent
post-image
ThisIsTranslateContent:
#布局本周交易 #每周来晒 The weekend market is usually in a consolidation phase with relatively weak liquidity, making it suitable to focus on “defense + light-position probing” to prepare for a potential market shift next week. Based on current market conditions, capital flows, and macro expectations, the following are weekend positioning ideas and next week’s market forecast:
I. Weekend Positioning Ideas (Defense First, Light-Position Probing)
1. Bitcoin (BTC): Range trading, combining defense with cautious long positions
Long entry at support: BTC has recently been fluctuating narrowly in the $82,000-$83,000 range, while the 50-day moving average (approximately $80,400-$81,000) is an important medium-term support level. If BTC stabilizes after pulling back to $82,300-$82,500, consider cautiously opening a light long position, targeting $83,500, with a strict stop-loss set (such as below $82,000).
Sell into resistance: If BTC rebounds to the $83,000-$83,500 range and encounters resistance, consider partially reducing positions or selling into strength; do not chase the rally.
2. Ethereum (ETH): Weak in the short term; primarily stay on the sidelines
Cautious long entry: ETH has recently underperformed BTC (the ETH/BTC exchange rate hit a new low, while ETF outflows continue), so blindly increasing ETH positions is not recommended in the short term. If ETH stabilizes after pulling back to $2,470-$2,480, consider cautiously opening a light long position, targeting $2,530, with a stop-loss at $2,450.
Stay on the sidelines: If ETH encounters resistance after rebounding above $2,530, wait for a clearer stabilization signal.
3. Altcoins: Trade with light positions and exit quickly, whether for profit or loss. II. Next Week’s Market Forecast (Watch the Macro Market-Shift Window)
1. Market-shift window: Macro data and capital flows
Macro data (key): The US September PPI data will be released next Tuesday (October 14), and the Federal Reserve FOMC meeting minutes will be released next Wednesday (October 15). These two data releases will directly affect market expectations for the Federal Reserve’s rate-hike path and are important windows for a market shift next week.
Capital flows: Continue monitoring the US government’s BTC transfers (if large amounts continue to flow into exchanges, short-term selling pressure may persist) and outflows from ETH ETFs.
2. Market Direction Forecast
Bullish scenario: If macro data (PPI) shows that inflation continues to cool and the FOMC minutes send a dovish signal, short-term market pressure will ease. BTC may hold the $80,400 support level and move upward to test $83,500 or even higher.
Bearish scenario: If macro data rebounds above expectations or government selling pressure continues to intensify, BTC may retest the $80,400 support level. If it breaks below that level decisively, the medium-term trend will need to be reassessed.
Over the weekend, focus on controlling position sizes, maintaining a defensive stance, and probing with light positions. Wait for next week’s macro data to be released before making directional decisions on adding positions.
repost-content-media
BTC+0.85%
ETH+1.11%
$NEAR ‌NEAR USDT - Technical Outlook | Oct 10
NEAR is trading at $5.014with over 5% gain in the last 24 hours.
Highlights on the Chart (4H):
After a sharp pullback to the $4.30level in recent days, a strong recovery has taken place. The price managed to bounce approximately 16% from the bottom.
We are at a technically important level:
Price has moved above MA5 ($4.852)and MA10 ($4.783).Now the MA30 resistance at $5.024is being tested. 4-hour closes above this level could strengthen the momentum.
Levels to Watch:
Resistance: $5.056(24h high) / $5.34/ $5.60Support: $4.85/ $4.63/ $4.30
The Order
post-image
NEAR+12.20%
Starlink | ETH Yesterday’s Trade Idea Review
The levels given yesterday have been hit today!
Yesterday’s ETH outlook was very clear:
Go long at 2480–2490
First target: 2510–2530
Second target: 2540–2560
At the time, ETH was still consolidating around 2500, and market sentiment remained weak.
I didn’t ask everyone to chase the rally. Instead, I laid out the entry observation zone and target ranges in advance.
Early today, ETH reached around 2550 at its high. The first target range was fully hit, and the second target has also entered the observation range!
This is the difference between giving
BTC+0.87%
ETH+1.12%
Market update
live-cover
LIVE1,298
There’s no need to deny $STRK ’s strength, but mistaking overheating for safety is often when sentiment is most expensive.
I’m watching just one divergence: whether there is still support after breaking above 0.12389. The current price is 0.11982, with volume at 0.53x. The 1-hour and 4-hour trends are both strong, with RSI at 61 and 87, respectively.
If volume continues to increase after breaking above 0.12389, the initiative will favor the bulls; if it breaks below 0.10052 and fails to reclaim it, the short-term outlook is invalidated, and the next level to watch shifts to 0.04797.
Don’t rush
post-image
STRK+18.37%
$BTC /weekly — Candle Close 🔥
🚨 Black candle on the weekly close. Short-term bearish on its own.
But this candle is the critical one.
❇️ It completed a retest down into the flipped zone
❇️ The wick digested the orders sitting in that zone
❇️ It closed back above the zone
🟢 That means buyers defended the level and pushed price up. Inverted Head and Shoulders pattern stays intact too.
If momentum keeps going, the uptrend continues 🚀
post-image
BTC+0.85%
Which of these will make you a millionaire?
$SHIB

$PEPE
$LUNC
$LUNA
$CORE
SHIB+1.21%
PEPE+4.58%
LUNC0.00%
LUNA+0.71%
CORE+1.61%
Load More

Join 40 M users in our growing community

⚡️ Join 40 M users in the crypto craze discussion

💬 Engage with your favorite top creators

👍 See what interests you

Trending Topics

GateAtTOKEN2049

41.56k Views21.87k Discussing

Gate brought a series of major events to TOKEN2049 Singapore! From the official launch of Gate Money to the F1 Red Bull driver meet-and-greet and the Gate Gala, we witnessed a new chapter of "One Gate, Borderless Finance." Which moment from TOKEN2049 stood out most to you?

LedgerLossesNear90Million

39.56k Views303 Discussing

GateWCTCS9GlobalTradingCompetition

34.69k Views5.17k Discussing

View More