
Square
Following
Hot
News
Notifications
Profile
Share your thoughts
placeholder
Article
Markets: Latest Update and Technical Analysis ✅️
post-image
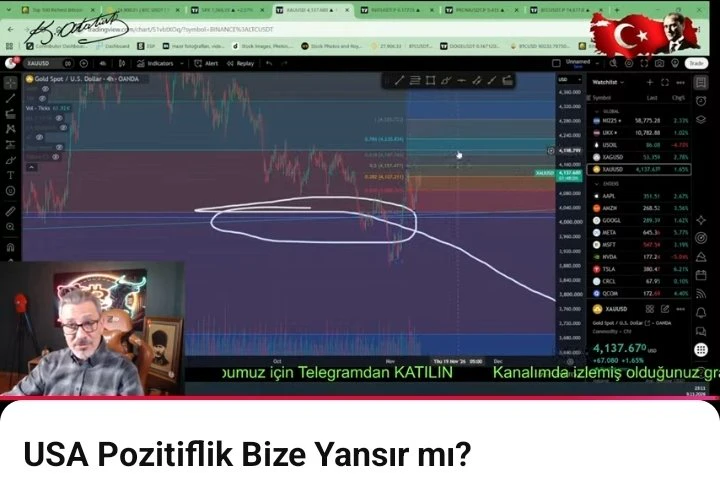
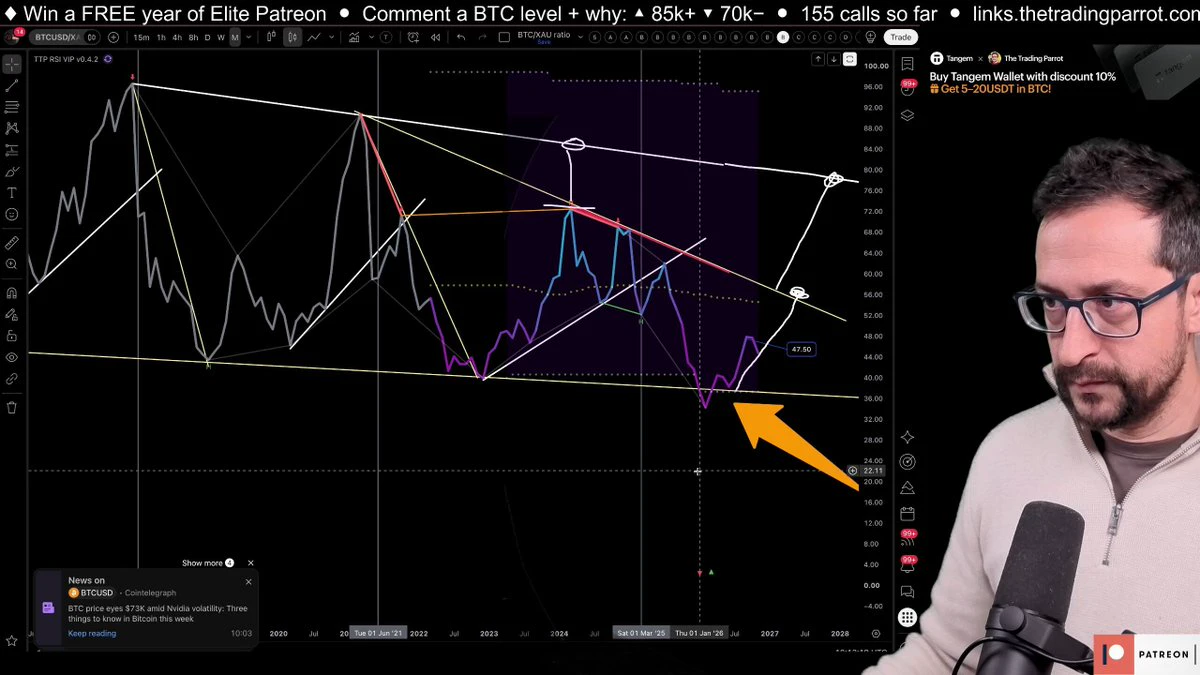
Bitcoin is being squashed by gold. Not just diminishing returns — an acceleration into diminishing returns. The trend line points at 55 RSI and we're only at 48. This changes the entire bull market thesis. See it at 1:23:41.
#Bitcoin #Gold #BTC #Crypto #Trading
post-image
BTC-0.67%
Trenches
牛逼
牛
bade
b
牛逼
0x96...7777
Market Cap
$.
Change
.
24h Vol
$.
Holders
.
STONK
S
bade
b
STONK
6GmA...UNgx
Market Cap
$.
Change
.
24h Vol
$.
Holders
.
BTC
B
bade
b
BTC
C5xp...pump
Market Cap
$.
Change
.
24h Vol
$.
Holders
.
PIEVERSE
P
bade
b
PIEVERSE
0x0e...25a9
Market Cap
$.
Change
.
24h Vol
$.
Holders
.
ON
O
bade
b
ON
0x0e...1d48
Market Cap
$.
Change
.
24h Vol
$.
Holders
.
SOL | Short 🔴 | Bearish | 15-minute 24-hour: -3.25% | Volume: 2024.9M USDT Short rationale: Price below EMA200; EMA20/50/200 are bearishly aligned; RSI14 is 45.8; MACD histogram is negative; ADX14 is 15.9; volume is 0.41 times the 20-candle average; trend pullback/continuation. Entry: 86.49 Stop-loss: 87.1785 Take-profit 1: 85.6294 | Take-profit 2: 85.113 | Take-profit 3: 84.4246 Entry price is for reference only; do not chase trades. The strategy is invalidated if the stop-loss level is hit. Technical analysis only; not investment advice. $SOL $SOL
post-image
SOL-0.77%
$SOXL This plunge clearly hasn't bottomed yet.
Some are crying so hard they could be memes, while others stare blankly at the +18.53% gain—the market is this divided. Don't rush to buy the dip or sell at a loss; first check the volume and buying support. Risk warning: The above is only a personal review record and does not constitute investment advice. Contract trading carries extremely high risks, so please participate with caution.
post-image
SOXL-1.16%
Democrats Sweep Congress: Is a Major Shift Coming for Crypto? Tighter SEC Oversight and Prediction M
live-cover
LIVE65
$HYPE Currently at 74.8, down 2.92% over 24 hours. The 1H trend is weak, with RSI at 54.12, a moving average at 74.81, and resistance at 76.87; the 4H trend is weaker, with RSI at 36.03, a moving average at 76.76, and resistance at 79.68. The 1H structure is weaker than the 4H structure, with price trading below the short-term moving average. The weak 1H trend indicates that selling pressure remains dominant. RSI at 54.12 is still well below overbought territory, and the short-term moving average is acting as resistance. Lower 4H indicators point to bearish market sentiment, and price may cont
post-image
HYPE+0.24%
Bang bang bang 💰$SIGN The third target has been reached at 0.008900. Keep a close eye on it, lock in profits, congratulations 🎉🤑💰👇
post-image
SIGN-2.90%
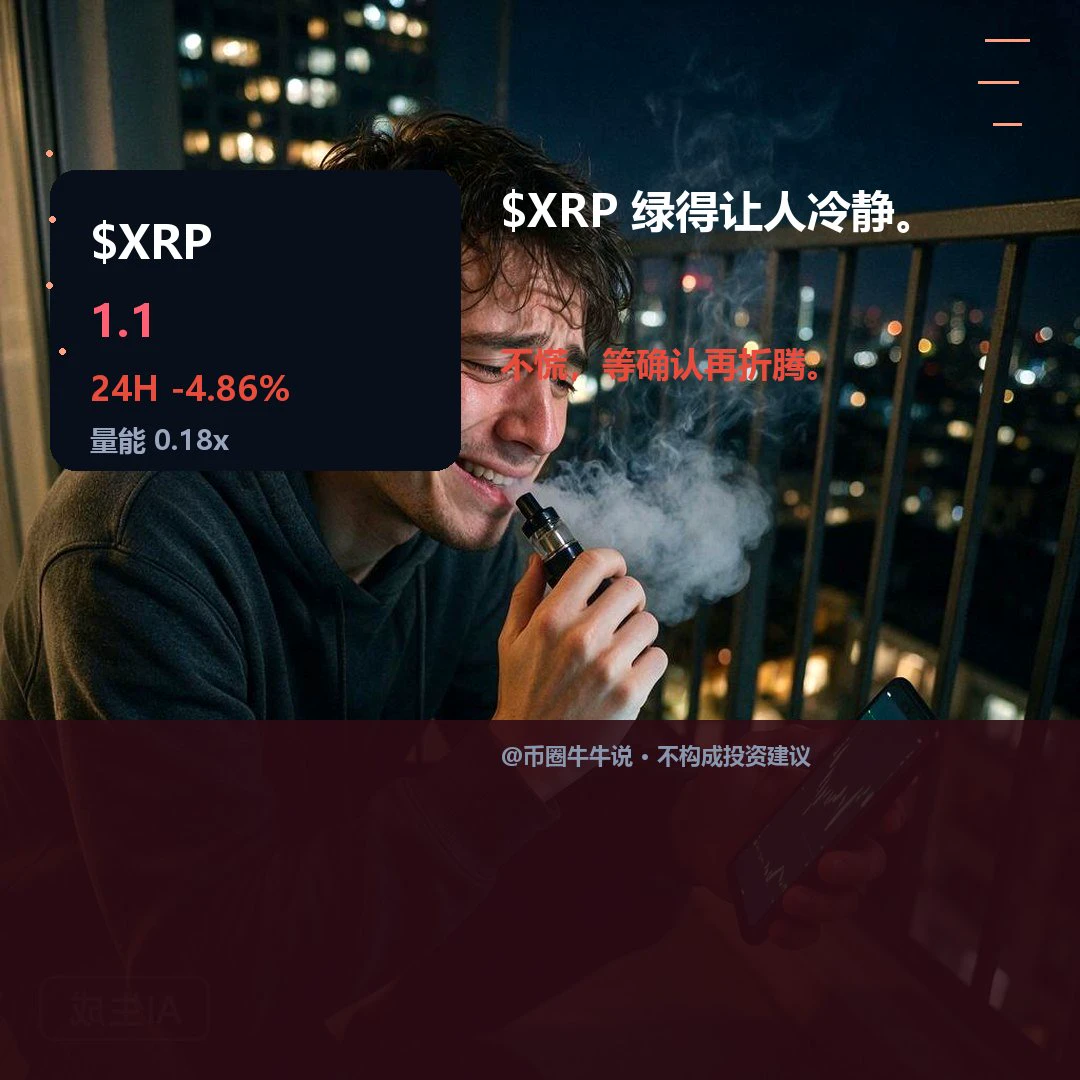
$XRP Currently at 1.0957, down 4.86% over 24H. The 1H and 4H charts are both weak; the 4H RSI is oversold, and moving averages are acting as resistance. Volume is only 0.18x. Holding above 1.1542 could signal a rebound; a break below 1.0764 would indicate further weakness. In review, watch for a failed hold above 1.1542 and a reclaim of 1.0764, with volume confirmation. Market volatility is high; for observation only.
post-image
XRP-1.15%
$INIT Just detected a whale address (0x7a3…f9c) withdrawing 4.2 million INIT from Gate, worth about $654k. WhaleAlerts also flagged it as a “large outflow.” Glassnode shows the number of addresses holding over 1 million has increased by 3 in the past 24 hours. Current price: 0.1558, up 28.88% in 24 hours; high: 0.1570; low: 0.1174; trading volume: 46.7M—the volume is keeping pace, but hasn’t exploded, making this a healthy push higher.
Strategy: Accumulate in batches on a pullback to the 0.142–0.148 range (a 50% retracement of today’s gains), keeping the position below 15% of total capital; se
INIT-2.53%
  • 1
With nonfarm payrolls this hot, Friday’s bullish candle wasn’t for nothing—the labor market hasn’t cracked, so rate-cut expectations have to be pushed back. This stock-market pullback is probably just a routine dip within that 8/34, not the start of a bear market. CPI will settle it on Tuesday. Save this call and come back tomorrow to check.
post-image
Analysis crypto coin
live-cover
LIVE2,239
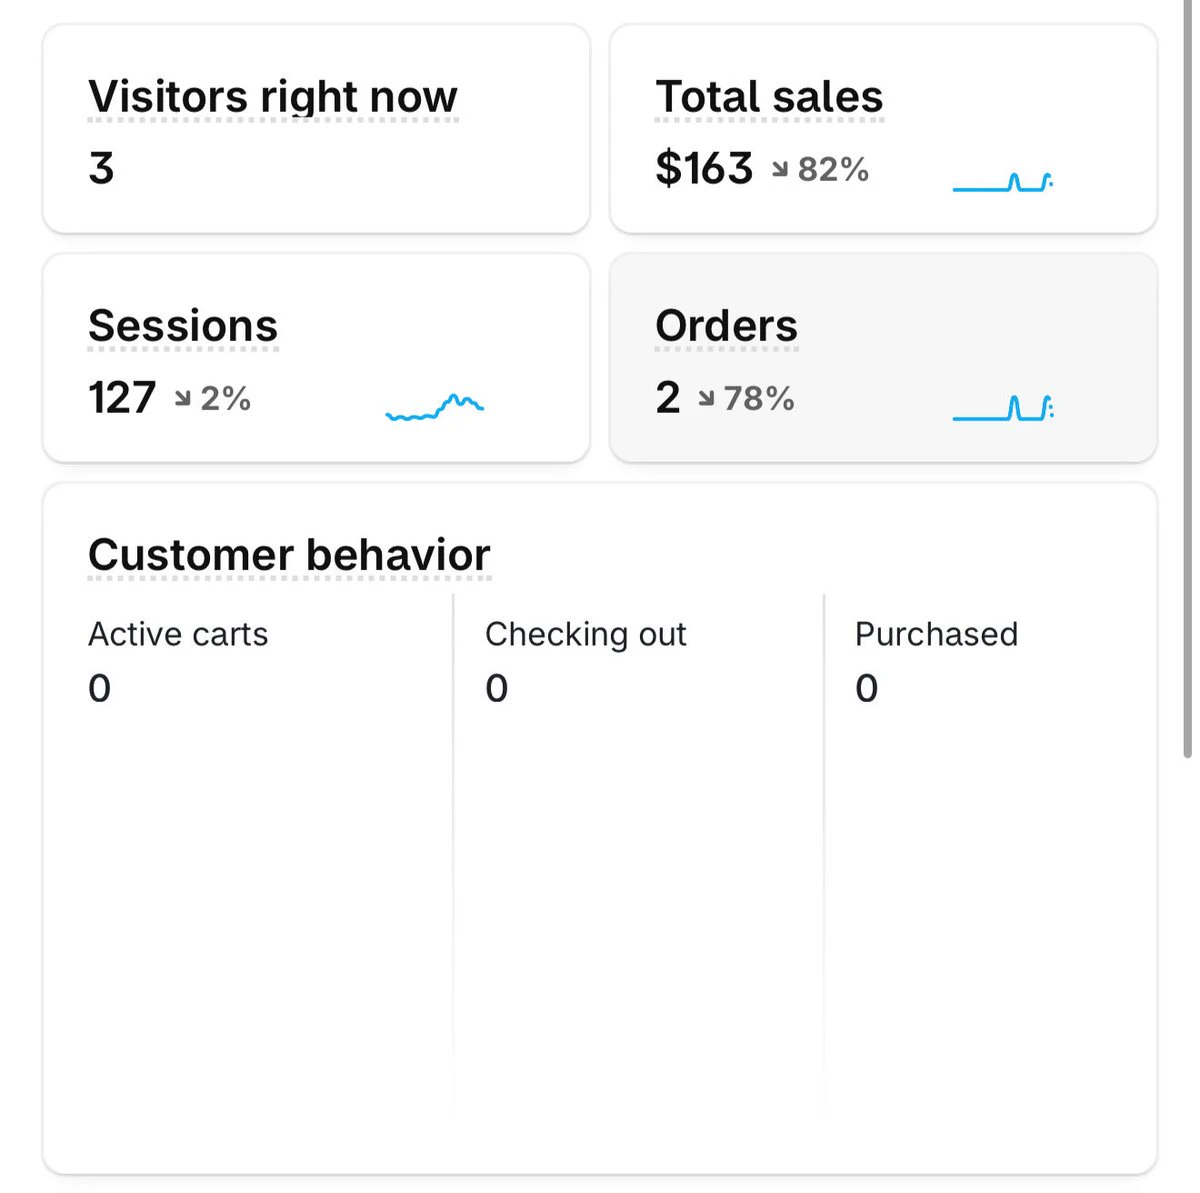
Not at all days a great but consistently pushing forwards is key
So far breaking even on ad spend and it’s only 3:00 pm so we have time for an evening rush 🤞
post-image
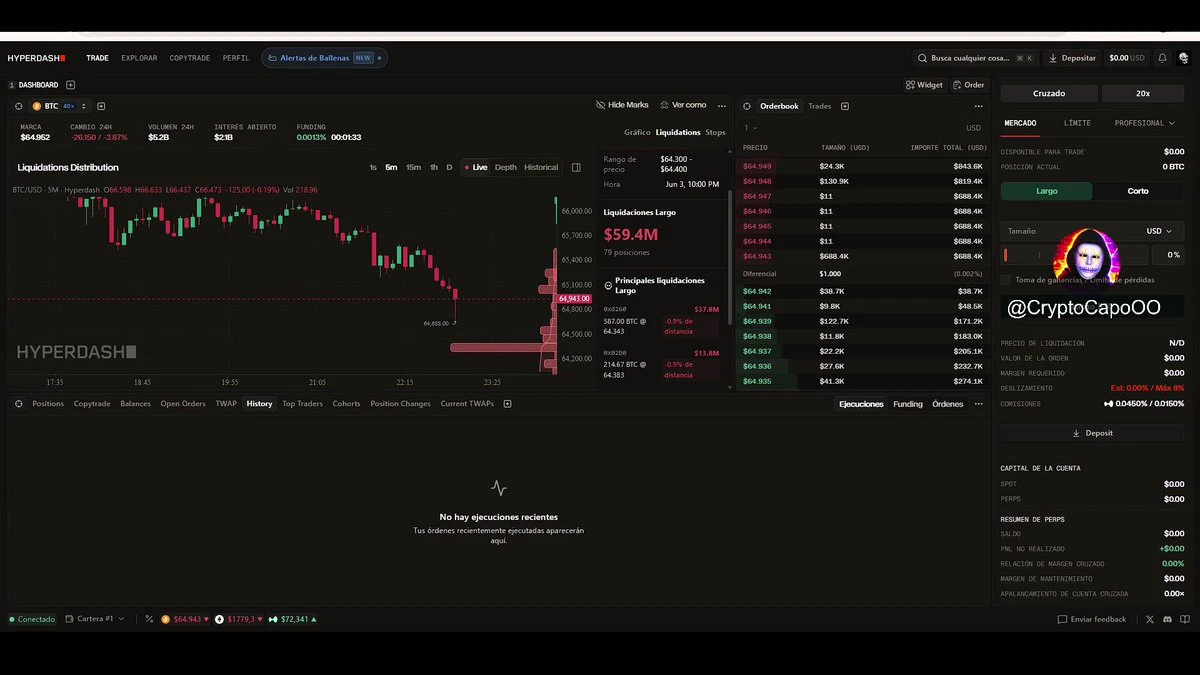
Market-wide 24-hour liquidations hit $1.16 billion. The entire market is panicking: massive liquidations, weakening price action, and continued bearishness. Concentrated mass liquidations have always marked the end of a downturn, not the beginning. This wave of billion-plus liquidations wiped out almost entirely leveraged retail longs. It flushed out in one fell swoop all those stubbornly holding positions, trapped holders, and floating sell pressure. Short momentum has been fully exhausted, and all the market’s unstable holdings have been cleared out. A slow bleed is the most frightening; a h
post-image
BTC-0.65%
Hot take: the Nasdaq correction was healthy
$Q is about 14% off its high & everybody’s acting like the world is ending
But a few weeks ago Q was trading above fair value. The market was hot. That’s why I had bonds & an overall more conservative portfolio allocation.
Now Q is basically sitting at fair value
Not every dip is a table pounder buy. A drop from overvalued back to fair value is just the market fixing itself
But once a great index or company gets to fair value or below, THAT’S when I want to allocate. Shares, 1+ year portfolio secured puts, LEAP calls when I’m ultra bullish... ratios
NDAQ+1.29%
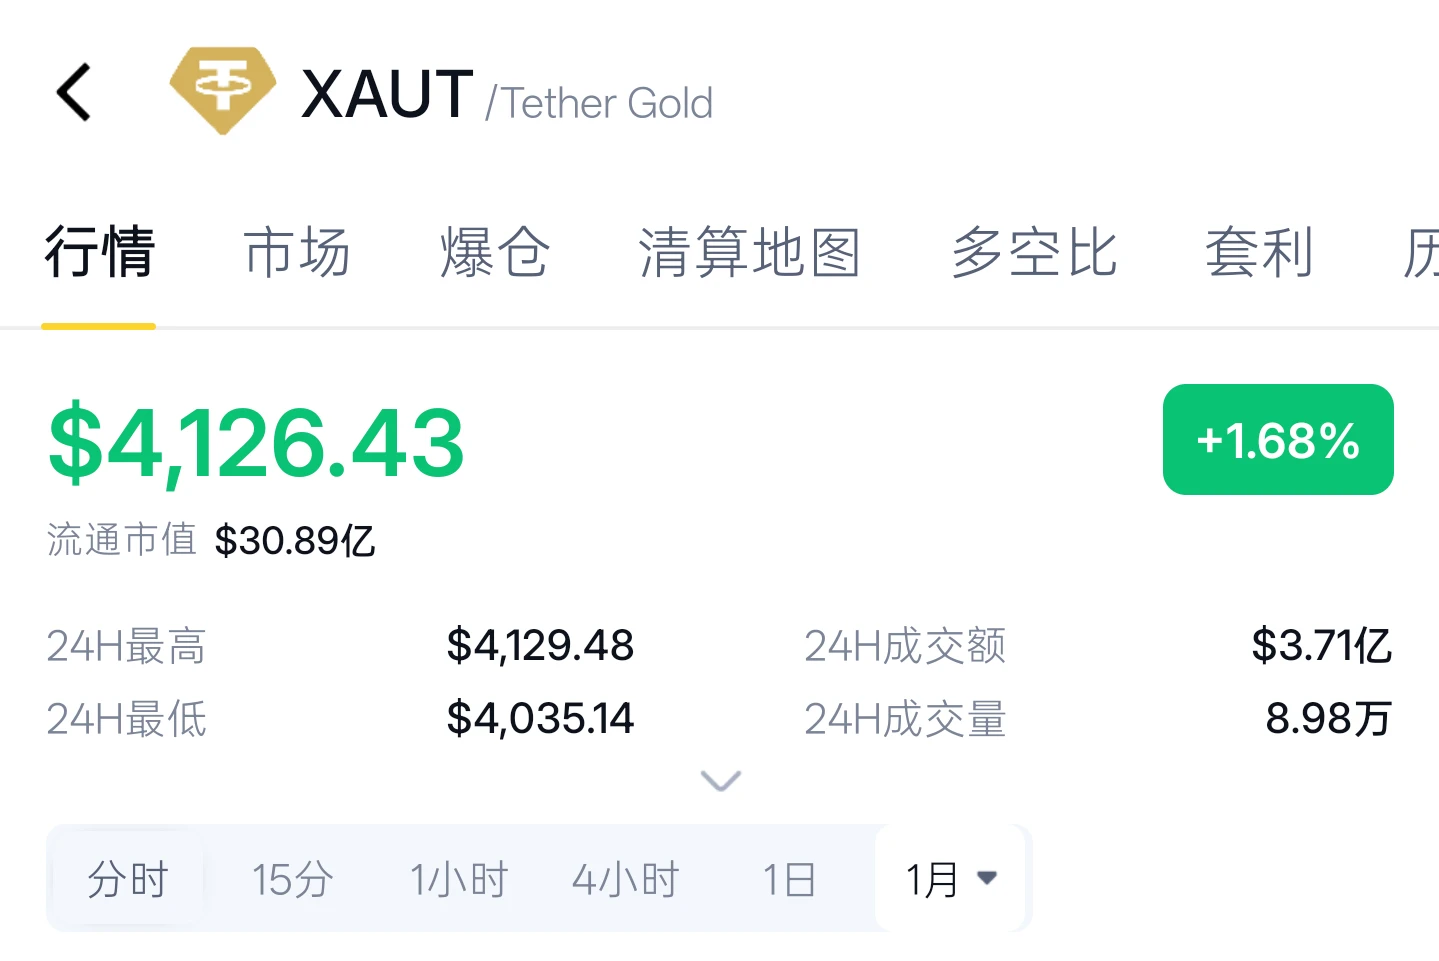
Gold prices back above 4100! Double-top resistance at 4133–4147, with rising risk of a spike and pullback!

Gold rebounded from its low in the early hours today, returning above the 4100 mark: after rallying from a low near 4055, it climbed back above the key 4100 level and reached the 4133 high area (touching 4143 based on New York gold prices). It is currently trading near 4108, up approximately 0.7%–1.1% on the day. Overall, the market is showing a “rebound from lows, repeated range-bound swings” pattern, with bulls and bears battling back and forth between 4100 and 4145, while the directio
post-image
GLDX-0.40%
PAXG+0.37%
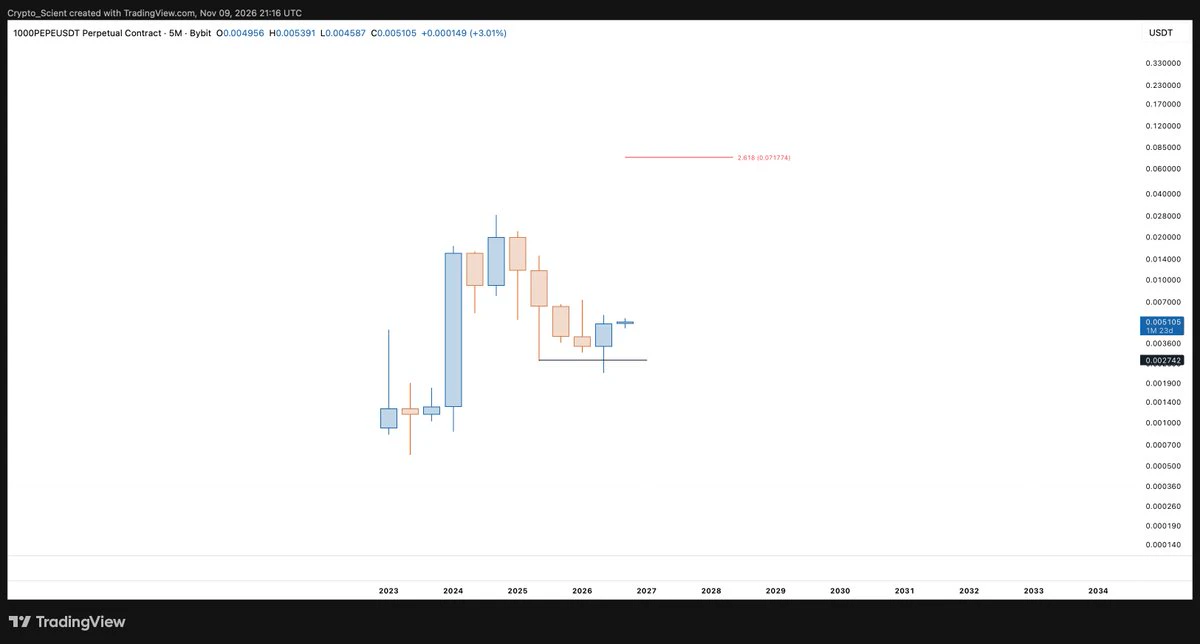
$PEPE , Amidst chaotic charts across the board among altcoins, this one is look very beautiful on macro.
post-image
PEPE+0.97%
The funding rate has been positive for three straight days, which means longs in perpetual futures are paying shorts. I know this setup all too well—from when I was selling options for premium last year. Back then, I liked this kind of structure: selling options meant earning time value and volatility premium, and the more crowded the market and the more bullish the sentiment, the fatter the premiums. A funding rate that stays positive is essentially the same kind of signal: long positions in the futures market are too crowded, pushing up the cost of holding them. Under the usual mechanics of
post-image
US500+2.37%
NAS100+3.37%
NVDA-4.34%
GOOGL+1.21%
MCD+1.83%
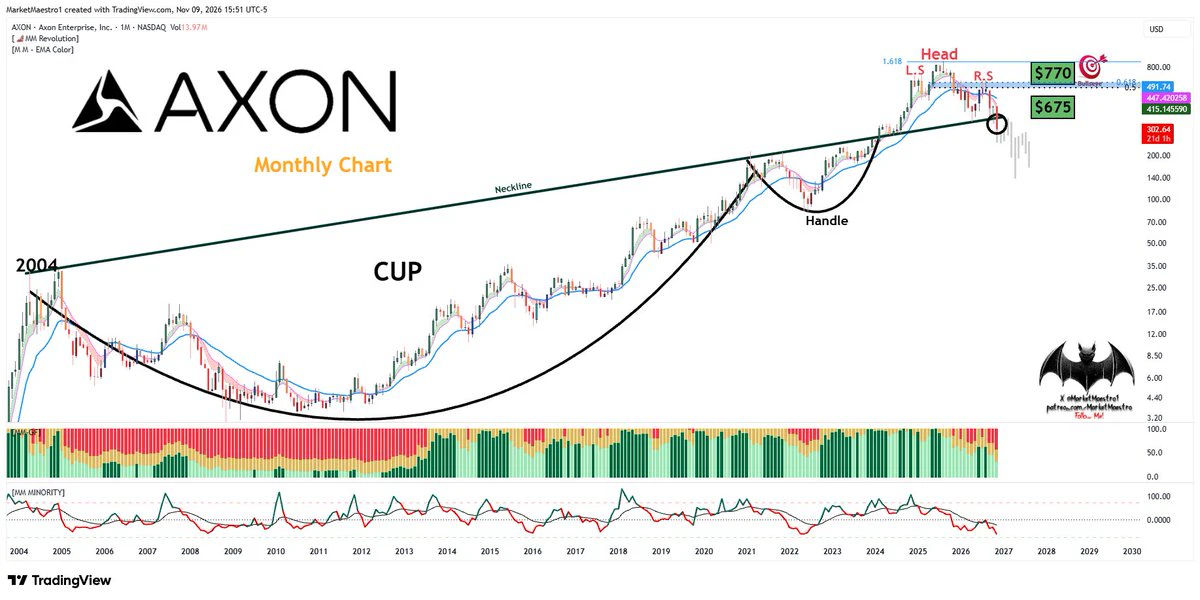
$AXON
I still feel the same way. It made a risky break to the downside after the H+S
post-image
AXON-3.17%
Everyone, I'm opening a long position here, $TAG ‼️ Strong bullish momentum. Entry price: $0.0007500 – $0.0007600 Target price: $0.0007800 / $0.0008000 / $0.0008200 Stop loss: $0.0007350
post-image
TAG-8.18%
Load More

Join 40 M users in our growing community

⚡️ Join 40 M users in the crypto craze discussion

💬 Engage with your favorite top creators

👍 See what interests you

Trending Topics

USCPIDataIncoming

43.74k Views2.03k Discussing

The U.S. October CPI report will be released on November 10 at 8:30 a.m. ET. September CPI came in at 3.7% year over year, and markets will be watching closely for signs that inflation is cooling, especially in core CPI. A softer-than-expected reading could strengthen rate-cut expectations, while hotter inflation may pressure risk assets through higher Treasury yields and a stronger dollar. How do you think this CPI print will move $BTC, U.S. stocks and gold?

RedBullDoublePodiumInBrazil

9.63k Views30.59k Discussing

BTCFlashCrash

211.14k Views66.6k Discussing

View More