Share your thoughts
placeholder
Article
$RLC #Rlc Breaking Out, Expecting 2x Rally Upon Successful breakout
RLC+13.03%
pepe al time high güle ath pump pump pump big pump let’s go
post-image
PEPE+6.68%
Morning Market updates
live-cover
LIVE2,229
#StandardCharteredSeesARBAt10By2030
ARB just got one of the most aggressive long-term calls in the market.
Standard Chartered has initiated coverage on Arbitrum and set a $10 target for the end of 2030. At the time of the report, ARB was around $0.13–$0.14, so the bank's target represented roughly 70x from that level. The bank's path was $0.50 for 2026, $1.50 for 2027, $3.50 for 2028, $6.50 for 2029 and $10 by 2030.
But I don't look at a 70x target and immediately think “ARB is going to $10.”
I look at what has to happen for that valuation to make sense.
And this is where the Arbitrum story b
post-image
ARB+0.99%
  • 4
Everyone is sleeping on SYMBOL while this 4h trend screams otherwise.

$HYPE /USDT - LONG

Trade Plan:
Entry: 90.72 – 91.22
SL: 88.60
TP1: 92.75
TP2: 93.94
TP3: 95.71

Why this setup?
Why now? Because the daily trend is firmly bullish, giving the long bias a strong structural foundation backed by a 95 confidence reading. The 15m RSI sitting at 48.12 means momentum is neutral-to-slightly-soft, so you are not chasing an overbought extension. The 1h ATR at 0.988399 tells you average hourly volatility is wide enough to let winners breathe on the way to TP1 at 92.75 and TP2 at 93.94. The entry z
HYPE-1.05%
#StandardCharteredSeesARBAt10By2030
ARB just got one of the most aggressive long-term calls in the market.
Standard Chartered has initiated coverage on Arbitrum and set a $10 target for the end of 2030. At the time of the report, ARB was around $0.13–$0.14, so the bank's target represented roughly 70x from that level. The bank's path was $0.50 for 2026, $1.50 for 2027, $3.50 for 2028, $6.50 for 2029 and $10 by 2030.
But I don't look at a 70x target and immediately think “ARB is going to $10.”
I look at what has to happen for that valuation to make sense.
And this is where the Arbitrum story b
post-image
ARB+1.03%
  • 8
#GateTopsStockPerpetualCoverage Tops Stock Perpetual Coverage
Gate is expanding its trading ecosystem with broader coverage of stock perpetual contracts, giving traders more opportunities to explore traditional market exposure through the crypto trading environment.
The global financial market is evolving rapidly, and the connection between traditional assets and blockchain-based trading is becoming increasingly important. Stock perpetual contracts offer traders a way to follow the price movements of popular stocks without directly holding the underlying shares. This creates a different approa
  • 5
🟩 Ethereum officially recorded the best third quarter in its history, with a rise of +67.89% in Q3 2026.
According to CoinGlass data, ETH thus surpassed its previous record for this period of the year, set in 2025 at +66.55%, as well as 2020 at +59.5%.
The contrast with the beginning of the year is huge, as Ethereum ended Q1 at -29.26% and then Q2 at -25.28%.
post-image
ETH-1.98%
Hawk is telling you: do you know why you keep losing money trading so many coins?❓️
post-image
Hawk
Hawk
Gate.Fun
MC:$2.56KHolders:2
0%
One of these already ran without you. The other three are still quiet.
Which one will you wish you had looked at six months from now?
Two different bets on the table this month.
The privacy trade:
$ZEC
The decentralised AI trade:
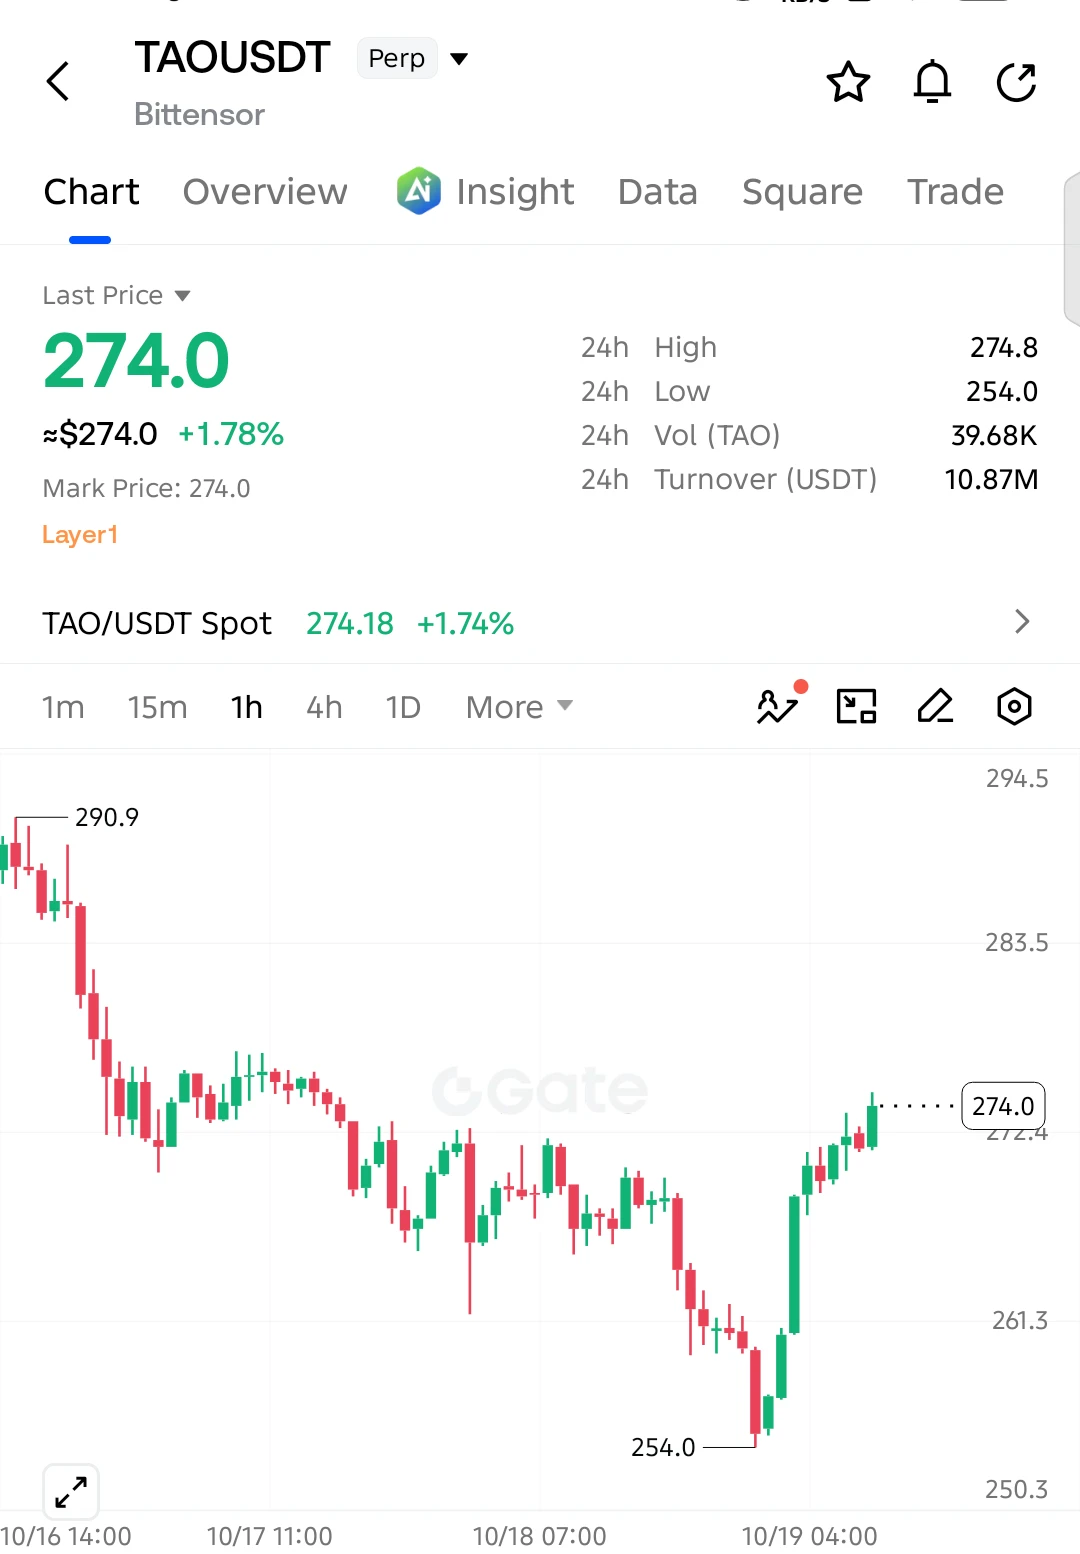
$TAO $RENDER $QUBIC
$ZEC already moved, because an ETF and money-flow story hit and traders piled in.
$TAO, $RENDER and $QUBIC move slower, as real usage and demand for compute show up on-chain.
One already ran. The other is still building.
Are you buying what already happened, or what is about to?
post-image
ZEC-6.07%
TAO-0.02%
RENDER-1.44%
QUBIC-1.32%
Watching the charts nonstop gets exhausting; turning them off actually makes things clearer. Once my eyes stop staring at them, my heart stops panicking too. Panic comes from having no plan, and losses come from overthinking.

While the market was grinding out a bottom, I watched $ETHFI . After it pulled back and held firm, buying strengthened. I judged it wasn’t a bull trap and said it could be bought in batches.

It then pushed all the way to 0.7087, up 3410.18% from 0.4789. That felt incredible—the earlier action was truly sluggish, but the result was truly rewarding.

Take 80% in profits
post-image
ETHFI-3.28%
SNDK-0.77%
ADA-1.69%
$COTI Conclusion first: bearish in the short term; rebounds are opportunities to reduce positions, not signals to buy the dip. The recommended position size is no more than 5% of total capital, and you must exit if support breaks.
Volatility is currently the primary risk. COTI's amplitude over the latest 30 candlesticks is approximately 16.05%, the highest among the three candidate tokens, while its 24h trading volume is only 8.2M USDT. Thin liquidity means the same selling pressure will produce a deeper decline, with slippage and wick risks increasing simultaneously. The Greed Index is 71, a
post-image
COTI-8.35%
DOT-3.57%
APT+0.27%
🔹 HYPE continued its upward trend, hitting a new high of $94.49.
live-cover
LIVE1,577
MSTR leads the Nasdaq-100, and Bitcoin proxy trading is hot again
Risk-asset sentiment in U.S. stocks has clearly recovered recently, tech stocks have become active again, and MSTR's performance has been particularly eye-catching. As the market's familiar “high-beta Bitcoin stock,” MSTR has always been highly correlated with BTC. Strategy's latest disclosure shows that as of September 13, the company held approximately 845,000 BTC, with a cumulative cost of about $63.73 billion.
This is also MSTR's biggest market label: on the surface, it is a U.S.-listed company, but in reality it also has ve
MSTR+16.35%
BTC-0.66%
NAS100-0.25%
  • 37
$ENA Conclusion first: this +11.45% surge should for now be considered merely an oversold rebound, not a trend reversal; the risk of chasing higher is greater than the opportunity.
To determine whether the trend is healthy using moving averages, you only need to look at two points: the relative position of the price and moving averages, and whether the short-term moving average has crossed above the long-term moving average. Currently, MA5=0.19608 remains below MA20=0.20051, with the moving averages in a bearish alignment, indicating that medium-term costs are still suppressing the price and t
post-image
ASTER-4.32%
$SOXL LONG SETUP | 1H
Price is returning to the entry zone, while the broader bias remains bullish. Entry zone: 119.26–119.42 Stop-loss: 118.83 Targets: TP1 121.03 (3.31R) / TP2 122.15 (5.51R) / TP3 124.47 (10.06R) Partial take-profit: 20% / 30% / 50% Notes: The 15-minute entry confirmation is not yet complete; price has moved away from the planned entry level, so a retest may be required. Status: Watch only—do not consider this setup before confirmation.
post-image
SOXL+7.60%
#MSTRTopsNasdaq100
MSTR is moving much faster than Bitcoin right now, and that is exactly why I think this rally deserves a closer look.
Strategy jumped roughly 16% on September 18 and closed around $MSTR while Bitcoin reclaimed the $80Karea. Crypto-linked equities moved sharply higher as BTC recovered, but MSTR amplified the move much more aggressively. That tells me traders are not only buying Bitcoin exposure — they are also buying the higher-beta version of the Bitcoin treasury story.
The foundation of this story is still Strategy’s Bitcoin treasury. As of September 13, the company held ap
post-image
MSTR+16.51%
SNDK+11.05%
MU+3.80%
Market Alert

$SNDK /USDT - SHORT

Trade Plan:
Entry: 1760.1 – 1764.3
SL: 1782.5
TP1: 1747.0
TP2: 1736.8
TP3: 1721.6

Why this setup?
Technical setup found.

Debate:
Thoughts?

⚠️ Personal market analysis only. NFA — manage risk and DYOR.
Educational content, not investment advice or a recommendation to buy, sell, deposit, or withdraw any asset. No paid promotion or referral/affiliate links.
SNDK-0.77%
Load More

Join 40 M users in our growing community

⚡️ Join 40 M users in the crypto craze discussion

💬 Engage with your favorite top creators

👍 See what interests you

Trending Topics

MSTRTopsNasdaq100

72.46k Views2.65k Discussing

Strategy (MSTR) has gained about 48% over the past month, making it the best-performing stock in the Nasdaq 100, while Bitcoin rose roughly 12% over the same period. The company holds 845,050 BTC with a cumulative cost basis of about $63.73B. MSTR is not a pure Bitcoin proxy — its price swings can be more extreme. Can this rally last?

Gate Tops 24H Net Inflows Among Exchanges

26.19k Views3.67k Discussing

BTCRetakes80K

56.17k Views59.89k Discussing

View More