
Square
Following
Hot
News
Notifications
Profile
Share your thoughts
placeholder
Article
$NESS It can't go up much higher anymore... the difference is enormous... a total loss... finally sold at auction😭😭😭
post-image
NESS+1.99%
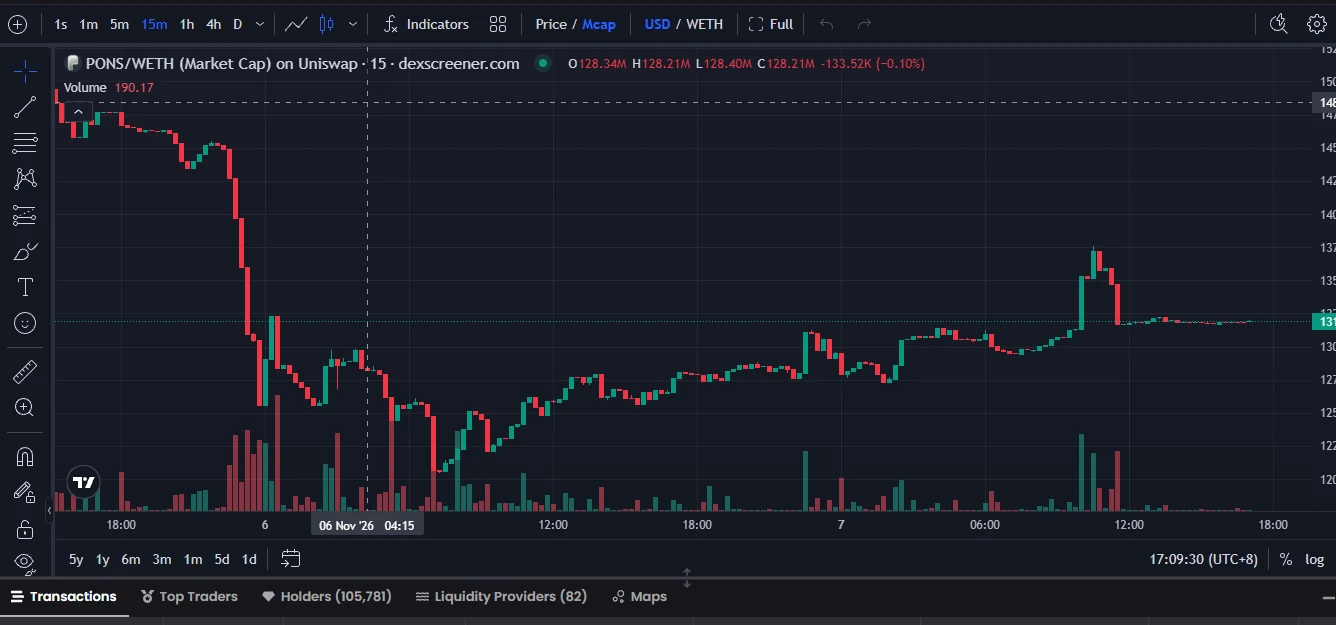
PONS is now at 0.1966. Dachao added to his position at the 0.178 wick the day before yesterday and is already up more than 10%. It also briefly topped 0.2 today.
The day before yesterday, he said he’d cut one of his balls if it couldn’t rise. It’s been climbing these past two days and hasn’t dropped back to 0.18. Dachao’s balls are safe for now.
Everyone who needed to sell did so on the day of the wick. There’s solid support below now; it won’t budge downward, so we’re just waiting for it to move up.
The leading launchpad on the Robinhood chain. All the tokens are in circulation, with no locke
post-image
PONS+4.32%
Trenches
ZIG
Z
bade
b
ZIG
0x8c...1145
Market Cap
$.
Change
.
24h Vol
$.
Holders
.
BTC
B
bade
b
BTC
C5xp...pump
Market Cap
$.
Change
.
24h Vol
$.
Holders
.
Diamond
D
bade
b
Diamond
5VCE...pump
Market Cap
$.
Change
.
24h Vol
$.
Holders
.
DOGE
D
bade
b
DOGE
DoGE...fm7R
Market Cap
$.
Change
.
24h Vol
$.
Holders
.
STONK
S
bade
b
STONK
6GmA...UNgx
Market Cap
$.
Change
.
24h Vol
$.
Holders
.
$BIRB Down 21% in one day—those who chased at 0.1235 must be turning green now, right? Current price: 0.0953; 24h low: 0.0930; trading volume: 124M. This is a high-volume decline—not a shakeout, but a panic sell-off.
Let’s be blunt about the technicals: 0.0930 is the last line of defense today and the only support worth watching in the short term. Price has been hammered down from 0.1235 with almost no meaningful rebound along the way—a classic high-volume breakdown pattern. At 0.0953, it’s only 2% above the low, effectively “grinding right on support.” From here, there are only two paths: eit
BIRB-16.68%
MACD is a commonly used trend indicator in cryptocurrency trading, and many people treat a golden cross as a buy signal. But in actual trading, an MACD golden cross does not always mean the trend will rise; it may even be a buy trap.
This usually happens for the following reasons:
First, during a downtrend. In a strong downtrend, prices may see a brief rebound and MACD may form a golden cross, but this is often just a corrective bounce and does not mean the trend has reversed.
Second, in a sideways market. When the market lacks a clear direction, MACD can frequently produce golden crosses and
post-image
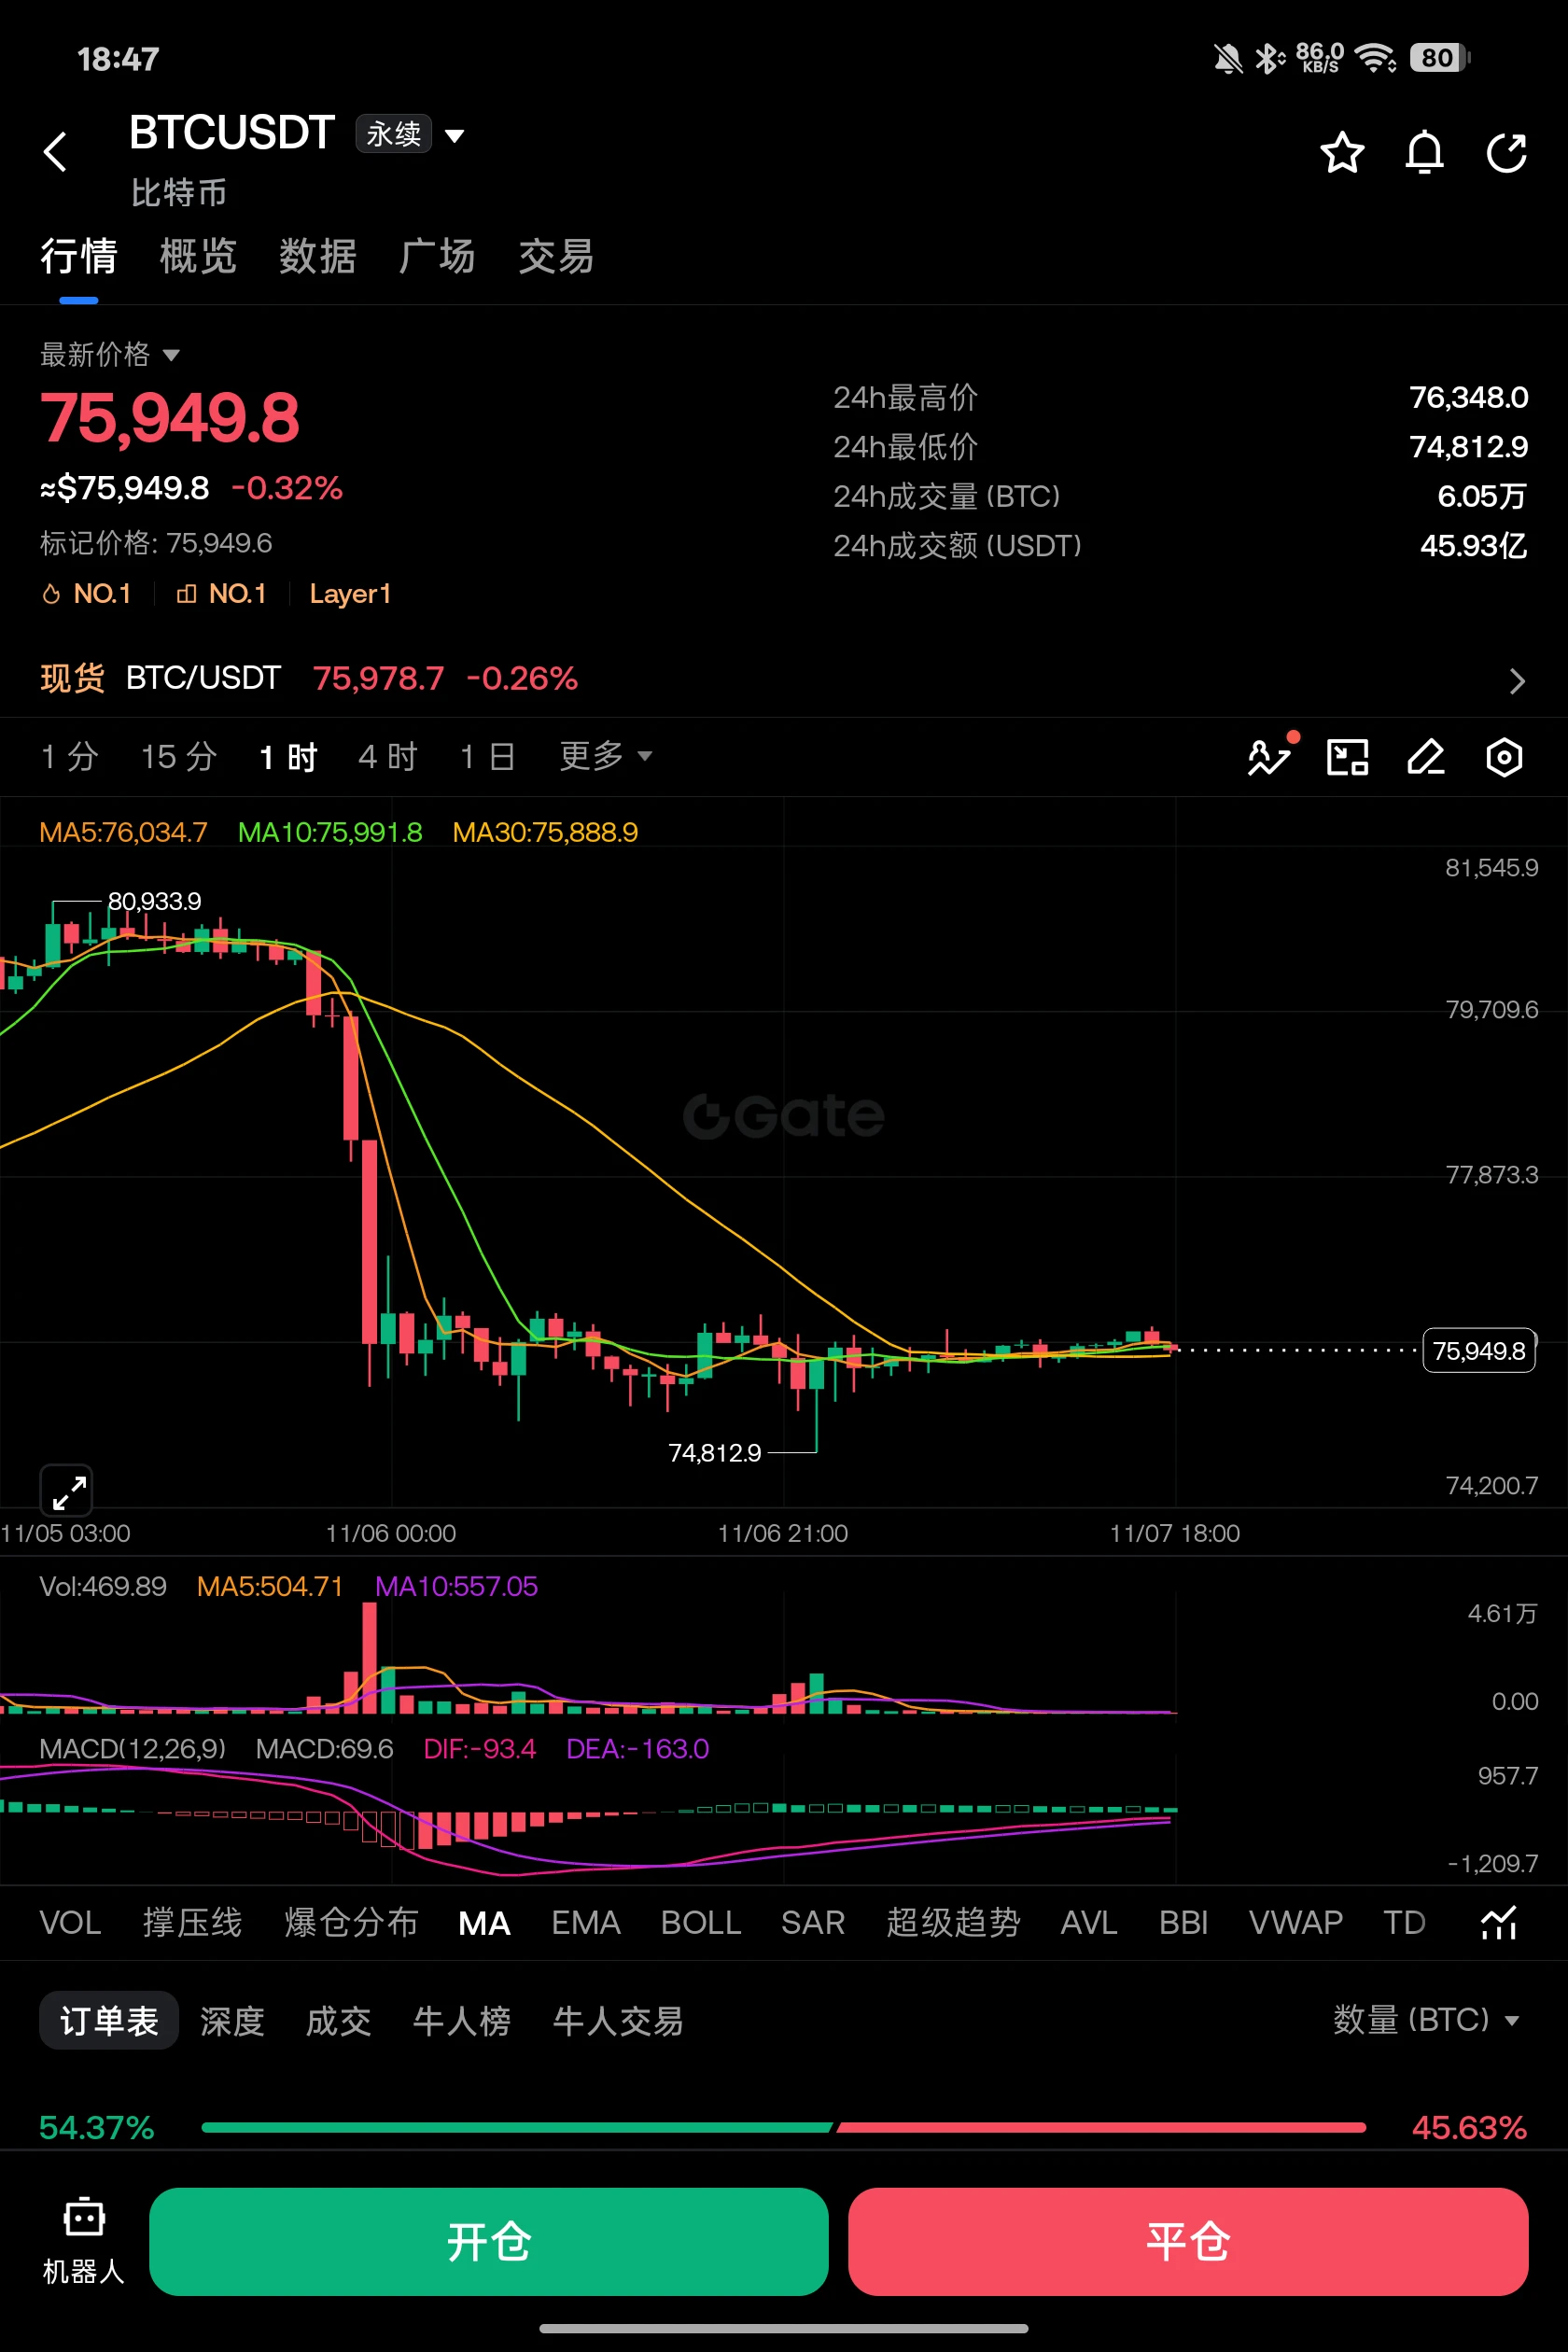
My $BTC short trade plan! New entry: $76,650 Stop loss: $77,075 Take profit: 73,850🚨 I’m waiting for the price to slowly rise to my confirmed entry zone. If the price breaks through this level with a strong candle, I’ll cancel the trade.
post-image
It’s the start of winter, and the market is pretty cold too. I thought I’d cheer myself up by eating something nice.
But after the crabs 🦀 arrived home, just like my holdings, 9 of the 10 crabs in the picture had already died, and only one was barely alive.
I steamed the barely-alive one and threw the rest away... The same goes for trash assets: toss them when you should, and cut your losses in time.
#大闸蟹 #立冬はレティの日 #BTC
post-image
BTC-0.67%
The final rule allowing alternative investments such as crypto assets to be included in 401(k) retir
live-cover
LIVE1,248
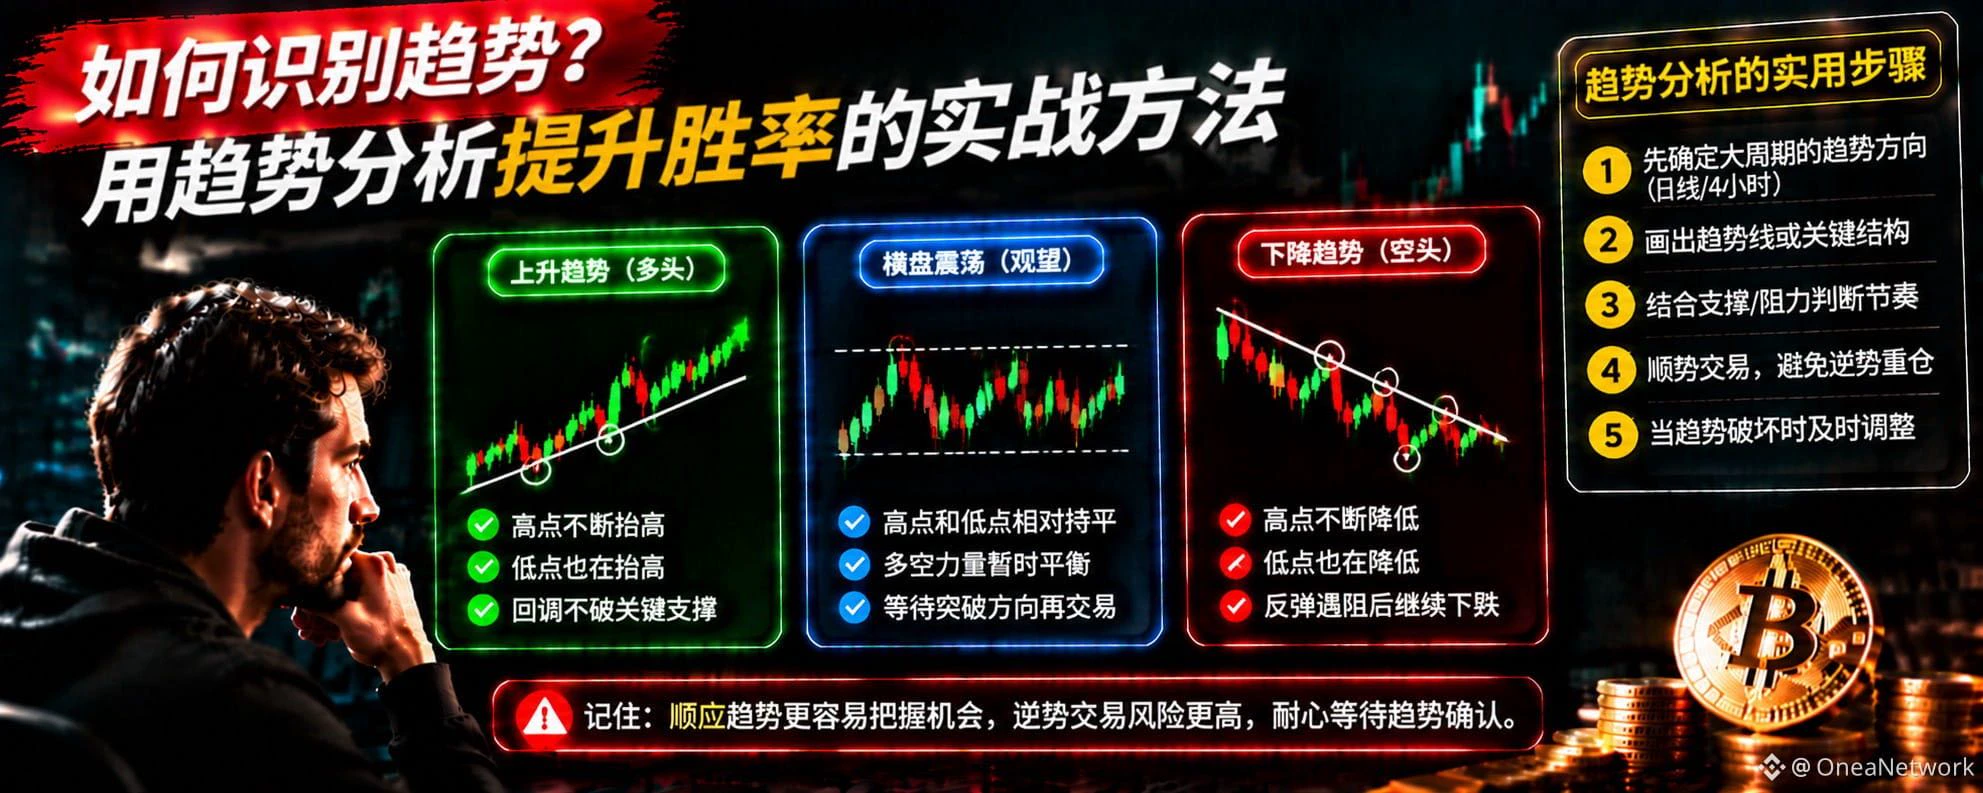
How to Find Support and Resistance Levels: Practical Ways to Identify Key BTC Buying and Selling Zones
In BTC trading, many people study candlestick charts every day but often run into the same question: At what price might resistance appear? At what price might support emerge?
In fact, support and resistance levels are essential tools in technical analysis.
First, look at historical highs and lows. If BTC has repeatedly stopped falling and rebounded in a certain price area, that area may form support. Conversely, if the price has repeatedly pulled back after rising to a certain level, that ar
post-image
BTC-0.67%
☀️ GM! The market suddenly hit the brakes—what signal will tonight’s nonfarm report flash? 🚦
The Nasdaq plunged 5.52% last night, while BTC pulled back to around $76K . The U.S. nonfarm payrolls report is due out tonight at 21:30. 👀

📌 Today’s featured topic: How will you adjust your trading strategy ahead of the nonfarm report?
🔴 Risk watch: Will U.S. stocks and BTC remain under pressure?
🟡 Waiting for confirmation: What changes could the nonfarm report bring?
🟢 Looking for opportunities: Are there any assets worth watching in this pullback?

🎁 Come share your nonfarm predictions and t
NDAQ+0.28%
BTC-0.67%
  • 6
When trading BTC, many people see a long upper wick on a candlestick chart and assume the market is about to fall. But does a long upper wick really mean a trend reversal?
Actually, not necessarily.
A long upper wick usually indicates that the price encountered selling pressure while rising. Buyers tried to push the price higher, but sellers stepped in at higher levels, and the price eventually pulled back from its high.
When assessing a long upper wick, focus on three aspects.
First, its location. If a long upper wick appears near an important previous resistance level, it may indicate strong
post-image
BTC-0.67%
This is the salary in the English-speaking market. Too bad the Chinese-speaking market will never reach these heights.
post-image
$MAGMA I caused this -17.67% bearish candle. Stop guessing—the market maker’s playbook has just four steps: pump, distribute, dump, buy back. During that 24h high of 0.3464, I placed sell orders worth over 30 million above 0.34. Retail FOMO buyers rushed in to catch the falling knife, and trading volume instantly hit 26.3M—if you want the details, I sold 70% of my position during that 80,000-point drop from 0.3464 to 0.2640, leaving the remaining 30% with bids around 0.28 to create the “illusion of support.” The price is now 0.2816, just a small push away from my next accumulation zone of 0.24
MAGMA-0.57%
BTC Update
live-cover
LIVE1,897
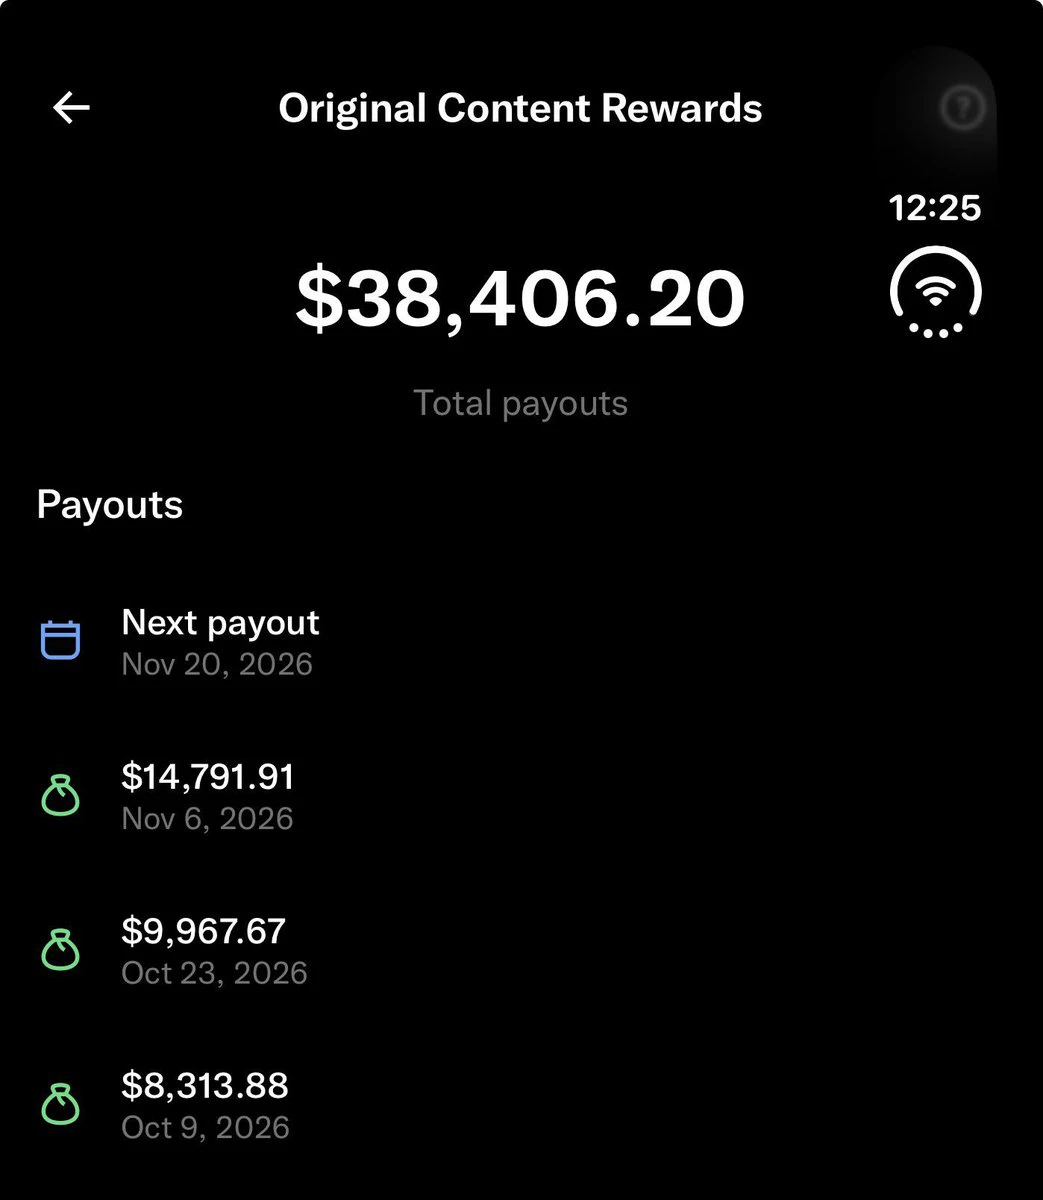
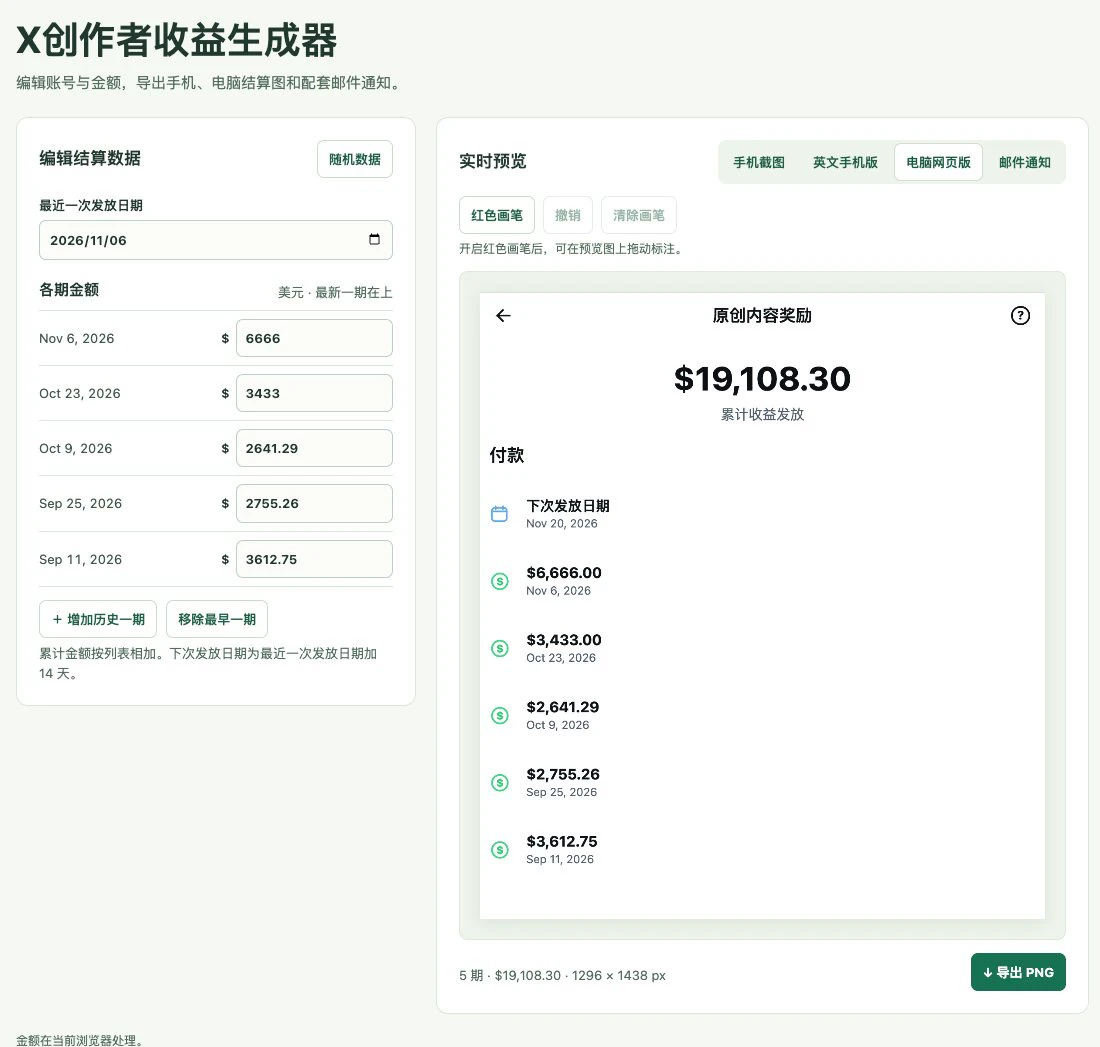
Do you always envy others for making several thousand dollars from X in just half a month?
Do you also want to become an original content pro like them?
The tutorial is here 👇🤣
Say no to anxiety, be self-sufficient, and get it all done in one go
post-image
The market is quiet. Let's see who's still finding opportunities. 👀
Anything interesting on your charts?
Share your setups, ideas or market observations with ACS community.
Your next big catch might be someone else's missing piece.
Let's hear from you!
post-image
ACS+2.83%
Looks like it’ll keep trading sideways for another day tomorrow; just do your usual thing over the weekend
post-image
Red broth nine-grid hot pot is still so satisfying!
People from elsewhere think hot pot just needs to be numbing and spicy enough and tasty!
But that's not the case—hot pot places can differ a lot.
If the hot pot base is stir-fried well and the ingredients are fresh, it's delicious.
post-image
$ONE has surged from around $0.00103 to $0.00194 on this 4H chart, with $0.0020 now the key test.

I’m watching $0.00175–$0.00180 for support. Holding this zone could support another push, while losing it could bring $0.00160 into focus.

My view: strong momentum, but I’d wait for a stable retest before chasing these candles.

#ONE #Crypto #Gate!
post-image
ONE-1.19%
Who will be this year's dark horse? Watch out—your favorite hidden-gem streamer could suddenly break into the mainstream!

Every year, the annual awards bring some unexpected surprises.
Some are already fan favorites, some consistently deliver great content, and others seem low-key—until a crucial moment when they wow everyone!
The Gate Social Annual Streamer and Creator Awards are here. Who will be this year's dark horse?
Maybe it's the creator who diligently shares knowledge every day, the streamer who always has a witty remark during livestreams, or the content creator who can always find a
AMD+11.55%
Load More

Join 40 M users in our growing community

⚡️ Join 40 M users in the crypto craze discussion

💬 Engage with your favorite top creators

👍 See what interests you

Trending Topics

USAIStocksHitHard

17.41k Views3.65k Discussing

U.S. stocks sold off sharply on Thursday, November 5 (UTC). The Nasdaq closed down around 5.5%, entering correction territory, while the Philadelphia Semiconductor Index plunged roughly 12%, with chip stocks including $NVDA and $AMD posting steep losses. Beyond profit-taking, investors are growing concerned about the pace of AI data center construction, capital spending, and future returns on investment. The key question now is whether the AI sector’s lofty growth expectations need to be repriced. Where do you think the next opportunities will emerge: chip stocks, tech giants, or other sectors?

USNonfarmPayrolls

26.04k Views4.28k Discussing

StakeOnLaunchpoolToShare450KVLX

4.29k Views789 Discussing

View More