


Share your thoughts
placeholder
Article
This return has me feeling nervous, afraid the market will come to its senses tomorrow and blacklist me.

When I thought this move was completely over, I went back and reviewed $ARM ’s chart. Each rebound was weaker than the last, and volume failed to follow, with clearly insufficient buying support. I placed the short at 266.18. My thinking at the time was simple: if no one was buying up there, then it would move down.

+94.31% came in quietly just like that. Getting the rhythm right feels better than anything.

The prerequisite for compounding is staying alive; the shortcut to getting ric
post-image
ARM-3.72%
ETH+0.19%
ADA-0.90%
🚨 SILVER ( $XAG ) CRASHES -6% Sharp Reversal From $68 Highs 📉
📊 $XAG /USDT
📉 Direction: SHORT
⚡ Leverage: 5x
🎯 Entry Zone: 64.20 – 65.50
🎯 Take Profit Targets:
TP1: 63.64 +11%
TP2: 62.50 +44%
TP3: 61.00 +92%
🛑 Stop Loss: 66.30
$XAG ‌#GateTop4MainstreamCEX
post-image
XAG-5.49%
  • 7
  • 1
All eyes are on US CPI tomorrow.
August headline CPI is expected at 3.4% YoY, while core inflation is forecast at 2.4%.
This one could set the tone heading into next week’s Fed decision.
A hotter print could strengthen the case for another rate hike and add more pressure to risk assets.
A cooler reading could do the opposite, helping markets settle after today’s negative reaction to PPI.
Either way, tomorrow’s CPI is the number to watch.
Volatility could pick up fast once the data drops.
#USStocksRecordSixthLargestWeeklyInflowSince2008
  • 6
$牛来 Signal】Long + 1H High-Level Turnover/4H MACD Expansion
$牛来 surged to 0.1285 on the 1H before pulling back to 0.116. The 4H MACD red bars are expanding, while the 1H MACD red bars are contracting. Order book buy-side depth is 1.13, with a Depth imbalance of 6.04%, indicating active bids below. RSI is 60.56 on the 4H and 72.08 on the 1H, showing short-term overheating and a long-side turnover zone. OI is stable, the funding rate is 0.0330%, and no excessive leverage concentration is evident.
🎯Direction: Long
⚡Entry/Limit Order: 0.1158115 - 0.1161600
🛑Stop Loss: 0.1103520
🚀Target 1: 0.124
post-image
牛来+60.57%
BTC-1.08%
ETH+0.17%
SOL-1.50%
#GateGloballyLaunchesStockEventContracts
Gate Brings Stock Event Contracts to Global Traders
Gate has taken another major step in expanding its multi-asset trading ecosystem with the global launch of Stock Event Contracts. The new product introduces a short-term, event-based way to trade the expected direction of selected stocks, giving traders a new method to express bullish or bearish market views.
According to Gate’s official announcement, the first batch includes MU, SNDK, SKHYNIX, and Unitree Robotics, with both 5-minute and 15-minute short-cycle markets available. Gate describes itself
Everyone is sleeping on SYMBOL while the 1h setup screams long.

$SAMSUNG /USDT - LONG

Trade Plan:
Entry: 189.33 – 190.35
SL: 183.46
TP1: 194.63
TP2: 197.82
TP3: 202.60

Why this setup?
Why now? The 4h confluence is aligning for a directional push inside a 1D range. The 15m RSI sits at 27.42, signaling oversold exhaustion that often precedes a reversal. The 1h ATR of 2.045136 confirms volatility expansion is ready to fuel the move. Entry is defined at 189.84, with a tight zone between 189.33 and 190.35 offering precision. The first target locks at 194.63, and a run to 197.82 would confirm
SAMSUNG-4.56%
Insiders are quietly loading SYMBOL while the daily trend screams bearish

$HOME /USDT - LONG

Trade Plan:
Entry: 0.00543 – 0.00547
SL: 0.00521
TP1: 0.00563
TP2: 0.00575
TP3: 0.00594

Why this setup?


Debate:
Are we hitting TP2 at 0.00575 or is the bearish 1D trend about to invalidate this long?

⚠️ Personal market analysis only. NFA — manage risk and DYOR.
Educational content, not investment advice or a recommendation to buy, sell, deposit, or withdraw any asset. No paid promotion or referral/affiliate links.
HOME-2.50%
Insiders are calling this the exact low before a run that could make SYMBOL unstoppable.

$BTC /USDT - LONG

Trade Plan:
Entry: 77145.8 – 77388.4
SL: 76102.6
TP1: 78140.4
TP2: 78722.7
TP3: 79596.0

Why this setup?
Why now? The daily trend is bullish, and the 1h price sits at 77267.1 inside the entry zone between 77145.8 and 77388.4, giving us a defined risk. The 15m RSI at 39.66 shows the dip is still holding, while the 1h ATR of 485.189226 tells us the next leg is likely to be large. TP1 at 78140.4 is the first target, TP2 at 78722.7 is the extension goal, and the invalidation level of 783
BTC-1.07%
I’m not buying celebrity coins but I’m always down to make fun of them
GN
post-image
$1000 to $100,000 Crypto Trade Challenge Today
live-cover
LIVE473
Layout for Bitcoin, Ethereum, and Dogecoin
live-cover
LIVE1,432
#GateEventContractChallenge
📈 My Profitable DOGEUSDT Trade.
Today I am sharing my latest trade within #GateEventContractChallenge . This time, the focus was on DOGEUSDT—a futures contract I chose to trade after assessing the current market dynamics.
I opened a buy position, expecting DOGE to continue moving upward. For me, it was important not simply to enter a trade based on emotions, but to assess the situation on the chart and wait for the moment when the potential movement would provide an opportunity to lock in the result.
The market, as always, does not move in a straight line, so duri
AAPL+3.55%
DOGE-2.11%
  • 1
With this trend, I don't even need to think—the account is dancing on its own. 💃
During the intraday rebound, $SOL surged aggressively. At a glance, it reeked of a bull trap, with the price-volume divergence right there. While others were chasing the rebound, I instead placed a short around 103.42, betting it couldn't hold at the highs.

Now the price has quietly dropped to 99.92, with +314.59% profit in hand—more tangible than anything else. 💪

I've closed 80% of the short position first; only realized profits are truly yours. For the remaining 20%, I moved the protection level near the
post-image
SOL-1.45%
BTC-1.07%
BNB-0.80%
Gold prices find support on the downside, while CPI data may ignite a rebound
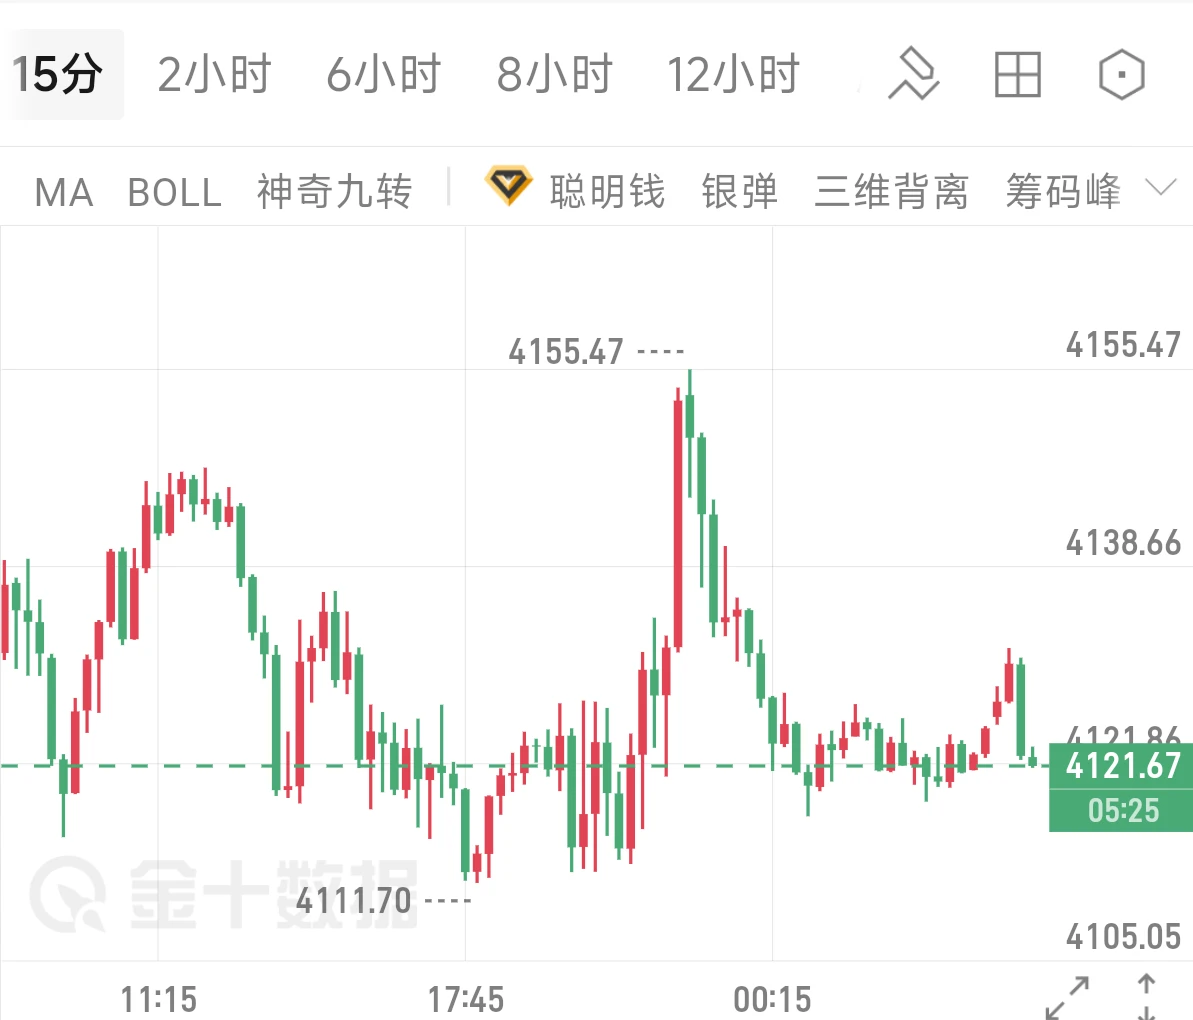
On the four-hour chart, gold prices have retreated to near the lower Bollinger Band, while the RSI has reached 21.65, entering the low range. Short-term downward momentum is gradually weakening, creating a need for a technical rebound. The previous low of 4282 is a key support level; despite multiple tests, the price has not effectively broken below it, indicating solid support. The market generally expects inflation to ease. If CPI comes in below expectations, it would weaken the rationale for the Federal Reserve to
post-image
XAU-1.80%
Everyone is fading the daily bearish trend, but SYUI is quietly building a long.

$SUI /USDT - LONG

Trade Plan:
Entry: 0.736 – 0.742
SL: 0.699
TP1: 0.769
TP2: 0.789
TP3: 0.819

Why this setup?
Why now? The 1h price is holding at 0.739 while the 15m RSI plunges to 26.93, signaling a deep oversold bounce within a broader bearish 1D trend. The 1h ATR of 0.01285 defines the volatility envelope that makes the 0.736 to 0.742 entry zone a precise scalp. Hitting TP1 at 0.769 rewards the reversal, while TP2 at 0.789 captures the full mean return against the daily structure. The line in the sand is
SUI-4.06%
I originally wanted to cut the position and call it a day, but it turned around on its own and handed the profits back. During the intraday plunge, the rebound was weak, and every push upward fell just short. Looking at the chart, I had one thought: the bull-trap vibes are strong—don’t take the bait. The high-level short I flagged one afternoon a few days ago opened at 0.00899 and is now at 0.00545, with +2794.02% in unrealized profit sitting there. It was truly sluggish beforehand, but the move that followed was truly satisfying. For now, take 80% off the table, protect the remaining 20% at t
post-image
BTC-1.07%
LAB-6.91%
This was purely a case of good market sentiment casually tossing out some coins that happened to land right on my head. A few nights ago before bed, I was watching the chart; $BTW looked like it was about to give up, but funds were quietly flowing in, and the pullback never broke the key level. I thought, instead of blindly guessing, I might as well try once and follow the rules.
I got in with a limit order, with the cost around 0.377246. When I woke up today, the current price had reached 0.495165, for a direct gain of +310.93%. I thought this move was completely dead, but it came back to li
post-image
BTW+11.95%
SOL-1.45%
BTC-1.07%
$$RVN erased a quarter of its market cap in one day. This isn't a crash; it's the market maker paying the shorts.
Look at the data: it fell 24.67% in 24 hours, with the price slammed from 0.0031 to 0.0022, now closing at 0.0023, while trading volume reached 21.9M. When retail traders see this big bearish candle, their first reaction is to cut losses and run. But let me tell you, for an old mining coin like RVN, a drop like this is when it is at its most attractive. Why? It has a large circulating supply, long-standing consensus, and no VC unlocks dumping on the market. A 24% drop has occurred
RVN-21.78%
Yea this is bad
Really bad
post-image
Nobody is talking about the SYMBOL setup hiding inside a daily range right now.

$SOL /USDT - SHORT

Trade Plan:
Entry: 99.76 – 100.30
SL: 102.57
TP1: 98.12
TP2: 96.85
TP3: 94.94

Why this setup?
Why now? The 1h price is pinned at 100.03 inside a tight range, and the 15m RSI has dropped to 39.62, signaling weak momentum before a potential breakdown. The 1h ATR sits at 1.06038, which means the average hourly move is small enough that a breach of the entry zone between 99.76 and 100.30 could accelerate quickly. The daily trend is range-bound, so the bias favors fading any push toward the uppe
SOL-1.45%
Load More

Join 40 M users in our growing community

⚡️ Join 40 M users in the crypto craze discussion

💬 Engage with your favorite top creators

👍 See what interests you