Share your thoughts
placeholder
Article
🚨 An open challenge to “bear market” accounts and those with fabricated figures
Let’s talk about tangible reality and expose the truth about the doomsayers
The bear market accounts used to post hundreds of tweets every day about impending crashes to scare people and drive them away..
Just imagine if their failed analysis had succeeded?!
They would have hosted daily Spaces, chants, and endless cheerleading
The terrifying difference between fake content creators and real trading knights:
• Fearmongering accounts are merely daily writing from behind screens, without a real portfolio or a single
post-image
GM 9 Days till @arc mainnet.
@circle almost launched as $Bancor. In 2013 the working name was reportedly Keynes 1940s proposal for a neutral global reserve currency a unit of account that would sit above any single nation’s money.
That name was too on the nose for what they were actually building. They chose Circle instead a real English word, the expensive domain they wanted, something that felt global, complete, something that they could brand.
13 years later the product looks a lot more like the original idea than the marketing name. Full-reserve digital dollars. Federal trust bank. Open
post-image
ARC-1.51%
CRCLG-1.10%
CRCLX-1.13%
BNT+0.86%
  • 2
May you experience financial breakthrough this month
post-image
#AltcoinOISurpassesBitcoinforFirstTimeinOveraYear
The crypto derivatives market has just delivered one of the strongest signals of changing trader positioning in more than a year: total altcoin perpetual-futures open interest has moved above Bitcoin’s for the first time since December 2024. The crossover is based on Coinalyze data and shows that a larger share of outstanding leveraged positions is now concentrated across altcoins rather than BTC.
WHY THIS UPDATE MATTERS
Open interest represents the total value of derivative contracts that remain open and unsettled. When altcoin OI moves above
post-image
GT-2.08%
NVDA+0.87%
  • 3
#ZECBreaks1200HitsNewAllTimeHigh
Zcash ($ZEC ‌) is making a massive comeback! 📈⚡
The past few days have been absolutely explosive for ZEC. After trading around the $800 level earlier this week, Zcash started a powerful rally, breaking through major resistance levels one after another.
📊 ZEC Weekly Price Journey:
🔻 Weekly Low: Around $805–$806
📈 $900 Resistance: Broken
🚀 $1,000 Psychological Level: Broken
🔥 $1,200 Level: Broken
🏆 Recent High: Around $1,250
⚡ From the weekly low near $806 to the recent high around $1,250, ZEC moved more than 55%.
According to recent historical data, ZEC
post-image
ZEC+1.43%
  • 3
Nobody is warning you about this $ETH /USDT setup hiding in plain sight.

$ETH /USDT - SHORT

Trade Plan:
Entry: 2485.16 – 2492.74
SL: 2525.31
TP1: 2461.68
TP2: 2443.50
TP3: 2416.23

Why this setup?
Why now? The daily trend is range-bound, which often precedes a sharp directional move once volatility decides a side. The 1h ATR at 15.15 shows enough kinetic energy for a leg down from the entry zone of 2488.95. The 15m RSI reading of 41.47 confirms bearish momentum is still intact and has room to run. The target TP1 sits at 2461.68, followed by TP2 at 2443.50, offering a layered profit-taking
ETH-0.42%
A few days ago, I was still calculating whether I had enough money for this month’s instant noodles. This morning, I was already wondering whether to add sausage.
As the market repeatedly oscillated intraday, many people were worn down and lost their patience. I, on the other hand, kept watching the chart and thinking about one thing: every upward push fell just short, which meant the selling pressure above was always holding it back, and the funds were nowhere near ready for a breakout. The longer it dragged on, the more it felt like a bull trap.
So I made a direct decision—entered while the
post-image
DOGE-0.38%
BNB-1.83%
Crypto Market and Trading Insights
live-cover
LIVE1,121
Nobody is talking about this DOGE setup while the 1h RSI quietly stalls.

$DOGE /USDT - SHORT

Trade Plan:
Entry: 0.08931 – 0.08979
SL: 0.09186
TP1: 0.08782
TP2: 0.08666
TP3: 0.08493

Why this setup?
Why now? The daily trend is range, which means we are in a compression zone where a sharp move is overdue. The 1h RSI sits at 48.1, showing just enough bearish momentum without being overbought, so the short bias has room to breathe. The 1h ATR of 0.000963 tells us the current volatility is tight, making the entry zone between 0.08931 and 0.08979 a precise trap for longs. We target TP1 at 0.087
DOGE-0.38%
19,000 followers | 256,402 $HYPE holders
post-image
HYPE+0.05%
Aster is such an underrated platform, not because of UI or performance but because of the level of precision it has with listings.
This is a bad example, but I advise you watch tokens after getting listed on Aster, especially meme runners.
Astrillions
post-image
ASTER+1.95%
MEME-0.07%
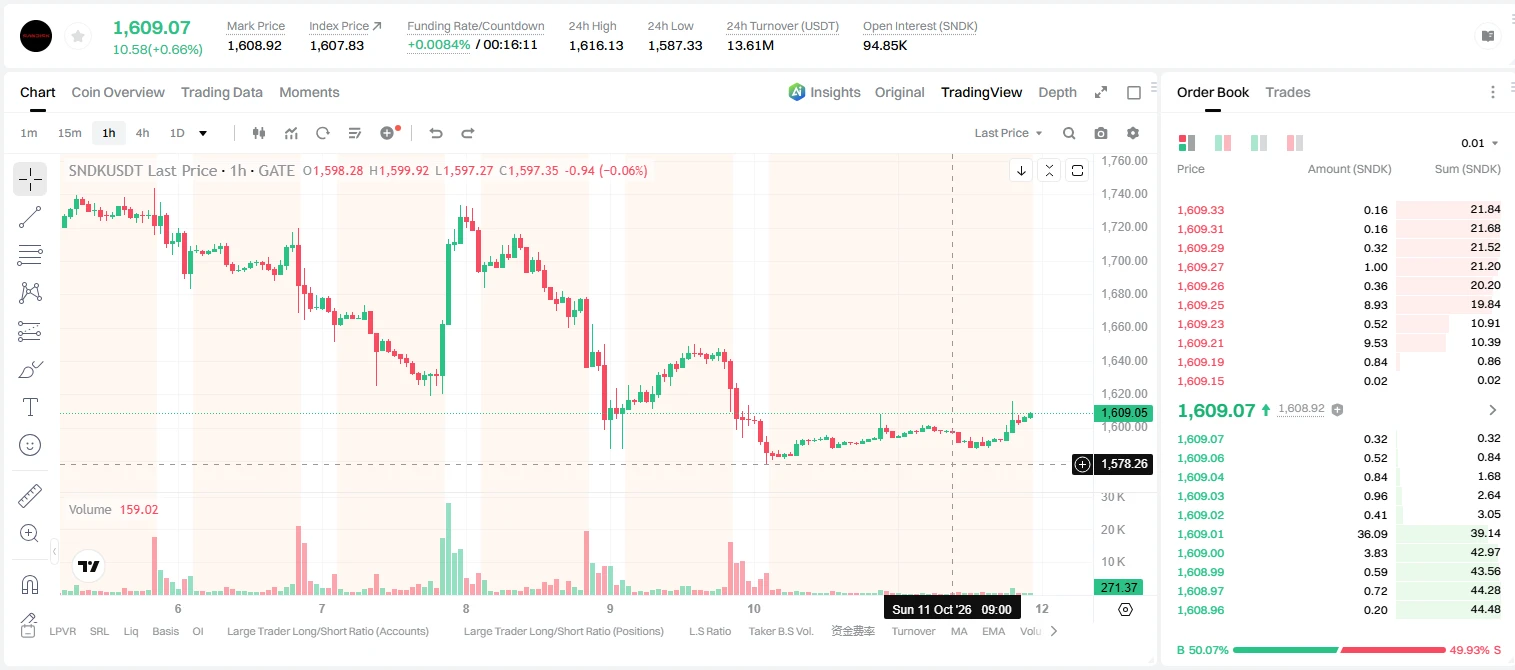
In the short term, the #SNDK/USDT token is maintaining its upward structure, trading just ~10% below its all-time high. The key support levels are $1,750 and $1,455 (the weekly low), while resistance is represented by the psychological level of $1,800 and the ATH zone at $1,972.
Key Entry Levels
Pullback Level (Long / Buy): $1,750 – $1,756
Setup: Buy on a correction to the local support of the daily range.
Stop-loss: Below $1,735 (loss of ~1%).
Take-profit: $1,800 and $1,850.
Breakout Level (Breakout Long): $1,800
Setup: Enter on momentum after the hourly candle closes above $1,800.
Stop-los
SNDK+11.88%
#GateTrenchesGasFree
Gate Trenches is LIVE – and it’s a game‑changer for meme hunters!
I’ve been testing the new All‑Chain Golden Dogs hub, and here’s my take:
🔹 Ultra‑low fees – just 0.5% standard, plus temporary 0 GAS on Robinhood Chain (don’t sleep on this – gas savings add up fast).
🔹 10+ chains supported – ETH, SOL, BSC, ARB, SUI, AVAX, Base, Polygon… you name it. No more jumping between DEXs.
🔹 Social trading built‑in – the Callout Heatmap and KOL Leaderboard help spot early momentum before it pumps. Active accounts feed are pure alpha.
My quick recap:
· Scalped a small bag on $ROBIN
post-image
MEME-0.07%
DOGS+1.29%
ETH-0.40%
SOL-1.58%
  • 13
  • 1
HK stocks slide: Hang Seng -0.93%, Tech Index -0.92%; Zhipu ( -5.3%. $HKD, $BTC /crypto implications unclear from data; no direct link to crypto unless asked.
post-image
BTC-0.68%
a-meme-coin:native cup and handle
0x385f4f8ae47651ce5f58f5265395a669f8281e18
2x is coming
#crypto #memecoin $sol $btc
post-image
MEME-0.07%
SOL-1.58%
BTC-0.68%
A clear example of how powerful Variational SWAPS are:
If you were trading Oil, you probably noticed that it dropped so fast, most stops above the highs were untouched
So when CL price reached the short zone at 65, you could have bet it's gonna rekt those shorts at some point
The thing is... it could take days, weeks, maybe months, and you could be right but still get rekt by funding rates
Swaps allow you to have fixed rates and enable this kind of trade without getting rekt, if you're right, you're gonna cash out
That was an easy trade on Oil but we can't take it because of funding rates, Var
post-image
CL-0.59%
I am no longer who I used to be; I won’t cry anymore for someone I shouldn’t love.
Live trading - Analysis crypto coin
live-cover
LIVE2,042
Insiders are calling SYMBOL a quiet breakout nobody has noticed yet.

$USELESS /USDT - LONG

Trade Plan:
Entry: 0.2259 – 0.2333
SL: 0.1937
TP1: 0.2565
TP2: 0.2745
TP3: 0.3014

Why this setup?
Why now? The daily trend is bullish, the 1h RSI sits at 59.11 showing room to run, and the 1h ATR of 0.014961 confirms active momentum. The entry zone between 0.2259 and 0.2333 aligns with the 1h price of 0.2296, giving a clean reference for a long position. If the move plays out, TP1 at 0.2565 and TP2 at 0.2745 offer layered profit-taking, while the invalidation level of 0.1607 is the hard line in the
USELESS+1.68%
$YFI YFIUSDT chart (1-hour timeframe)
The price is moving within a descending channel on the 1-hour timeframe and has reached the lower boundary. It is now poised for a bounce and is expected to retest this boundary.
The Relative Strength Index (RSI) indicates a downward trend, which is likely to continue given the overbought conditions.
There is a key support zone in green at 2200, and the price has bounced off this zone several times, making it a strong support level.
The price is trending towards the 100-period moving average, which we are approaching. This trend supports an upward move.
En
post-image
YFI-1.98%
Load More

Join 40 M users in our growing community

⚡️ Join 40 M users in the crypto craze discussion

💬 Engage with your favorite top creators

👍 See what interests you

View More