Square
Following
Hot
News
Notifications
Profile
Share your thoughts
placeholder
Article
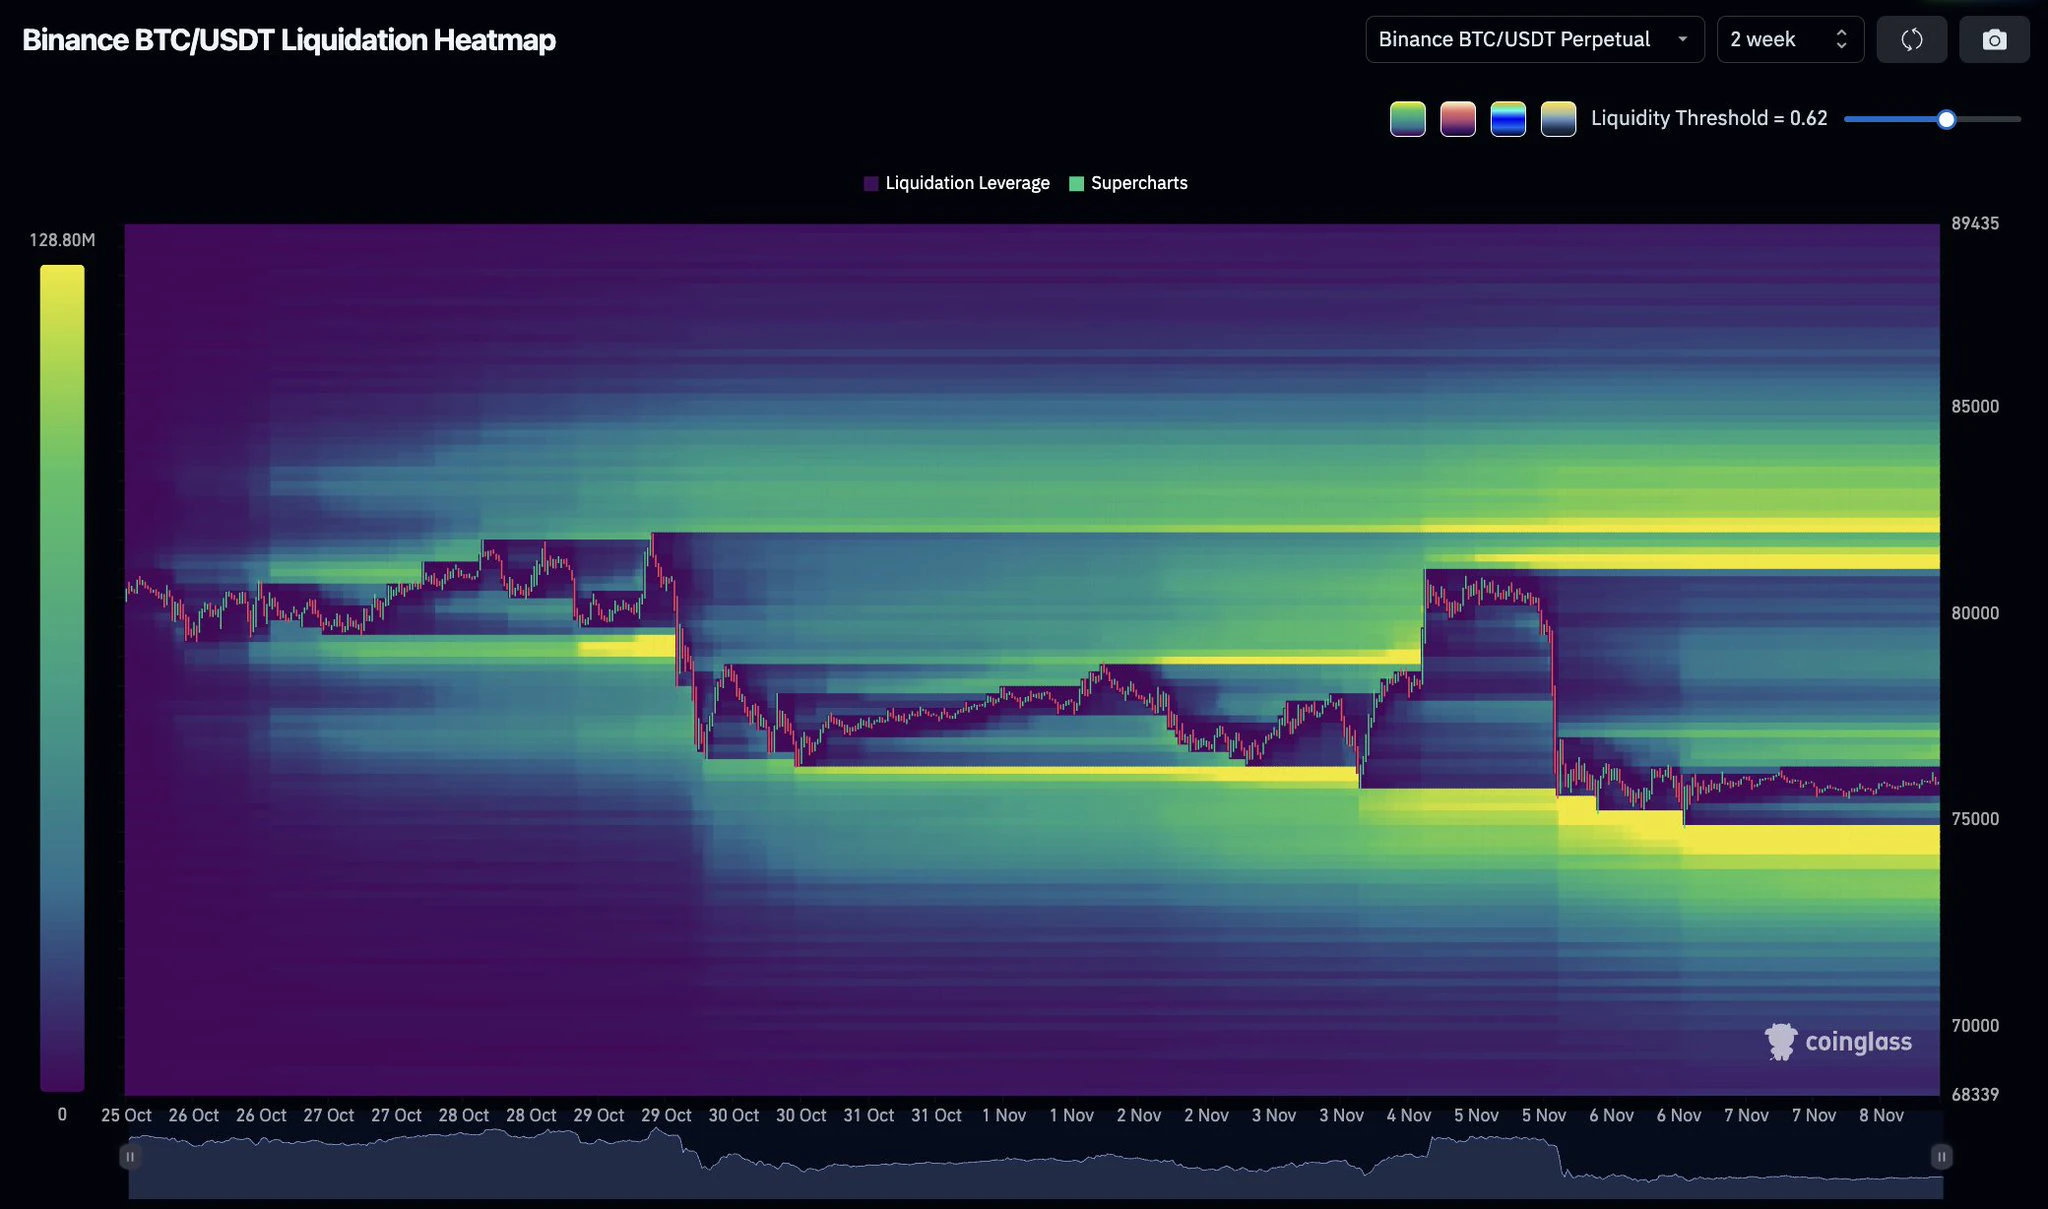
$BTC is near $76,000 with major liquidation clusters on BOTH sides.

Longs around $74,000 to $75,000.
Shorts around $81,000 to $82,000.

Which side gets swept first? 👇

#USCPIDataIncoming
#USAIStocksHitHard
post-image
BTC-0.65%
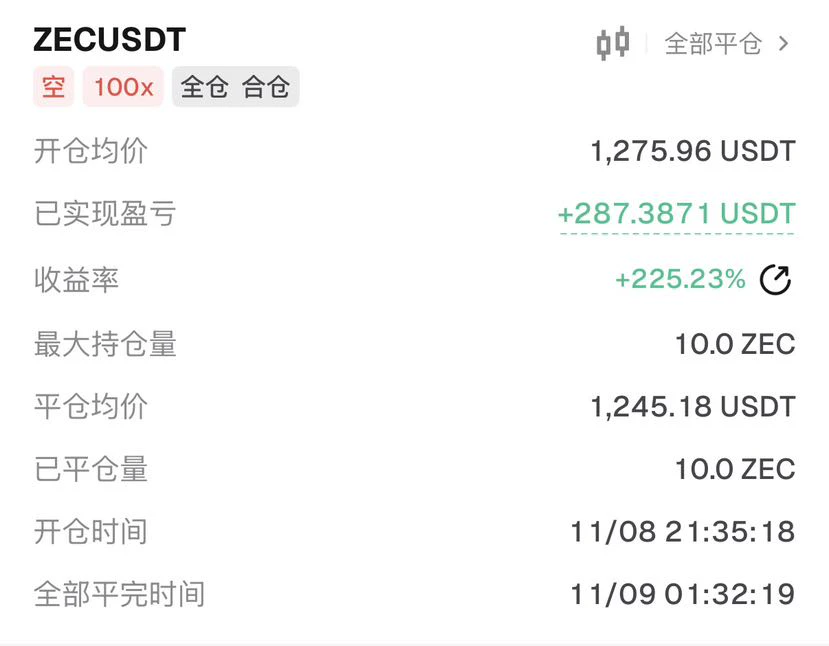
Turning 2,000 U into a doubled account is easy—just do it 10 times.
[Position Entry Analysis]:
$ZEC The price surged last night, breaking the minor resistance at 1280. The candlestick pattern showed the uptrend was still intact. It reached a high of 1290 before pulling back. The wick pattern showed a double top, with a second candle body breaking below 1280. The price then consolidated at a high level. The W pattern on the shorter time frame failed to hold above 1280. The order book showed bears in control, with more sell orders overhead. I chose to follow the major players and test the trade
post-image
ZEC+1.29%
BTC-0.65%
ETH-1.23%
Trenches
ZIG
Z
bade
b
ZIG
0x8c...1145
Market Cap
$.
Change
.
24h Vol
$.
Holders
.
STONK
S
bade
b
STONK
6GmA...UNgx
Market Cap
$.
Change
.
24h Vol
$.
Holders
.
CLAUDIA
C
bade
b
CLAUDIA
2j5S...W2ZM
Market Cap
$.
Change
.
24h Vol
$.
Holders
.
BTC
B
bade
b
BTC
C5xp...pump
Market Cap
$.
Change
.
24h Vol
$.
Holders
.
FLOAT
F
bade
b
FLOAT
Bv1a...BMmr
Market Cap
$.
Change
.
24h Vol
$.
Holders
.
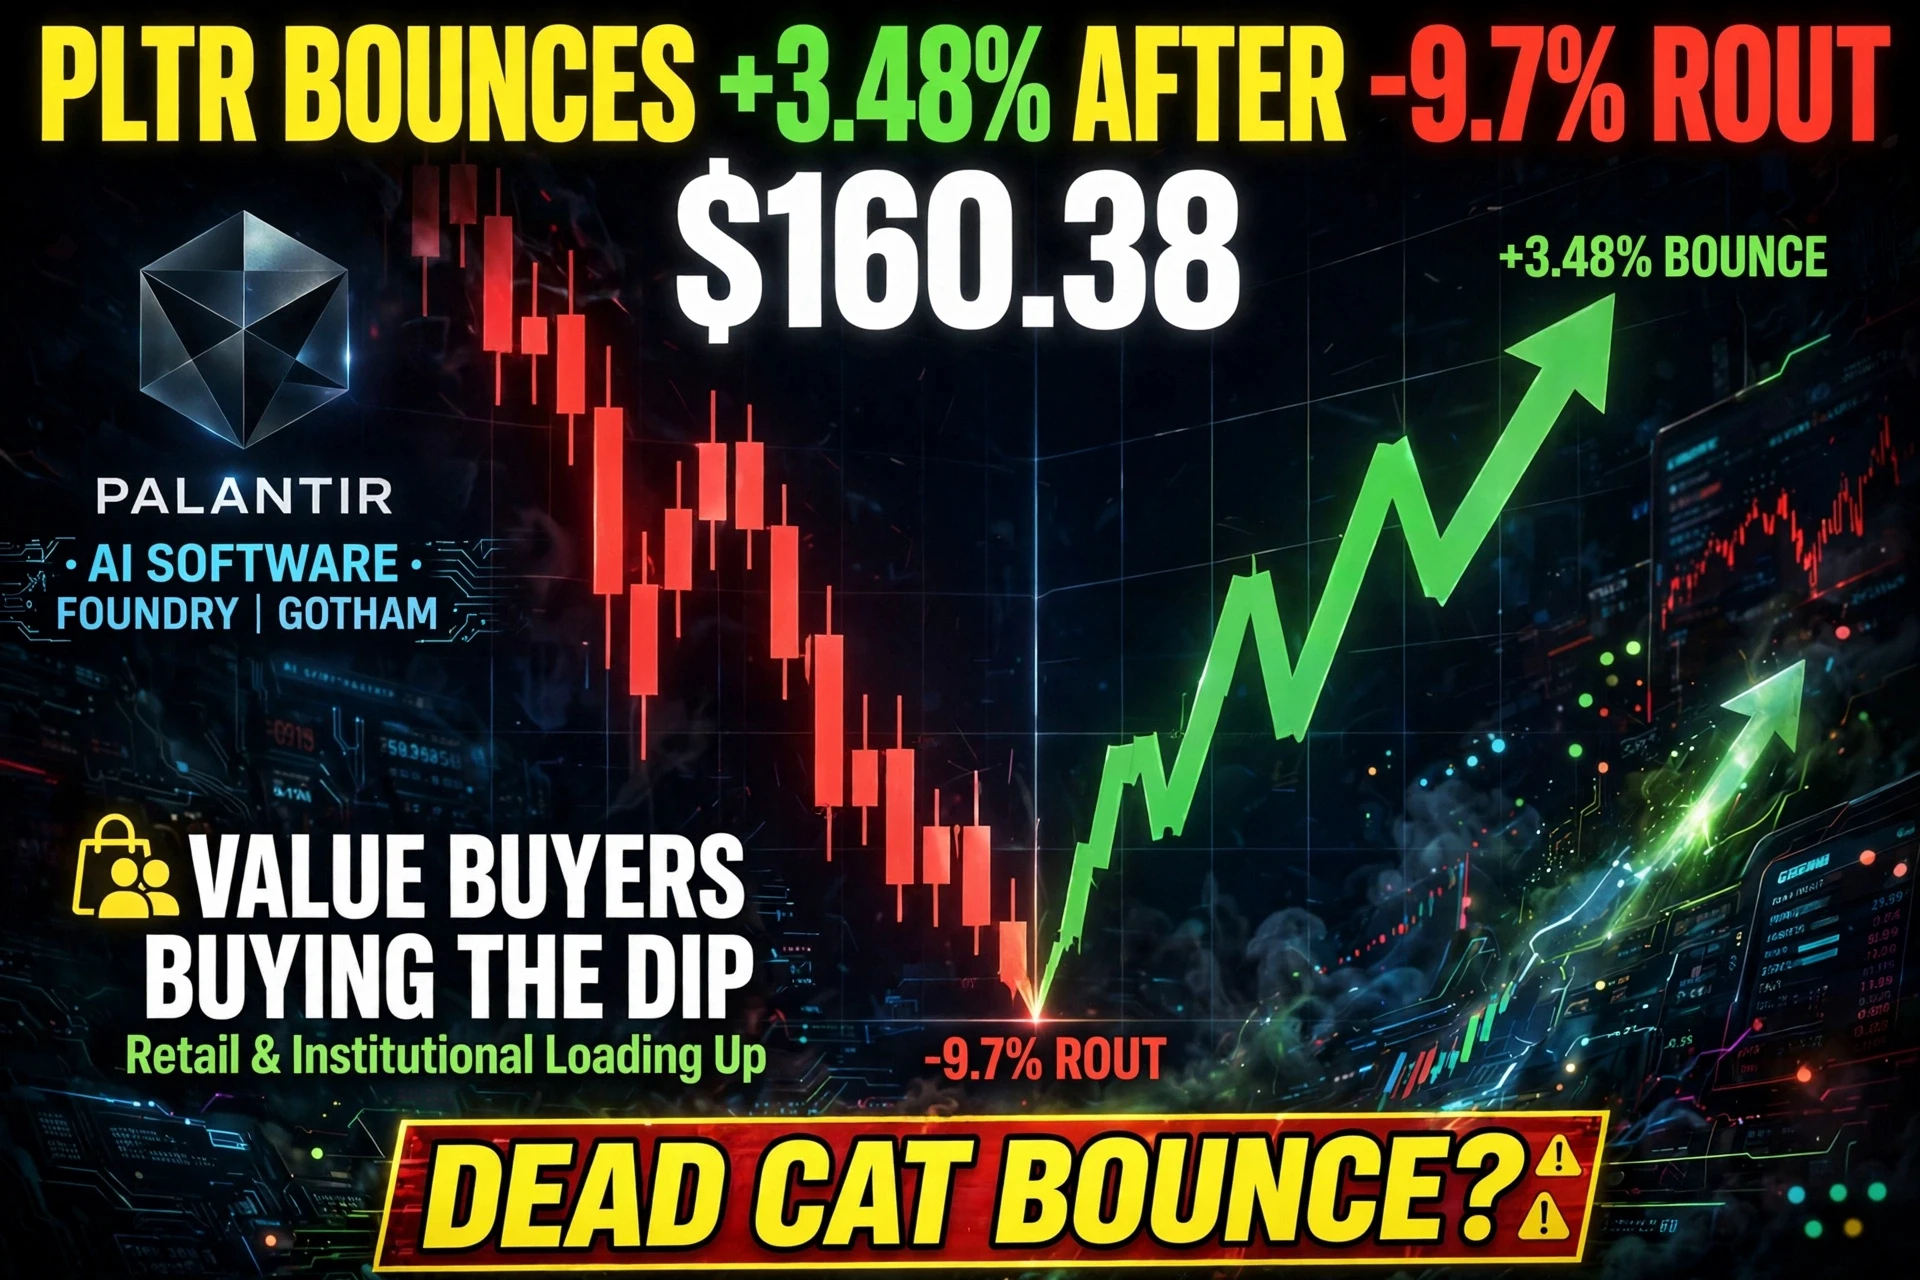
Palantir (PLTR): A Much-Needed Bounce After a Sharp Rout
Palantir bounced to $160.38 on Friday, rising 3.48% after suffering a 9.7% rout on Thursday. The ticker shows PLTR up 3.57%.
Palantir is often viewed as a bellwether for AI software and government contracting. The 9.7% drop on Thursday indicates a severe and sudden negative catalyst—likely disappointing earnings, a downgrade, or a broad sector sell-off that hit high-multiple tech stocks particularly hard. A 3.48% bounce the following day is a natural market reaction as value buyers step in to "buy the dip."

The critical question for in
post-image
PLTR+3.57%
  • 2
  • 1
🚨 ARGENTINA BRINGS REAL-WORLD ELECTRICITY TO THE XRP LEDGER!
⚡ $JMWH = 1 MWh OF REAL ELECTRICITY, BACKED BY ENERGY CONTRACTS YPF Luz × Justoken
✅ REAL ENERGY | REAL‑WORLD ASSETS | POWERED BY XRPL
⚠️ Note: JMWH is a separate token (NOT XRP), a corporate closed-loop system, check official project updates!
#XRPL #RWA #JMWH #XRP
post-image
XRP-1.15%
YPF-0.09%
RWA-0.39%
The most easily overlooked cost in crypto: attention.

BTC and ETH prices are moving, and your attention is being fragmented too:
checking prices, reading group chats, chasing trends, then refreshing once more.

After a busy day, it feels like you’ve seen everything, yet you can’t say which logic you actually believe in.

More information doesn’t necessarily mean you see things more clearly. Sometimes it just means your emotions shift faster.

When you spend the longest time watching the market, is the market clearest—or are you feeling the least sure?

‍#BTC #ETH
post-image
BTC-0.67%
ETH-1.26%
Signal 5
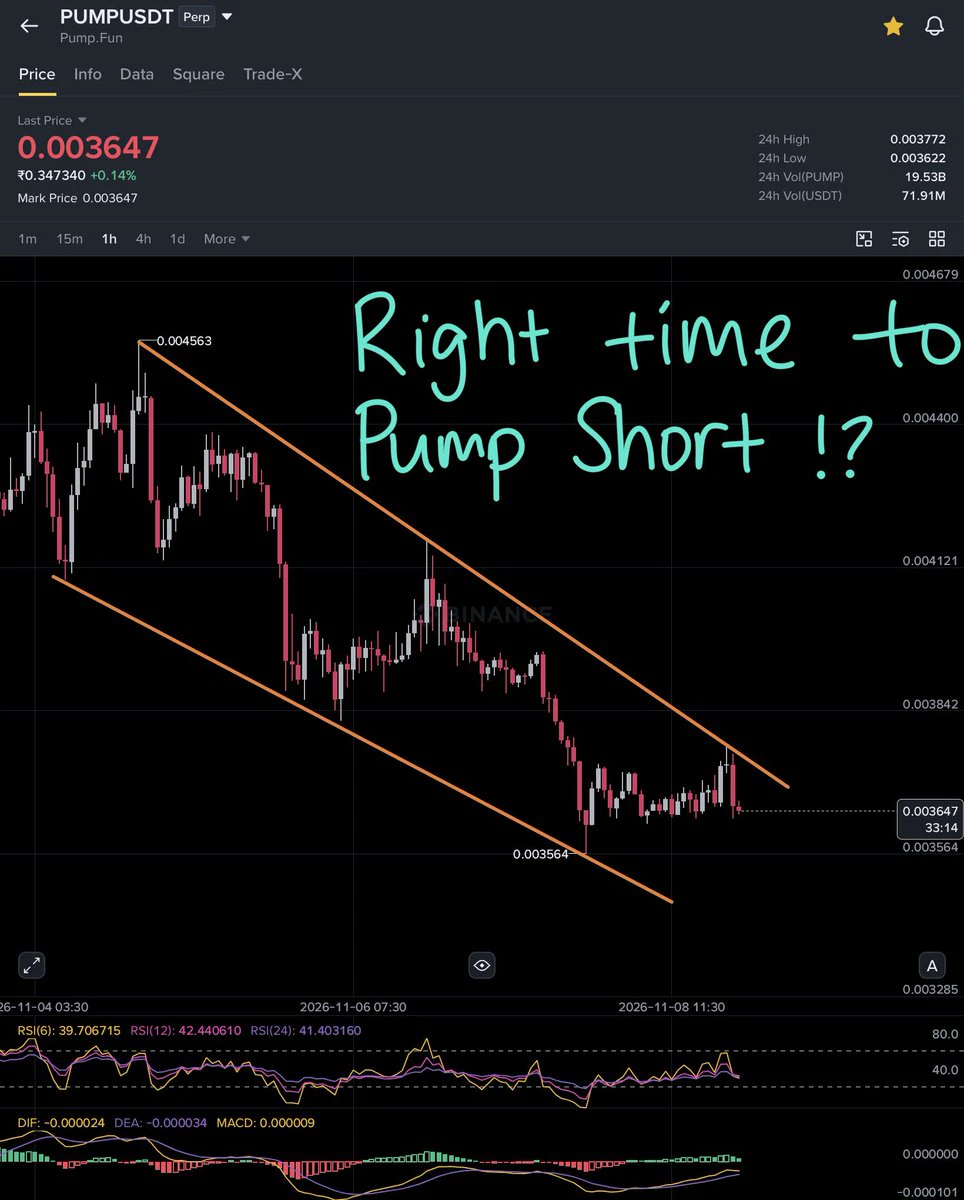
Looking at Pump dot fun, we are clearly observing a descending channel pattern, an absolute structure with lower lows and higher lowers, continuously rejecting at the upper trendline (higher low peaks) and consequently holding lower trendline support (lower lows).
If $PUMP comes to the upper trendline again, I would like to take a risky short position by maintaining an SL at 3850 and entry at 3750-3820. Targets would be 3630, 3500, 3400. Leverage is 25x and using 2% of funds only.
post-image
PUMP-0.99%
Oh, beloved village, I’m leaving the city behind
On Monday, November 9, several economic data releases and central bank officials’ speeches are worth watching. At 9:30 Beijing time, China’s October CPI annual rate will be released, reflecting domestic inflation. At 15:00, Germany’s September seasonally adjusted trade balance will be released; at 17:30, the Eurozone’s November Sentix Investor Confidence Index will be published. At 23:00, the U.S. September wholesale sales month-over-month rate will be released, while Federal Reserve’s Goolsbee speaks. At 00:00 the following day, the U.S. October New York Fed 1-year inflation expectations data
$JCT It should be stable now. I want to add to my position on the way up, but I don't dare open any more long positions
JCT-3.26%
🚀 JCT/USDT Perpetual Market Breakdown: Massive Momentum Surge!

The market is witnessing an extraordinary price action update on JCT/USDT, capturing massive attention across Gate.io Square with an explosive breakout. Here is a comprehensive technical and data-driven analysis of the current market dynamics:

📊 Key Market Statistics
Last Price: ~$0.011059

24h Change: +284.93% surge

24h High: $0.014795

24h Low: $0.002514

24h Volume (JCT): 10.32B

24h Turnover (USDT): $114.18M

📈 Technical Analysis & Price Action
Parabolic Breakout: JCT has broken out significantly from it
JCT-3.26%
After a large bearish candle pushed prices down, BTC hit a low near 748, while ETH headed straight for 2200. BTC and ETH barely moved after the nonfarm payrolls data came out.
The market is currently consolidating at low levels, which is the most frustrating phase.
Many people are trapped in positions here, and their mindset falls apart.
Watching the market swing back and forth, they alternately want to add to their positions to lower their average cost and fear a further breakdown. Holding is painful, but cutting losses feels hard to accept.
$BTC ‌
Low-level consolidation does not mean the m
BTC-0.65%
ETH-1.23%
The Options Market’s “Chain-Reaction Meltdown” — Why Was This Sell-Off So Relentless?

Guys, many people are wondering: Sure, U.S. stocks fell, but how could the Nasdaq drop 5.5% in a single day, while the Philadelphia Semiconductor Index plunged 12%? Did all the institutions in the market somehow agree to dump everything on the same day?

Actually, behind this lies an extremely brutal mechanism: options market makers’ “Gamma squeeze.”

Before this crash, large numbers of retail traders and institutions bought call options, thinking AI stocks could keep rising. To hedge the risk of selling tho
NVDA+2.80%
The amount involved is outrageous: $129 million!

People actually used AI face-swapping and voice-cloning to treat publicly traded companies and multinational giants like ATMs. The destructive potential of AI deepfake scams in Web3 and traditional finance has reached a critical point that can no longer be ignored.

The U.S. Department of Justice recently disclosed an exceptionally brazen AI fraud case: Starting in 2024, three foreign men used AI tools to convincingly fake the real-time voices and images of corporate CEOs, executives, and law firm attorneys. Following an elaborate “good cop, ba
post-image
Ethereum Trenches Rewards Week: Earn Triple Rewards and Share $30,000

https://www.gate.com/share/act/5b5f89c0
post-image
ETH-1.26%
The harshest rule in crypto: The more desperately you try to turn things around, the harder it is to do so
This isn’t feel-good advice; it’s a conclusion I’ve reached after seeing far too many accounts.
The people who lose the most are often not the worst traders, but the ones who can’t wait.
First, let’s correct a misconception: having little money isn’t the problem
300U, 500U, 1000U—none of these are the problem.
The problem is having little money and still wanting quick results.
Small capital + wanting quick results = oversized positions + high leverage + frequent trading.
Put these four th
post-image
BTC-0.65%
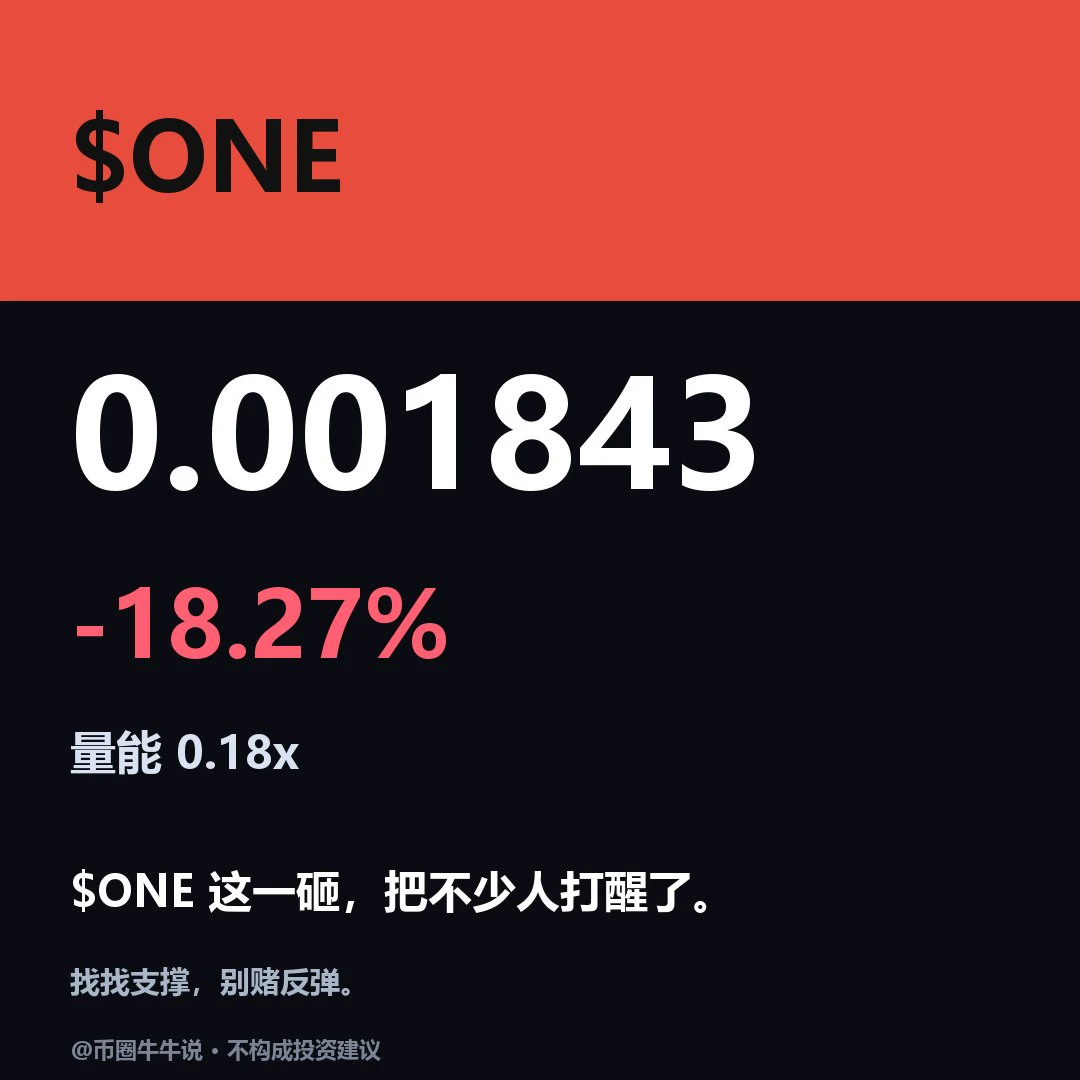
$ONE Current price: 0.001843, 24H -18.27% (0.001692–0.00243). 1H is weak: RSI 48.98/EMA20 0.00193, support at 0.001692/resistance at 0.00243; 4H is stronger: RSI 60.29/EMA20 0.001739, support at 0.001027/resistance at 0.002476. The upside condition is holding above the 0.00243 resistance level; the downside condition is breaking below the 0.001692 support level. Watch whether price can hold above 0.00243 and recover after losing 0.001692; the two timeframes still diverge, and short-term moves cannot be taken directly as a trend reversal; the volume ratio is 0.18x, and without volume confirmati
post-image
#Ahr999EntersBottomBuyingZone
AHR999 Enters the Bottom Buying Zone – Is Bitcoin Preparing for Its Next Big Opportunity? ₿
The cryptocurrency market is constantly moving through different cycles of fear, uncertainty, corrections, and recovery. However, some market indicators can help investors understand when Bitcoin may be approaching an attractive long-term accumulation zone. One indicator that has attracted attention among crypto enthusiasts is the AHR999 Indicator.
The latest visual concept highlights an important message: AHR999 is entering the bottom buying zone, potentially creating an
BTC-0.67%
[NEW STREAMER]market update
live-cover
LIVE814
Crypto Trade Now
live-cover
LIVE596
Load More

Join 40 M users in our growing community

⚡️ Join 40 M users in the crypto craze discussion

💬 Engage with your favorite top creators

👍 See what interests you

Trending Topics

USCPIDataIncoming

13.55k Views1.64k Discussing

The U.S. October CPI report will be released on November 10 at 8:30 a.m. ET. September CPI came in at 3.7% year over year, and markets will be watching closely for signs that inflation is cooling, especially in core CPI. A softer-than-expected reading could strengthen rate-cut expectations, while hotter inflation may pressure risk assets through higher Treasury yields and a stronger dollar. How do you think this CPI print will move $BTC, U.S. stocks and gold?

USAIStocksHitHard

28.45k Views3.74k Discussing

USNonfarmPayrolls

54.47k Views4.49k Discussing

View More