Square
Following
Hot
News
Notifications
Profile
Share your thoughts
placeholder
Article
Bitcoin ETFs saw a net outflow of $412 million, with BlackRock’s IBIT posting a net outflow of $403
live-cover
LIVE4,164
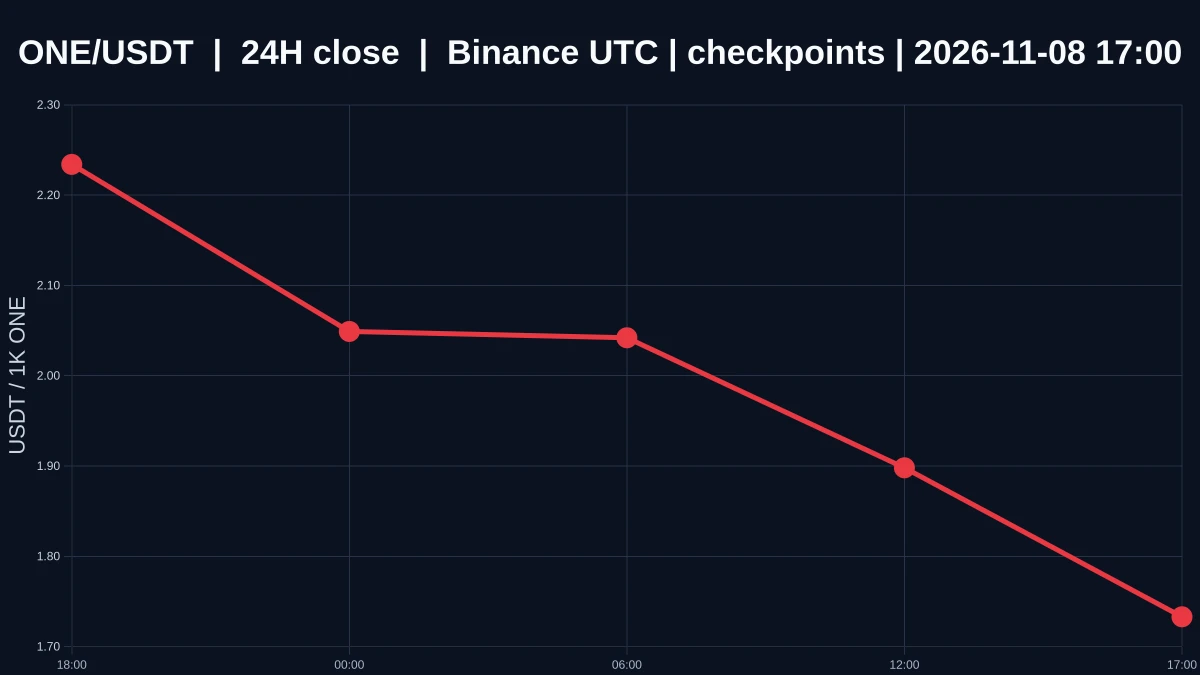
$ONE After a Sharp 24-Hour Drop, Watch for Continuation or a Recovery
$ONE is currently priced at 0.001726, down 22.636% over the past 24 hours, with an intraday high of 0.00243 and a low of 0.001692. The 1-hour and 4-hour trends are both weak, and the volume ratio is 0.018454130796300188. The sharp drop over the past 24 hours has already happened. What needs to be verified now is whether it will continue to extend or first return to the range to consolidate, rather than extrapolating the drop that has already occurred directly into a future direction.
In terms of levels, 1-hour support is at
post-image
Trenches
ZIG
Z
bade
b
ZIG
0x8c...1145
Market Cap
$.
Change
.
24h Vol
$.
Holders
.
STONK
S
bade
b
STONK
6GmA...UNgx
Market Cap
$.
Change
.
24h Vol
$.
Holders
.
CLAUDIA
C
bade
b
CLAUDIA
2j5S...W2ZM
Market Cap
$.
Change
.
24h Vol
$.
Holders
.
BTC
B
bade
b
BTC
C5xp...pump
Market Cap
$.
Change
.
24h Vol
$.
Holders
.
FLOAT
F
bade
b
FLOAT
Bv1a...BMmr
Market Cap
$.
Change
.
24h Vol
$.
Holders
.
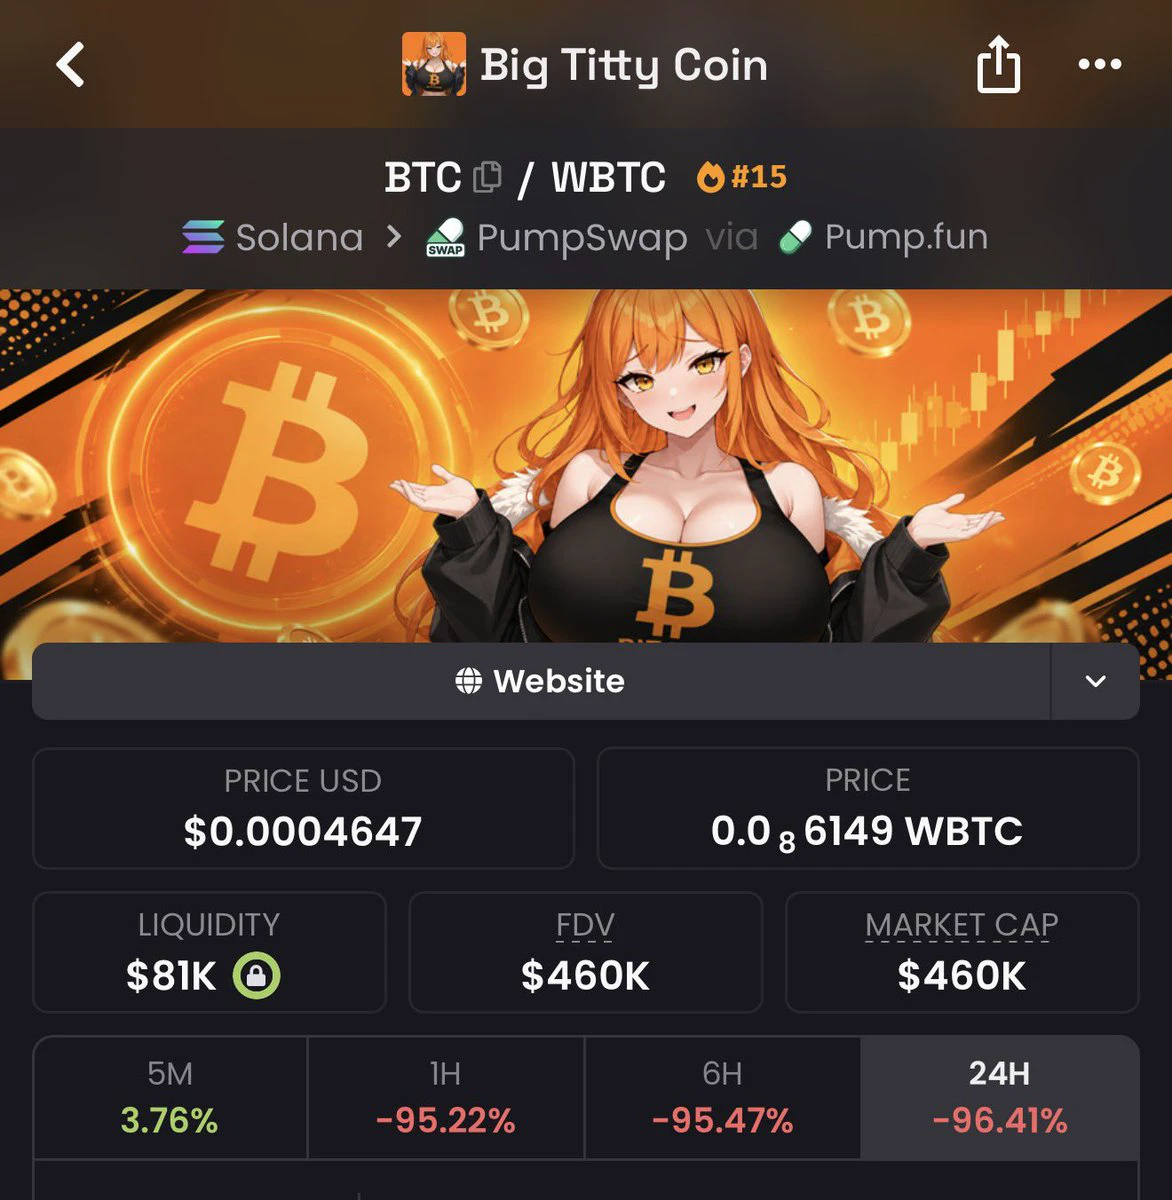
Slingoor nuked his bundle on LMFAO and big titty coin
Was just calling out Ansem for dumping on his followers and look what he does
Never trust a KOL….including me
Get your money and get the fuck outta here 🚶🏾‍♂️🚶🏾‍♂️🚶🏾‍♂️🚶🏾‍♂️🚶🏾‍♂️🚶🏾‍♂️🚶🏾‍♂️
ANSEM-4.82%
one step closer to the end of these markets 😭
post-image
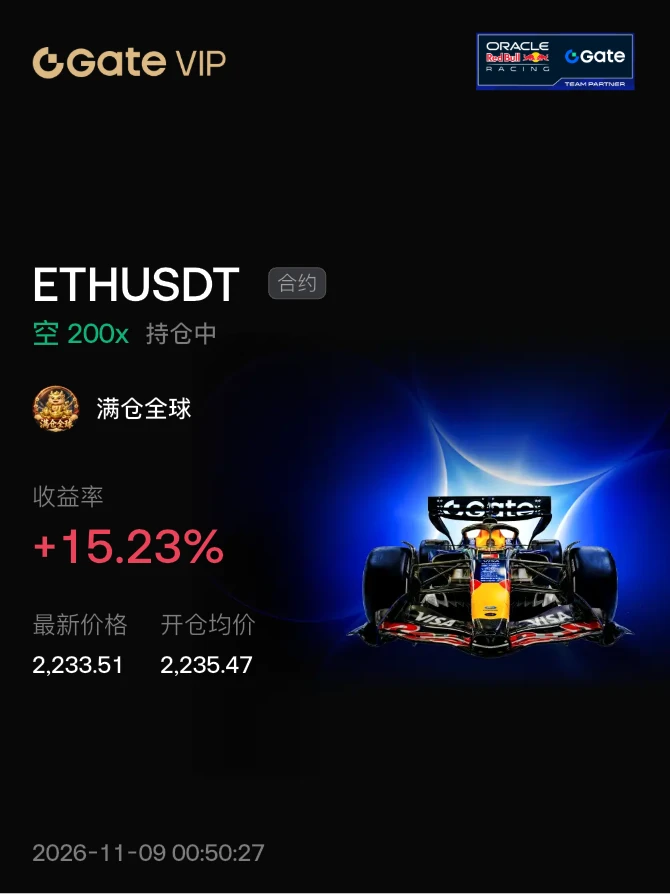
#晒出我的持仓收益 Temporarily opened, live now: Ether (ETH)
post-image
ETH-1.26%
Gate Futures Points Airdrop Phase 165

https://www.gate.com/share/act/946a58bd
post-image
AIRDROP+0.00%
  • 1
$GNS pumps 50% in a single candle 🔥Yesterday was about $ONE and today is about $GNSCongratulations 🎉 if you bought some when I called it yesterdayLike 👍 this post if you are bullishGNSPriceAnalysis
post-image
GNS-6.46%
ONE-1.19%
Just a heads-up, everyone: be careful, as what comes next could be like 2022.5.4; short positions can be held with conviction
#70%OfAltcoinsFallBelow200DMA
70% of Altcoins Fall Below the 200-Day Moving Average: Is the Altcoin Market Facing a Major Turning Point?
The cryptocurrency market is sending an important warning signal as approximately 70% of altcoins have reportedly fallen below their 200-day moving average (200 DMA). This development highlights the growing weakness across the altcoin market and raises important questions about investor confidence, market momentum, and the possibility of further downside.
The 200-day moving average is one of the most widely followed technical indicators in financial markets
BTC-0.67%
STABLE-1.39%
$ON What does this coin want from us? $ON is driving us crazy.🤔
post-image
ON+4.77%
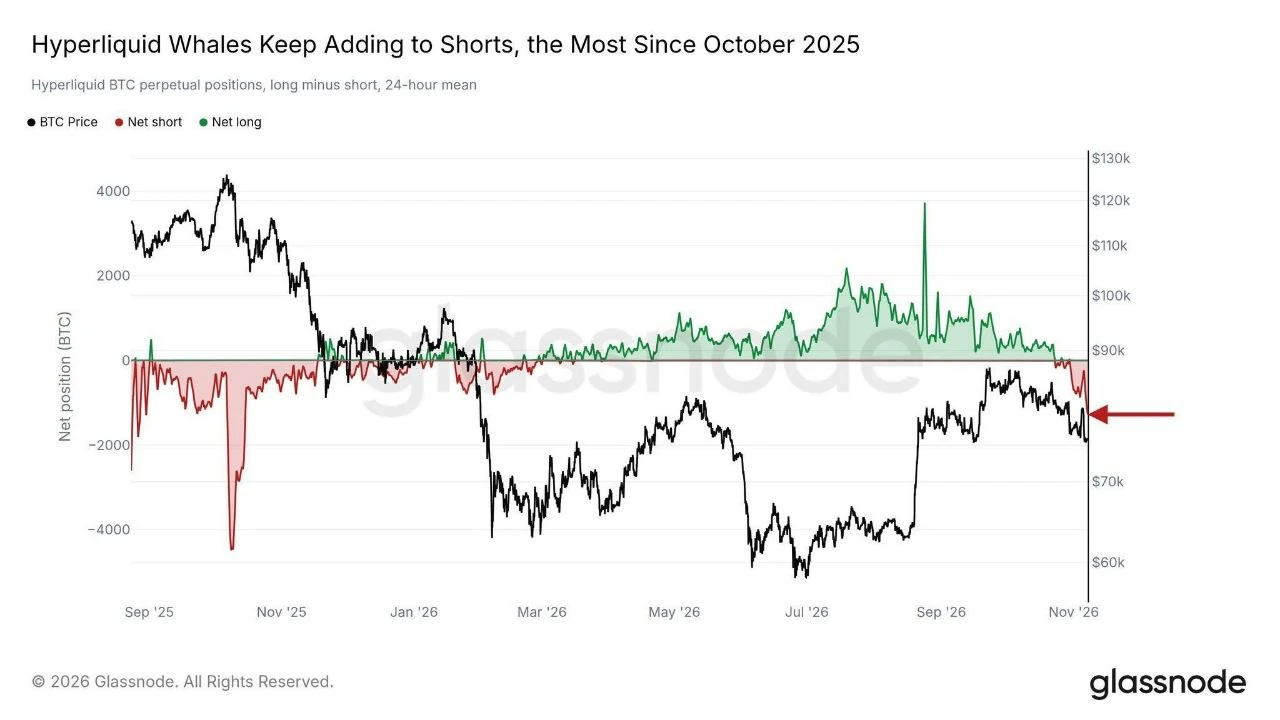
Hyperliquid whales are turning bearish on $BTC

According to Glassnode, large traders have flipped from net long to net short for the first time in seven months, with short exposure reaching its highest level since October 2025.

This is a notable shift in positioning and suggests growing bearish conviction among large traders.

Worth watching how BTC reacts as short pressure builds. The next move could be interesting.

#USCPIDataIncoming #GateGuardNowAvailableForFree
post-image
BTC-0.67%
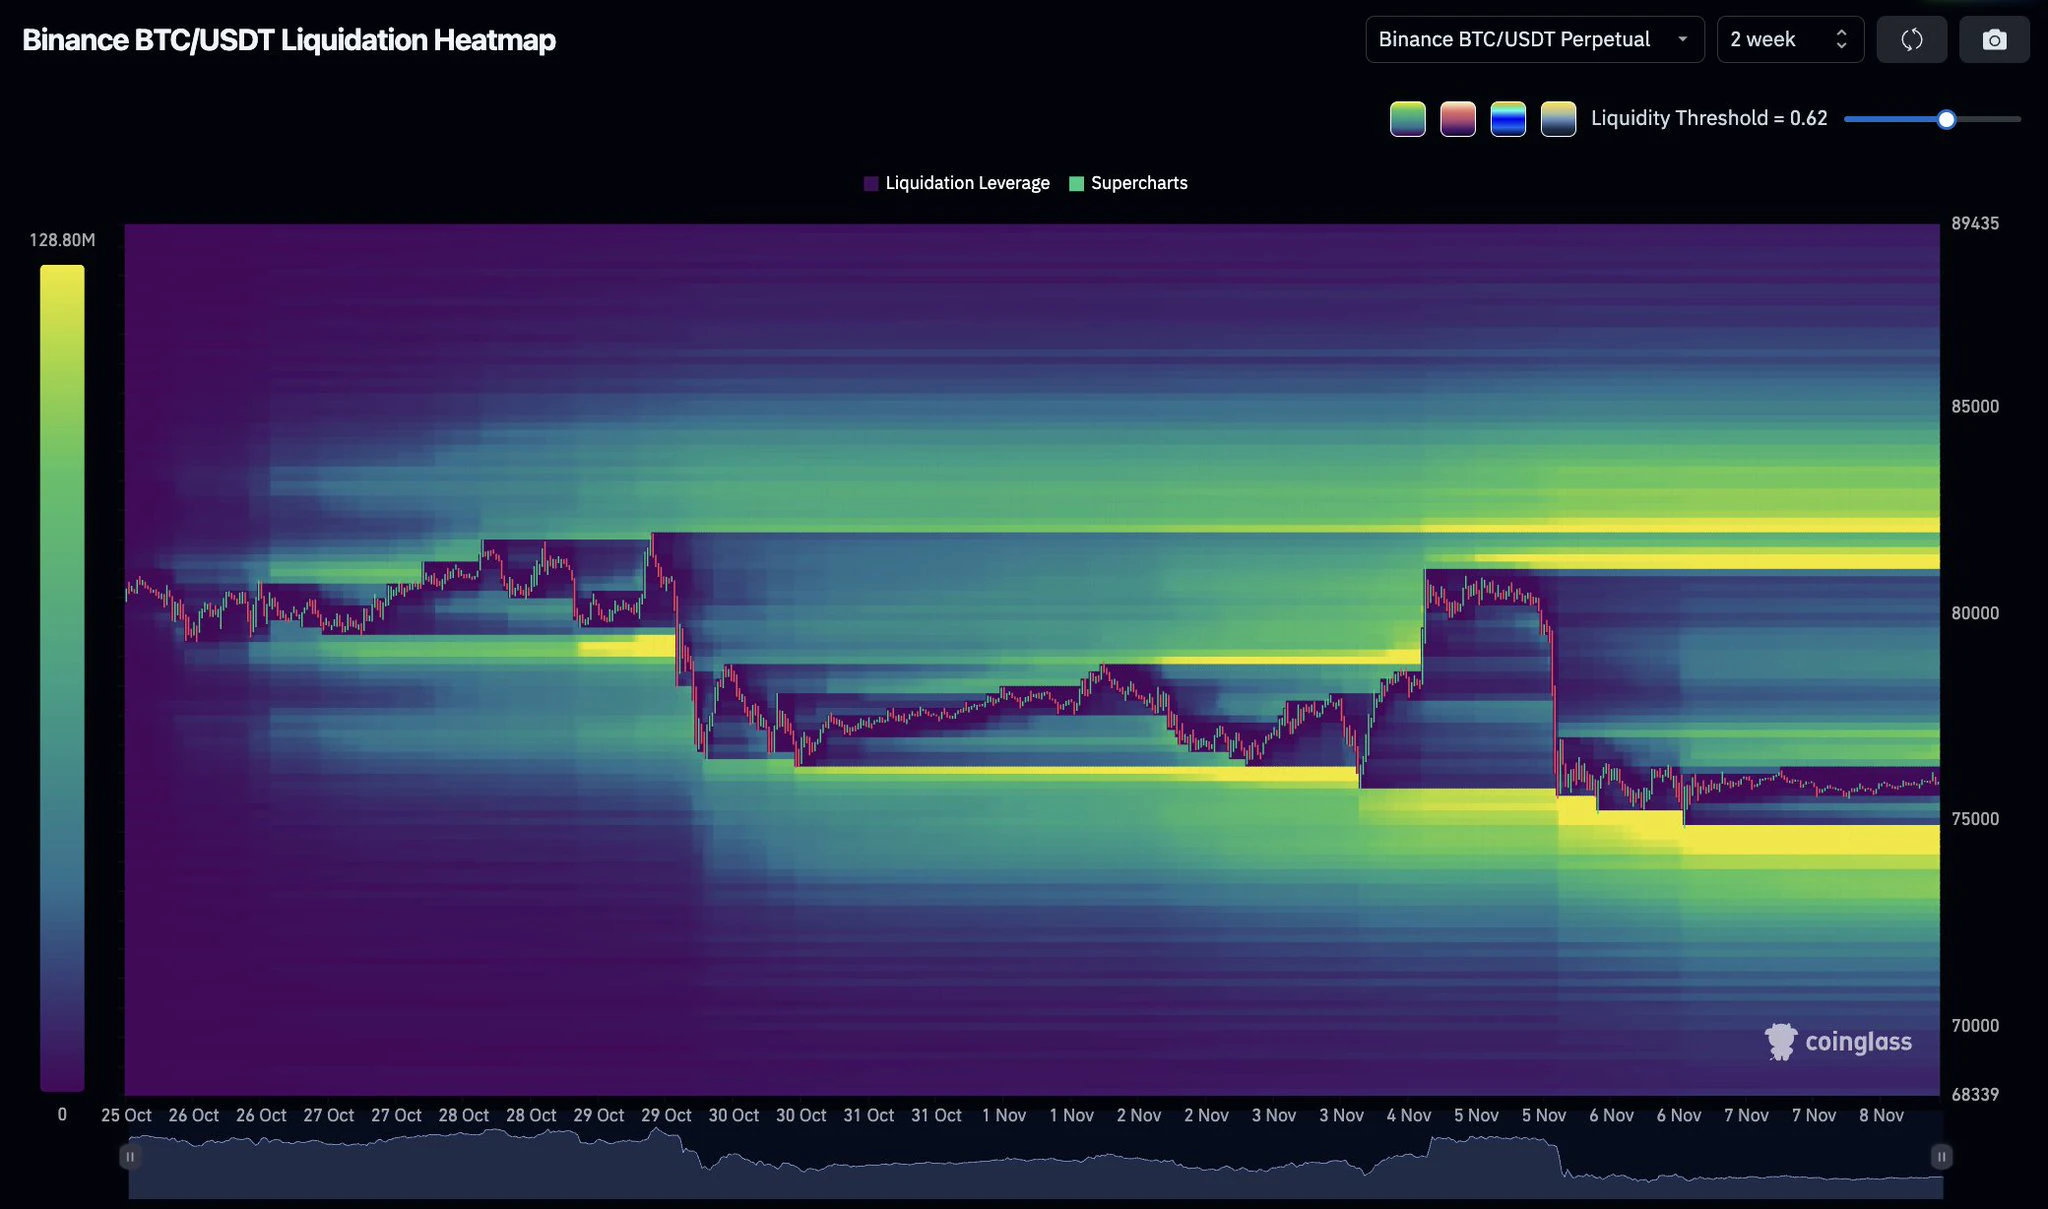
$BTC is near $76,000 with major liquidation clusters on BOTH sides.

Longs around $74,000 to $75,000.
Shorts around $81,000 to $82,000.

Which side gets swept first? 👇

#USCPIDataIncoming
#USAIStocksHitHard
post-image
BTC-0.65%
The most easily overlooked cost in crypto: attention.

BTC and ETH prices are moving, and your attention is being fragmented too:
checking prices, reading group chats, chasing trends, then refreshing once more.

After a busy day, it feels like you’ve seen everything, yet you can’t say which logic you actually believe in.

More information doesn’t necessarily mean you see things more clearly. Sometimes it just means your emotions shift faster.

When you spend the longest time watching the market, is the market clearest—or are you feeling the least sure?

‍#BTC #ETH
post-image
BTC-0.67%
ETH-1.26%
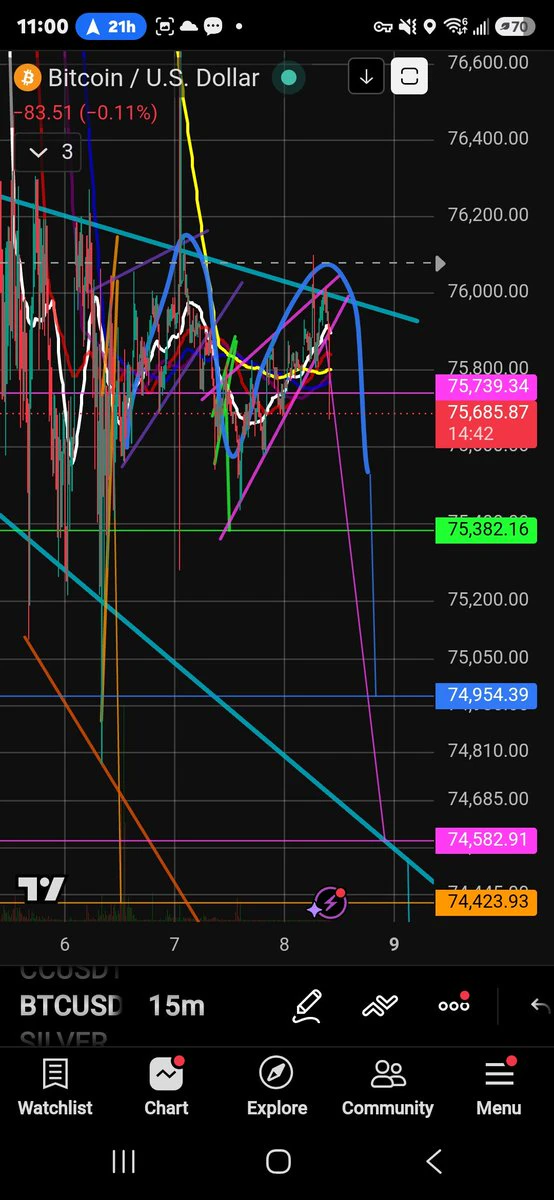
$BTC Breaking Downwards From The Pink Rising Wedge As Projected
Yes the chart is definitely messy. I understand. 💯
All of the patterns and measured moves play a role in price action.
I used to constantly clean the charts. Then I started to let it go.
This is when I realized how connected it all really is!
Nothing is ever financial advice.
I look at thing different than most.
My Goal Is To Learn And Teach The Symbiotic Nature Of The Charts.
#BTC #Crypto #Trading
post-image
BTC-0.67%
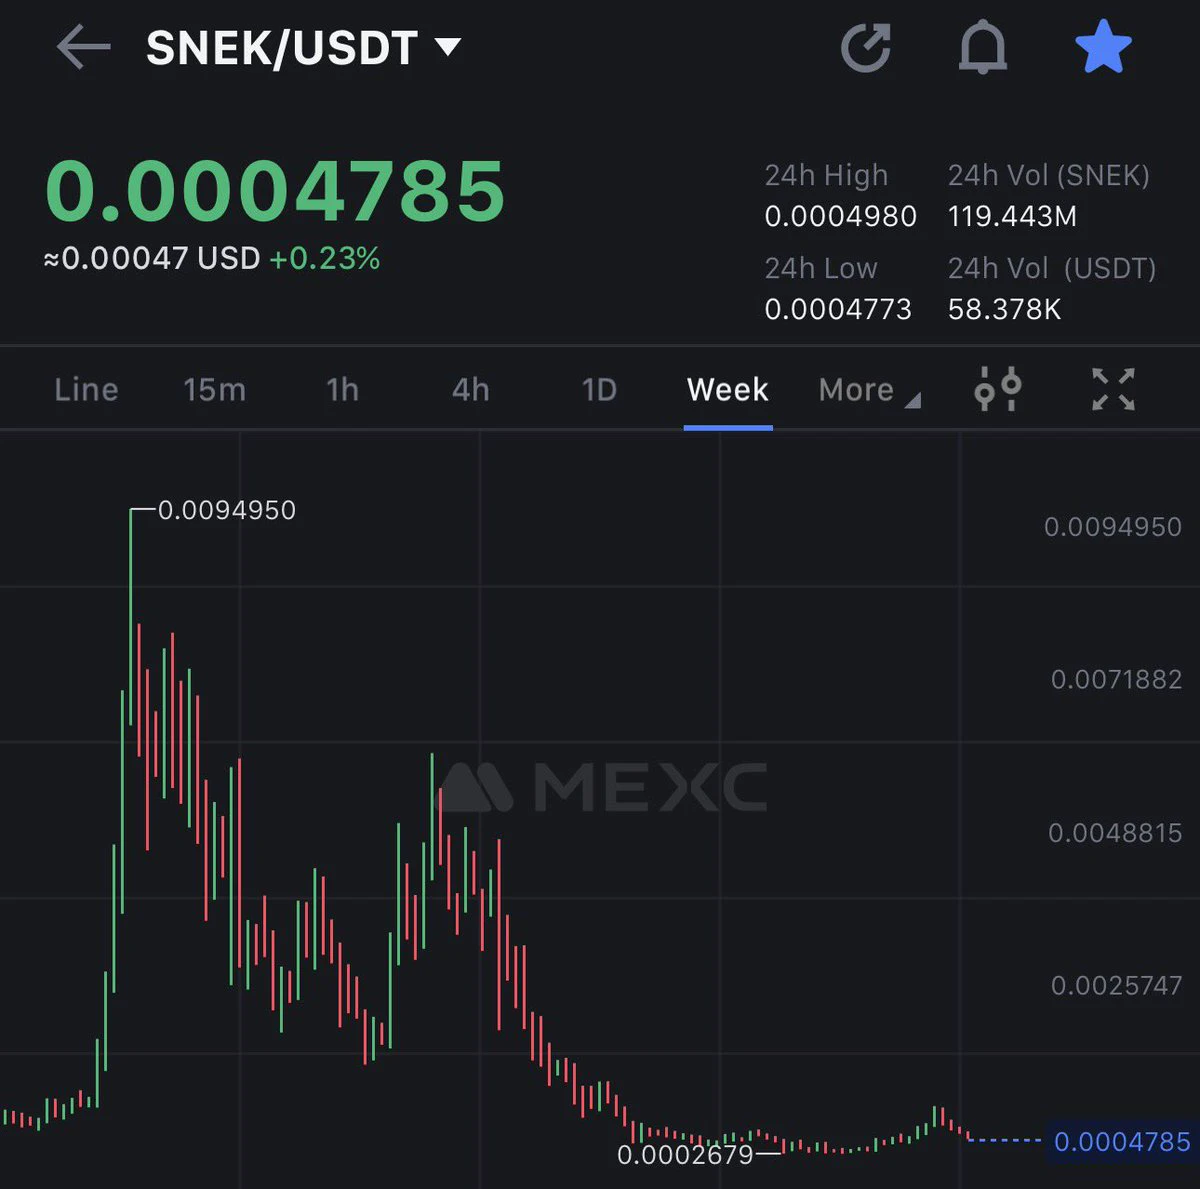
MAXBID $SNEK
can it go lower? Sure if market nukes.
But upside potential is 100x.
post-image
SNEK-1.65%
Prediction markets assign a 52 probability that Bitcoin will rise to $70,000 by the end of 2026
live-cover
LIVE2,143
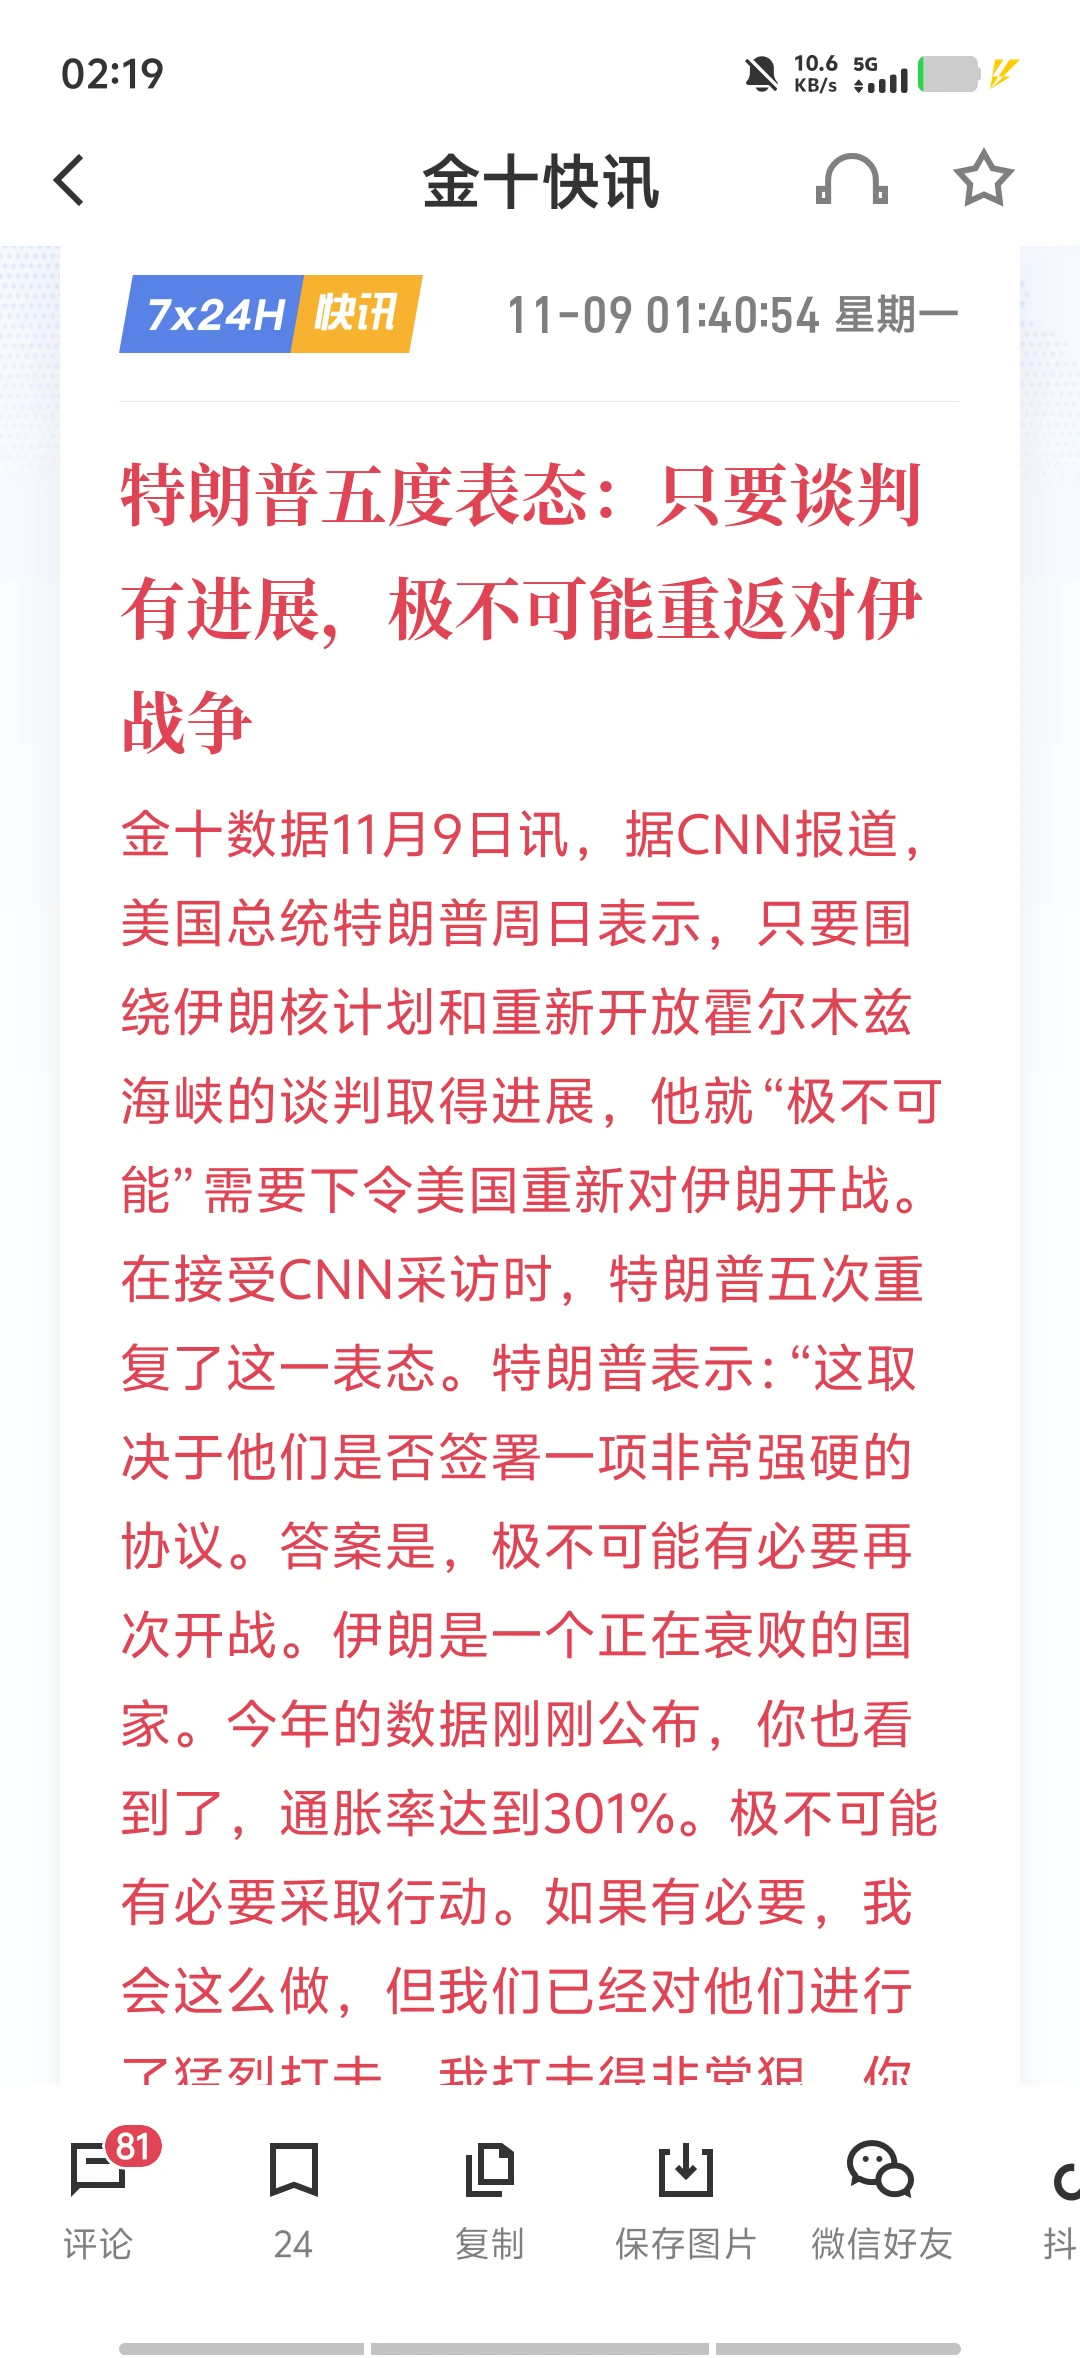
Damn, I just closed my crude oil short and you drop bearish news? Trump, you really know how to draw the K-line. I'm done with this; never trading energy again, damn it😭$ETH $SOXL $KORU ‌ ‌ ‌
post-image
ETH-1.23%
SOXL-1.16%
KORU-1.22%
  • 8
🚀 JCT/USDT Perpetual Market Breakdown: Massive Momentum Surge!

The market is witnessing an extraordinary price action update on JCT/USDT, capturing massive attention across Gate.io Square with an explosive breakout. Here is a comprehensive technical and data-driven analysis of the current market dynamics:

📊 Key Market Statistics
Last Price: ~$0.011059

24h Change: +284.93% surge

24h High: $0.014795

24h Low: $0.002514

24h Volume (JCT): 10.32B

24h Turnover (USDT): $114.18M

📈 Technical Analysis & Price Action
Parabolic Breakout: JCT has broken out significantly from it
JCT-3.26%
Load More

Join 40 M users in our growing community

⚡️ Join 40 M users in the crypto craze discussion

💬 Engage with your favorite top creators

👍 See what interests you

Trending Topics

USCPIDataIncoming

13.55k Views1.64k Discussing

The U.S. October CPI report will be released on November 10 at 8:30 a.m. ET. September CPI came in at 3.7% year over year, and markets will be watching closely for signs that inflation is cooling, especially in core CPI. A softer-than-expected reading could strengthen rate-cut expectations, while hotter inflation may pressure risk assets through higher Treasury yields and a stronger dollar. How do you think this CPI print will move $BTC, U.S. stocks and gold?

USAIStocksHitHard

28.45k Views3.74k Discussing

USNonfarmPayrolls

54.47k Views4.49k Discussing
View More