Square
Following
Hot
News
Notifications
Profile
Share your thoughts
placeholder
Article
#SK海力士跌近7% #ShareWeekly

SK Hynix Drops Nearly 7%: Is This a Temporary Market Correction or a Warning Sign for the AI Boom?

The recent decline in semiconductor stocks has created fresh uncertainty across global financial markets. On November 5, 2026, SK Hynix shares dropped approximately 6.7%, while Samsung Electronics also recorded a decline of nearly 6%. At first glance, this movement may look like a serious setback for the AI and memory chip industries. However, looking beyond the daily price action reveals a more complicated picture.

In my view, the latest sell-off is more closely conne
BTW | Long 🟢 | Bullish | 15m 24h: +13.96% | Volume: 39.9M USDT. Long rationale: Price above EMA200; EMA20/50/200 in bullish alignment; RSI14 at 63.5; MACD histogram positive; ADX14 at 31.8; volume is 1.52 times the 20-candle average; breakout from the 20-candle range. Entry: 1.164 Stop-loss: 1.0899 Take-profit 1: 1.25662 | Take-profit 2: 1.3122 | Take-profit 3: 1.3863. Entry price is for reference only; do not chase the price. The trade setup is invalidated if the stop-loss level is hit. Technical analysis only; not investment advice. $BTW
post-image
BTW-7.42%
Trenches
ZIG
Z
bade
b
ZIG
0x8c...1145
Market Cap
$.
Change
.
24h Vol
$.
Holders
.
BTC
B
bade
b
BTC
C5xp...pump
Market Cap
$.
Change
.
24h Vol
$.
Holders
.
CORLA
C
bade
b
CORLA
0xba...7777
Market Cap
$.
Change
.
24h Vol
$.
Holders
.
STONK
S
bade
b
STONK
6GmA...UNgx
Market Cap
$.
Change
.
24h Vol
$.
Holders
.
DESSA
D
bade
b
DESSA
npz2...pump
Market Cap
$.
Change
.
24h Vol
$.
Holders
.
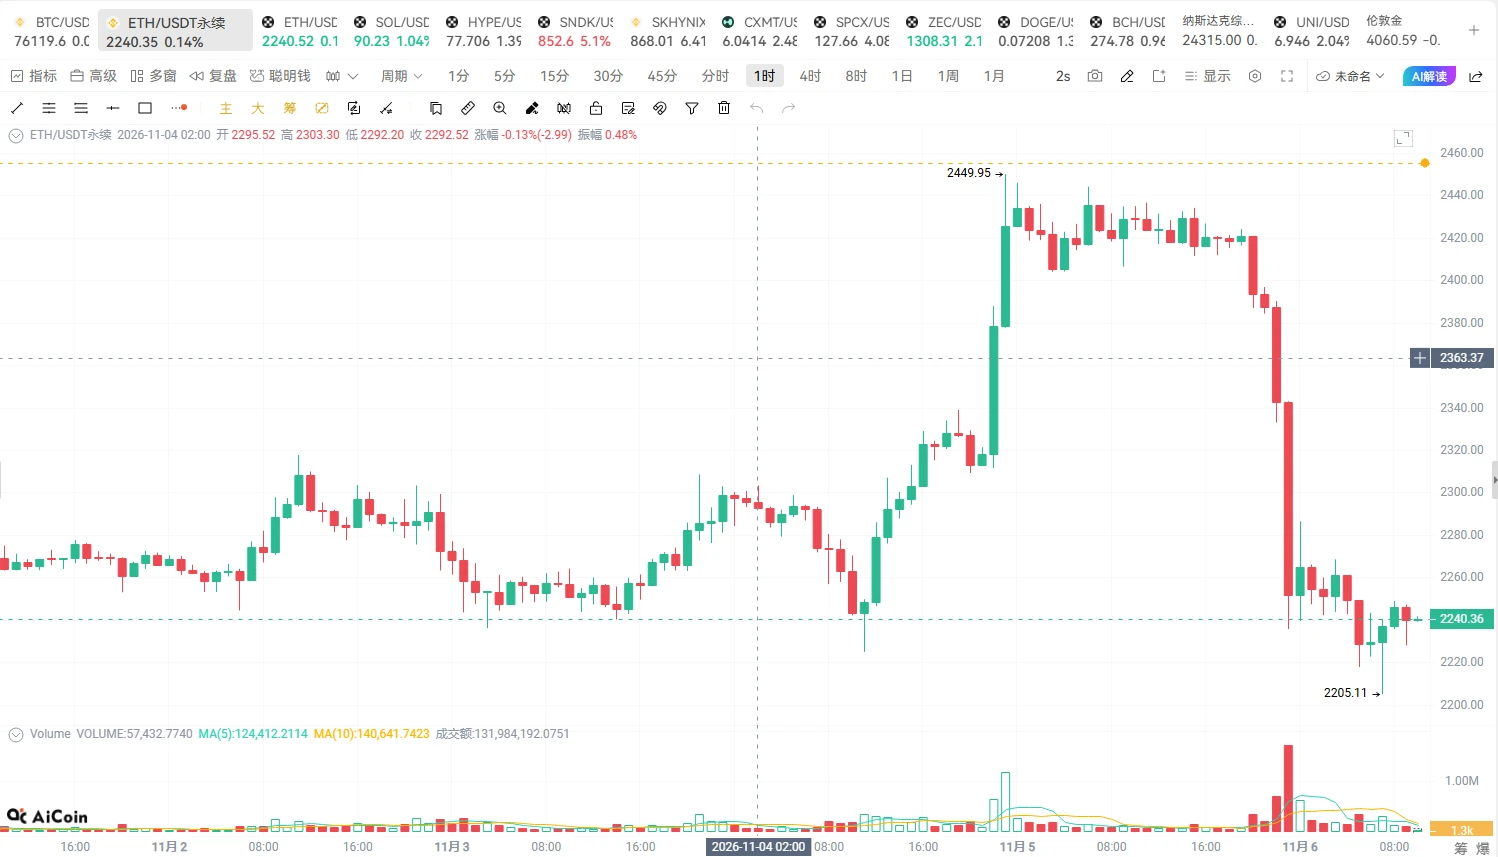
ETH | November 6: Today's plan

Today, continue to focus on shorting rallies; no longs for now.

Short at 2255–2275, stop-loss at 2300, target 2180–2205.

If the rebound is weak and faces resistance near 2255, consider building a position in batches.

If it breaks below 2200, look for 2170–2150.

Macro and rationale:

ETH fell rapidly from around 2449, hitting a low of 2205. The previous uptrend structure has already been broken.

The price is currently moving sideways at low levels, but no clear reversal structure has formed yet. With global risk assets weakening, ETH also lacks the condition
post-image
BTC-0.65%
ETH-1.23%
💰 Your stock insights deserve rewards—and to be seen
What signals do you look for when you’re bullish on a company? What concerns make you decide to keep waiting?

Join Gate Square’s stock discussion season to share your views and the reasoning behind them.
🌟 Each day, 3 quality creators will be selected to receive 5 USDT each, plus official featured placement to help more people see their valuable content.

Selection isn’t based on correctly predicting price movements or the number of posts. Well-supported opinions, valuable observations, and thoughtful reviews all have a chance to be selec
post-image
  • 6
  • 3
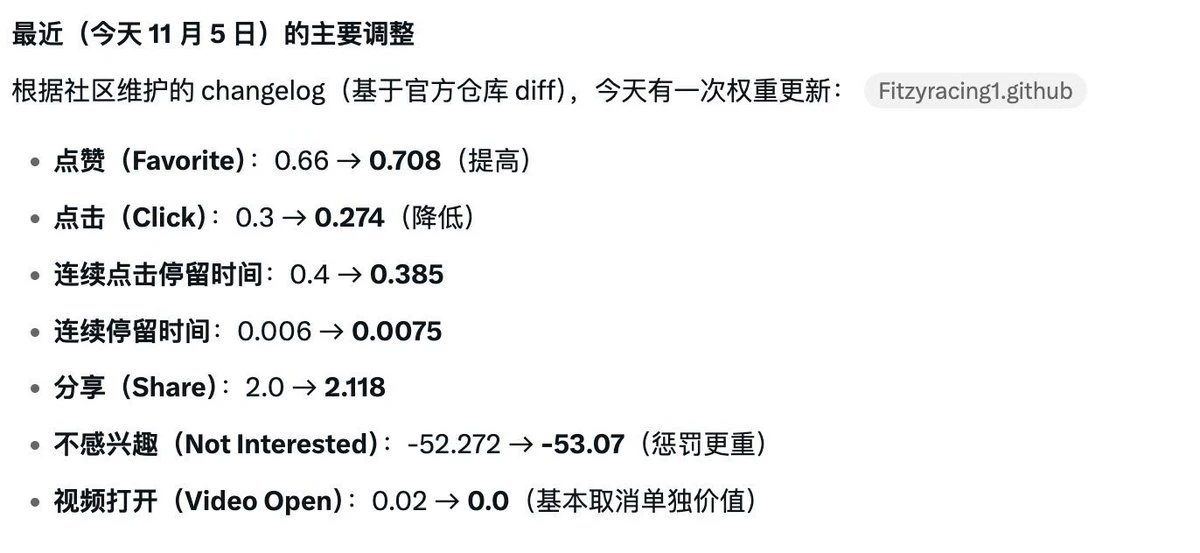
Big news!!
The official team has increased the weight of likes!
As someone who doesn’t like liking posts, I’ll need to adjust my strategy!
💪💪
post-image
#Gate上线台股交易 The Stock Contract Market Is Growing Faster Than Its Risk Controls
Gate says its stock contract lineup now covers more than 500 stocks, spanning US, Hong Kong, Korean, Japanese and Taiwanese names. It also reports that SPCX, SKHYNIX, SNDK and SOXL rank near the top for open interest, and that a first batch of 40 assets is live in its Innovation Zone with leverage up to 75x. I could not independently verify those figures, so treat them as Gate's own claims. The bigger question is what that growth means for risk.

The price action that makes the question urgent

The feed's 5 November
SPCX+0.20%
SKHYNIX+1.41%
SNDK-22.24%
NVDA-9.33%
  • 3
From Understanding to Action: Building Your Own Web3 Risk Assessment Framework

Today, we discussed many questions around digital asset sovereignty, private keys, smart contracts, on-chain restrictions, administrator privileges, open-source code, security audits, and project transparency.

These questions may seem unrelated, but they all point to the same core issue:

In the Web3 world, how can we gradually develop the ability to assess risks for ourselves, rather than relying on other people’s conclusions?

I believe what truly matters is not how many technical terms we can remember, but know
post-image
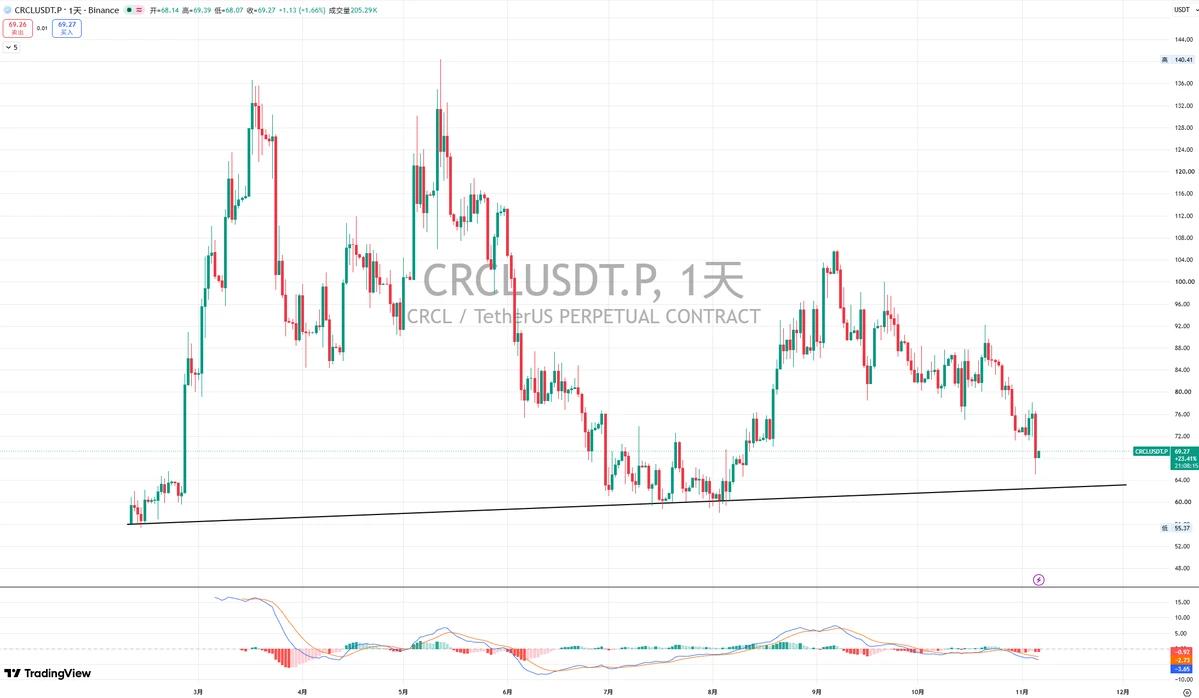
$CRCL
CRCL, the parent company of the USDC stablecoin
After following this wave of declines, it has finally reached the ideal entry range of 68–65 that I mentioned in October! The short-term low was 64.8. I’m not sure whether it will fall further, but this is a great buying range!
Enter a long-term position and be prepared to hold it for the long term!
post-image
CRCL-8.69%
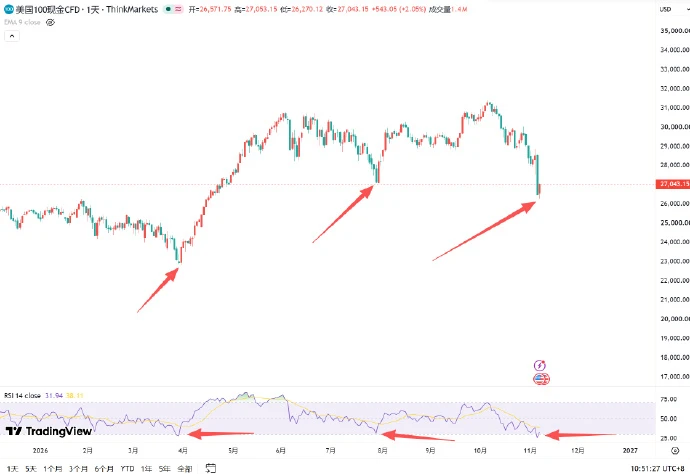
#纳指# Add to the position. An 80% chance of buying the bottom, and a 20% chance of buying halfway up.
post-image
NAS100-0.07%
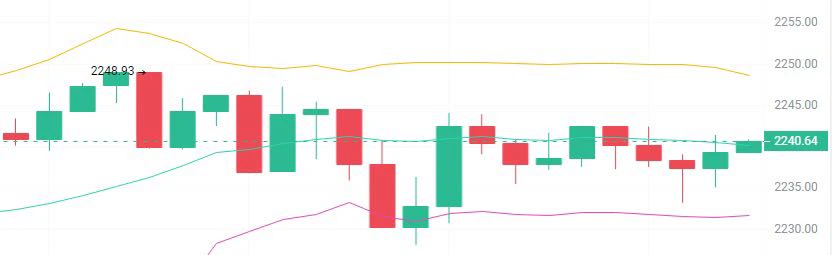
ETH Strategy This Morning

Trade:
Short around 2250-2270
First target: 2230-2210
Second target: 2190-2160
Use a stop-loss

ETH is in a downtrend, and the current move is only a weak recovery after a sharp drop. The rebound is meeting resistance at the middle band, while the weak MACD golden cross signals a continuation of the downtrend. The strategy is to firmly avoid chasing the drop and wait for a failed rebound, with gains stalling and a bearish close, before testing a short position with light size. Targets are the lower band and the previous low; keep the stop strictly above the previous
post-image
ETH-1.23%
How to Take Profits in a Bull Market: A Simple, Practical Strategy!

During a BTC rally, many traders face a difficult question: when should they sell? Sell too early, and they worry about missing further gains; sell too late, and they may watch their gains gradually disappear. Instead of trying to sell at the exact peak, it’s better to make a plan to take profits in stages in advance.

First, set profit targets ahead of time. Before entering a position, plan your profit-taking levels for different stages based on your entry price, risk tolerance, and market structure. Don’t wait until the pri
post-image
BTC-0.67%
CZ was pardoned by Trump, and he thought his legal troubles with the U.S. were over. But just as he turned around, he became a focus of the Democrats’ investigation.

With the Democrats gaining ground in the midterm elections, Congress is likely to subject the pardon to stricter scrutiny. The Trump family’s business dealings with the crypto industry will be impossible to avoid.

Of course, being investigated does not mean the pardon will be overturned. But once the investigation gets underway, he will still have to bear the legal and public-opinion pressure.

What’s really worth considering is
post-image
  • 5
Tongge’s 11.6 BTC outlook
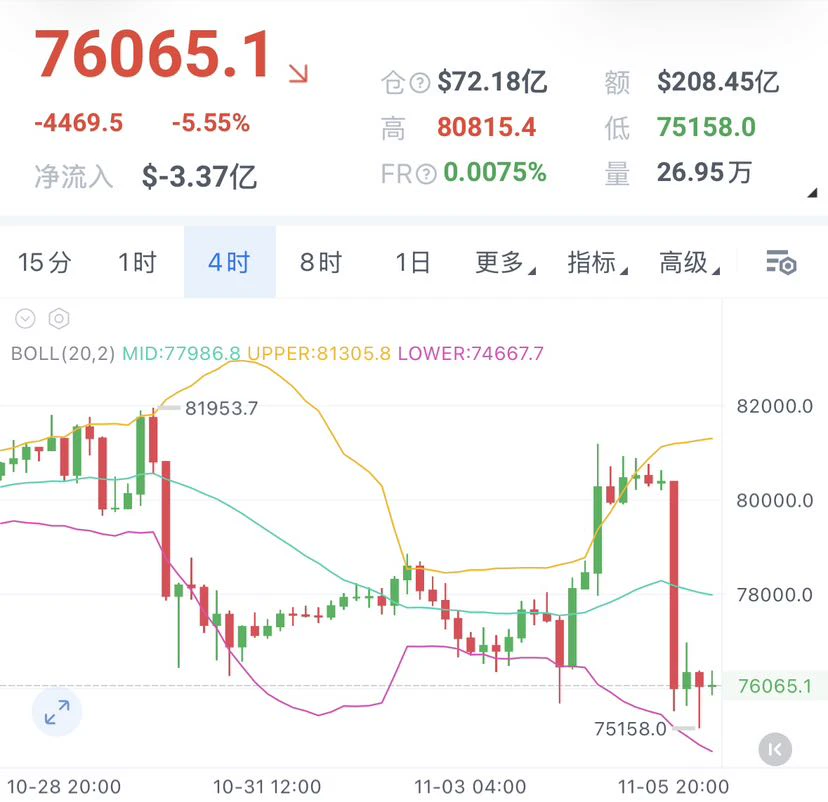
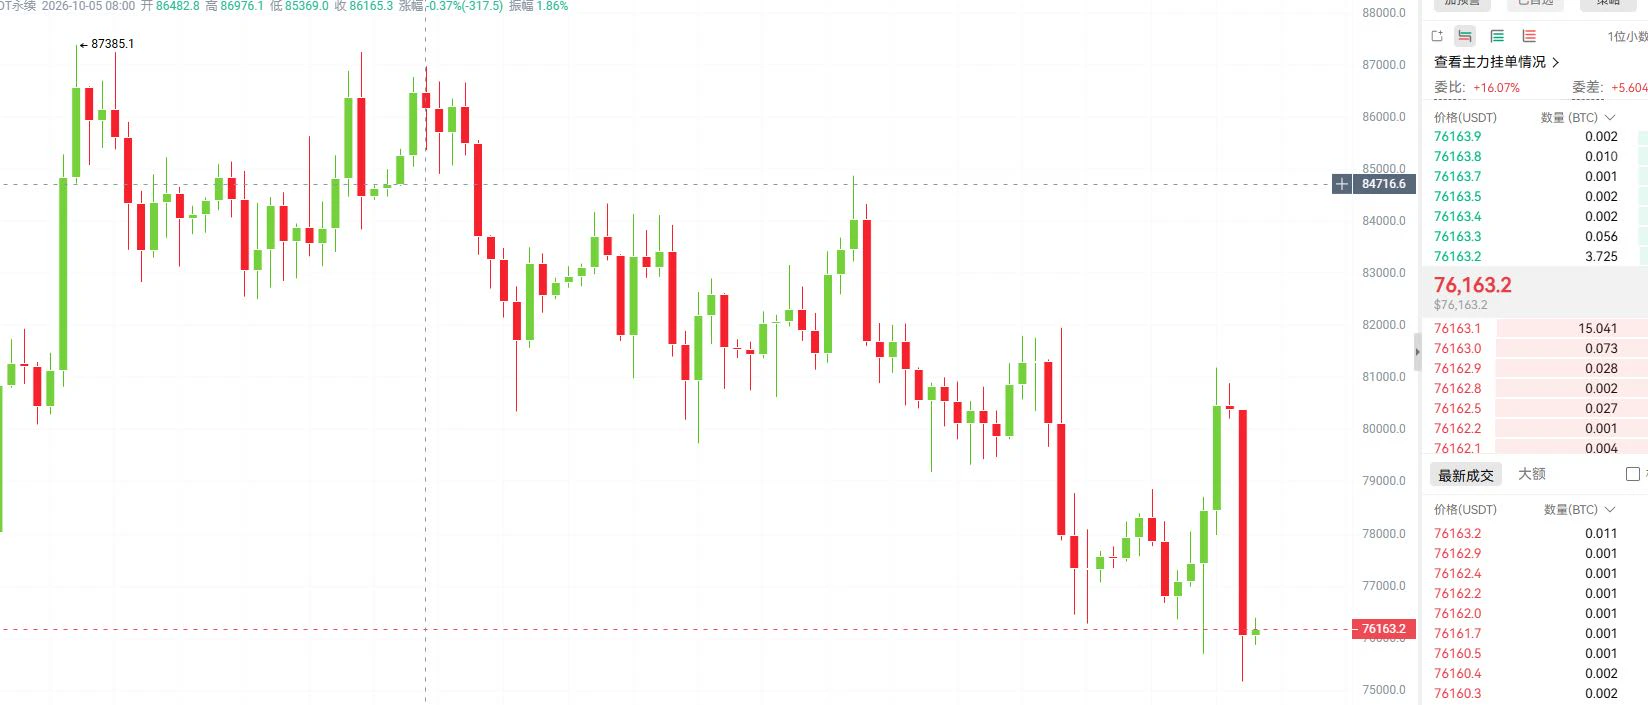
$BTC Enter short near 765–770, stop loss at 775, targets 755-751-745-740.

Up 5,000 one day, down 5,000 the next. Yesterday, the price surged to a high of 81188; today, it plunged to a low of 75158. In just two days, it traced out an almost 10,000-point A-shaped crash. Yesterday, everyone was touting the election as good news; today, the market has changed its tune.

The trigger for the sell-off was the market’s growing concern, after Democrats won the midterm elections, that AI regulation would tighten and data center construction would slow. The Nasdaq plunged 5.5%
post-image
BTC-0.65%
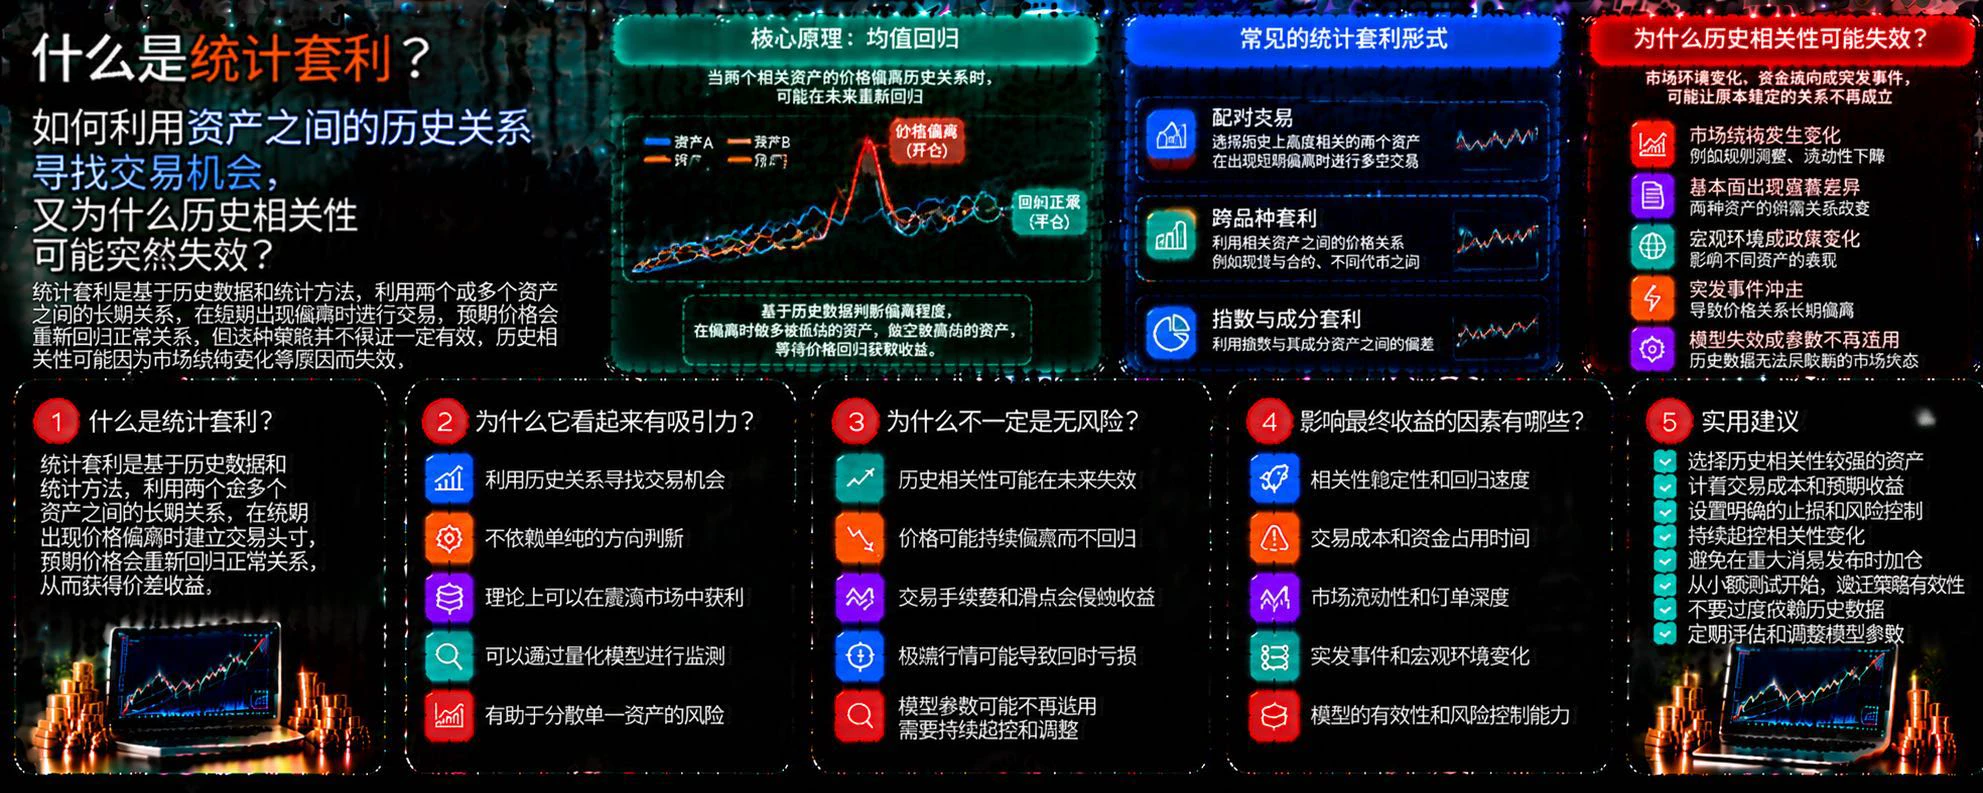
What Is Statistical Arbitrage? How Can Historical Relationships Between Assets Reveal Trading Opportunities, and Why Might Historical Correlations Suddenly Break Down?

In cryptocurrency markets, some assets have long shown similar price movements. When their historical relationship temporarily diverges, traders may try to exploit the deviation. This is the basic idea behind statistical arbitrage, but historical patterns are no guarantee of future repetition.

First, what is statistical arbitrage?

Statistical arbitrage is a type of trading strategy that uses historical data, statistical model
post-image
#USStocksFaceHistoricSelloff Wall Street had its roughest day in months on 5 November, and the damage was concentrated in the names that carried the AI rally. Closing prints from the Gate feed show the S&P 500 ETF (SPY) at $733.00, down 4.41%, and the Nasdaq 100 ETF (QQQ) at $647.05, down 6.49%. Reuters reported that the Nasdaq 100 fell 6.4% and erased about $2.5 trillion in market value, its deepest one-day drop since "Liberation Day" in April 2025. The sell-off started after the midterm results, when investors began to question how much of the AI data-center buildout could survive a Democrat
  • 1
  • 1
🔹Why Did U.S. Stocks Suddenly Plunge at the Open? Sell Orders Flood In While Buyers Struggle to Kee
live-cover
LIVE2,550
11.06 SOL Market Analysis

Short: around 91.50-92.00, stop-loss at 93.20, targets 89.50/88.30.

SOL is currently at 90.24. After a sharp drop from a high of 98.12 to 88.30, the market is now moving sideways weakly near the lows. The moving averages remain in a downward alignment, and rebound momentum is extremely weak. The overall bearish trend remains unchanged.

The 91.50-92.00 area above is both a secondary consolidation platform from the previous decline and a resistance zone aligned with the 1-hour EMA10 and EMA20. Chasing shorts directly at this stage offers limited room, so the strategy
post-image
SOL-0.74%
Scumbag’s SPCX Update 11.06
The big rocket closed at 123.62 in Thursday’s U.S. stock market, down 9.05%. It hit an intraday high of 131.87 and a low of 120.39.
U.S. stocks were really in a state of panic yesterday. The Democrats’ proposal reminded Scumbag of a Chinese saying: “Stop eating for fear of choking.”
Looking at the big rocket’s candlestick chart, it has now fallen below the uptrend line and is searching for a bottom. Scumbag picked up a position around 125, but didn’t expect it to dip to around 120.
It’s hard to say where the bottom will be, but Scumbag can only say that SPCX below 1
SPCX-9.15%
CRYPTO MARKET UPDATE
live-cover
LIVE1,190
U Jie 11.6 Friday $BTC Strategy

Entry: Short near 76800‑77100 on a rebound
Stop-loss: Above 77800
Targets: 75800‑74700
Go long near 75000 if it stabilizes on a retest
Stop-loss: Below 74500
Targets: 76000‑76600

On the daily timeframe, a sustained decline began from the high of 84875. The overall trend remains bearish, with rebounds along the way failing to break through overhead resistance before facing renewed pressure and pulling back. After dipping to a low of 75158 yesterday, the price recovered slightly and is now in a weak consolidation phase following the sharp drop. The rebound is a
post-image
BTC-0.65%
Load More

Join 40 M users in our growing community

⚡️ Join 40 M users in the crypto craze discussion

💬 Engage with your favorite top creators

👍 See what interests you

Trending Topics

USStocksFaceHistoricSelloff

586 Views3.47k Discussing

U.S. stocks suffered a sharp selloff on Thursday, with the Nasdaq closing down more than 5% and the Philadelphia Semiconductor Index falling over 12%. AI and chip stocks including $NVDA and $AMD were hit especially hard. Markets are reassessing AI valuations, data-center spending and future returns. Is this just short-term deleveraging, or the start of a deeper correction in the AI trade? Which sectors are you watching next?

GateLaunchesPoSECProofOfSecurity

11.51k Views568 Discussing

USNonfarmPayrolls

8.95k Views3.98k Discussing

View More