







Share your thoughts
placeholder
Article
Crypto Signals and Trding Insights
live-cover
LIVE1,382
Everyone’s staring at SOL’s 103 handle—but the real trap is hiding in the 4-hour timeframe.

$SOL /USDT - SHORT

Trade Plan:
Entry: 103.20 – 103.54
SL: 105.02
TP1: 102.14
TP2: 101.31
TP3: 100.08

Why this setup?
Why now? The 1D is range-bound, but the 4h bias just flipped SHORT with 55% conviction. RSI on the 15m sits at 52—no momentum rescue. ATR (1h) is thin at 0.68, meaning price can slide quietly toward TP1 (102.14) and TP2 (101.31) without loud volume. Entry zone is tight: 103.20–103.54. If we lose 102.50, the setup invalidates fast—so this is a scalper’s window, not a swing.

Debate:
SOL+1.58%
JUST IN: No fact pattern available from the provided link. Please paste the key alert or summarize the alert you want transformed.
post-image
K-line: After a huge-volume long bearish candle on the 4-hour chart, the price consolidated at low levels, closing near the low, with bears in control; the daily chart shows a bearish candle with long upper and lower shadows, as bulls faced selling pressure.
· Indicators: The 4-hour MACD is about to form a death cross, RSI has fallen from overbought territory to below 50, EMA7 has crossed below EMA30, and the price has broken below EMA7/30, with the moving averages forming resistance.
· Volume: Volume has contracted significantly after the huge-volume decline, indicating insufficient buying, w
BTC+0.30%
ETH+1.21%
HK50+0.92%
I had just switched the app to the background when it suddenly popped back up—are you playing hide-and-seek with me? I wasn't expecting much from this move, but $ARB really knows how to surprise people.

Luckily, I hadn't canceled the order I placed before bed a few days ago, and it steadily caught the price around 0.10885. At the time, I saw it forming a bottom without breaking down, while funds were quietly flowing in, so I knew this level would most likely deliver an answer. Looking again today, the current price has already shot up to 0.1787, with a +3689.72% return sitting there—it compl
post-image
ARB+41.58%
ETH+1.21%
ADA+3.65%
Everyone’s staring at HYPE’s 4h breakout, but the 15m RSI whispered something they missed.

$HYPE /USDT - LONG

Trade Plan:
Entry: 85.065 – 85.369
SL: 83.755
TP1: 86.314
TP2: 87.045
TP3: 88.142

Why this setup?
Why now? The 1D trend is bullish, yet the 15m RSI (43.91) shows a coiled spring—not exhaustion. With ATR at 0.609 on 1h, volatility is priming for a squeeze. Entry zone 85.065–85.369 is the last cheap ticket before TP1 at 86.314. Confidence at 95 means the market is begging for a long, but only if you respect the 83.755 invalidation.

Debate:
Is this dip to 85.2 the gift, or are we
HYPE+1.09%
K-line pattern: The recent price rebounded sharply from the low of 62,508.3, reaching a high of 82,279.9, and currently stands at 79,874.2, consolidating at elevated levels. The latest candlestick has a relatively small body, with its upper shadow near the previous high, indicating selling pressure overhead.
· Technical indicators
· MACD: DIF (3,246.0) is below DEA (3,423.8), with a negative histogram value (-355.6). A death cross has formed, indicating weakening upward momentum and pullback pressure.
· KDJ: The K value is 87.3 and the D value is 86.9, both in the overbought zone (>80), in
AI
Which company has the best Code Arena WebDev AI model end of September?
OpenAI
76%1.32x
Anthropic
24%4.17x
$14.89K 24H+14 more
BTC+0.30%
ETH+1.21%
$MU $SNDK $EWY $DRAM closed the week with a BREAKOUT 💥
MU+5.89%
SNDK+11.88%
This return is making me feel anxious, afraid the market will catch on tomorrow and blacklist me. When it plunged intraday, $IN ’s rebounds grew weaker each time, with heavy resistance overhead. I opened a short position around 0.09355, set my protection, and watched the show.
Now at 0.03454, +3036.7% is sitting in my account. If you’re not confident in a token, taking a look keeps you clear-headed; buying a position makes you foolish. I took this move cleanly 🕶️.
Here’s the take-profit plan for everyone: bank 80% first, and move the stop-loss on the remaining 20% to the entry price. Let it r
post-image
IN+1.60%
ZEC+1.59%
SOL+1.58%
Most traders will fade this silver short at 66.22—that's exactly why it works.

$XAG /USDT - SHORT

Trade Plan:
Entry: 66.19 – 66.25
SL: 66.49
TP1: 66.02
TP2: 65.88
TP3: 65.68

Why this setup?
Why now? The 4h frame is screaming exhaustion while the daily sits dead-center in a range. RSI on the 15m is already at 34.69—momentum is bleeding, not bouncing. The setup is armed with tight risk: entry 66.22, invalidation just 0.57 above at 66.79. That's a 1:3+ reward-to-risk to TP2 at 65.88. The range top is rejected; the path of least resistance is down.

Debate:
If silver closes back above 66.49
XAG-0.06%
$MARSCOIN starting to form bearish structure on lower time-frames. Gonna try to short it another time from here.
Entry zone 0.2435 - 0.2475
Stop loss 0.25422
#MARSCOIN
post-image
MARSCOIN+30.67%
$SUSHI Signal】Long pullback stabilizing + short squeeze setup
$SUSHI RSI 1H 73.35, 4H 71.86; the strong zones on both timeframes remain intact. The price fell from 0.2828 to the 0.2452-0.2556 range, with buying repeatedly absorbing the pullback and clear support orders around 0.2466 below.
🎯Direction: Long
⚡Entry/Limit order: 0.248353 - 0.249100
🛑Stop-loss: 0.246609
🚀Target 1: 0.252836
🚀Target 2: 0.254705
🛡️Trade management:
- Execution strategy: Reduce the position by 50% after reaching Target 1 and move the stop-loss up to breakeven. If the price falls back to the entry level, exit aut
post-image
SUSHI+31.89%
Bull-Bear Divide Deepens Around $82K! B.TOP Founder Sells All His BTC
live-cover
LIVE54
$MEMECOIN Rumor has it that it will be listed on the spot market today! The 10,000x moonshot coin is counting on you!
post-image
MEMECOIN-17.47%
  • 1
Everyone’s chasing gold, but XAUT just flashed a quiet sell signal nobody’s talking about.

$XAUT /USDT - SHORT

Trade Plan:
Entry: 4426.6 – 4428.8
SL: 4436.5
TP1: 4421.1
TP2: 4416.7
TP3: 4410.2

Why this setup?
- 4H bias is SHORT with 55.4% confidence—not a screaming trade, but a tactical fade.
- Price pinned at 4427.7, right on the entry ref, with RSI (15m) at 56.3—no overbought fuel left for bulls.
- ATR (1h) = 4.38 means tight stops; the range-bound 1D trend favors scalping the drop to TP1 (4421.1) and TP2 (4416.7) before the next squeeze.
- Why now? We’re waiting at the edge—stat
XAUT+0.01%
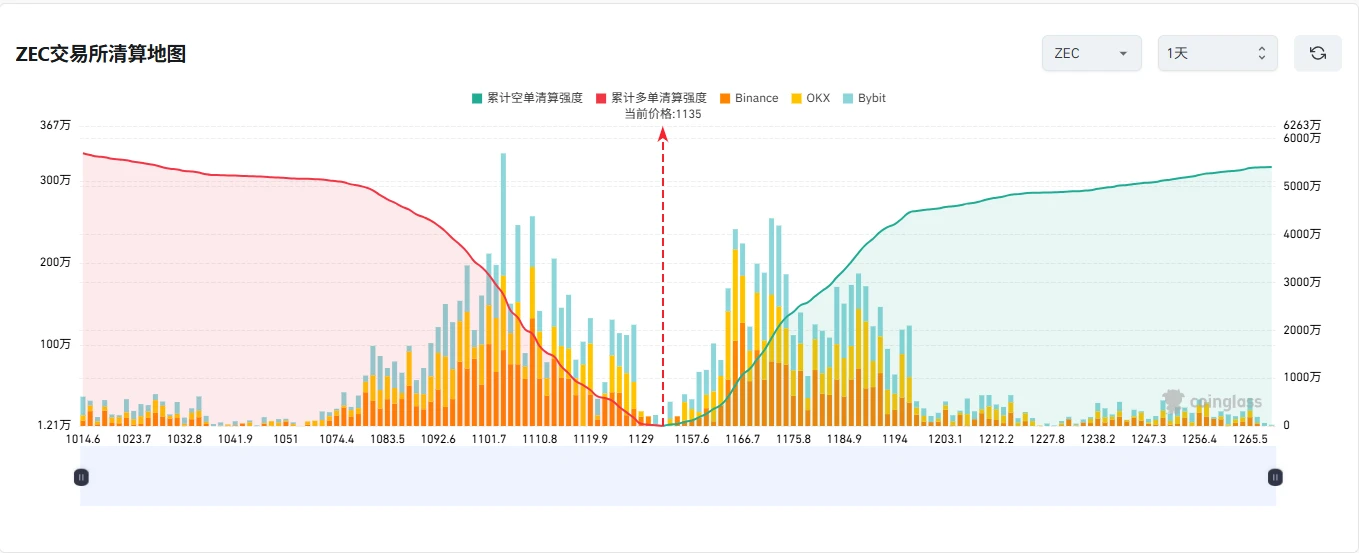
A few days ago, I placed a limit order for $ZEC , which filled at around 828.40. I wasn’t expecting much, but when I woke up, I found that the market had already started moving in the direction I expected. After confirming that the candlesticks and volume were moving in sync, indicating that the upward move was not weak, I held the long position and observed.
After the price surged to the key level, a rapid wick appeared, and short-term divergence began to increase, reminding me not to get greedy. Without clinging to all the unrealized profits, I took profit on 80% first and moved the protectiv
post-image
ZEC+1.59%
BNB+6.59%
SOL+1.58%
Is HYPE’s new all-time high just the beginning? The real test comes after $88!
HYPE broke through $88 and set a new all-time high, and this kind of move is most likely to ignite market sentiment.
Why does a new high matter? Because once the price breaks above all previous highs, the pressure from holders trapped at higher levels is significantly reduced, and the market begins to enter a new phase of “price discovery.” At this point, the market’s focus also shifts from “Can it break through?” to “Where is the next stop?”
But the stronger the rally, the less you should focus solely on the gains.
HYPE+1.10%
  • 48
This time, what I think was most crucial in holding onto the $NEAR long was splitting the take-profit into several stages instead of waiting for one key level.
The entry price was around 1.8725. When it rose to the first target, I closed 30% first, instantly lowering the cost basis of the position. I set a protective stop for the remaining 70% and patiently waited for higher levels. Honestly, no one can guarantee selling at the key level. Locking in part of the profit and letting the remaining position continue to run actually makes it easier to hold the trade steadily.
There was one quick pul
post-image
NEAR-1.51%
ETH+1.21%
SOL+1.58%
9.6, Sunday, Bitcoin, morning
Good morning! Happy weekend! The 4-hour chart remains in a range-bound recovery pattern. After rising to 80150, it came under pressure and pulled back, with obvious selling pressure above 80,000. Support at the 78600 low below remains solid, while 80800 is strong short-term resistance above. The market is a recovery rebound after the decline and has not formed a strong one-way trend.

Geopolitical conflict has emerged around the Strait of Hormuz. With markets closed over the weekend, beware of the risk of wick movements triggered by news. A considerable amount of
post-image
BTC+0.29%
Everyone’s chasing SKYAI’s bounce—but the 4H chart just whispered a 95% secret.

$SKYAI /USDT - SHORT

Trade Plan:
Entry: 0.06135 – 0.06199
SL: 0.06472
TP1: 0.05938
TP2: 0.05786
TP3: 0.05557

Why this setup?
Why now? The daily trend is still bearish, yet the 15m RSI (63.55) shows a weak bounce—a classic bull trap. Price sits at 0.06167, hugging the 1H pivot. ATR (0.00127) is tight, meaning the breakout is coiled. Targets down: TP1 0.05938, TP2 0.05786. The invalidation at 0.05841 is far—room to breathe.

Debate:
Is this the final flush before SKYAI dumps to TP2, or are we early on a fakeou
SKYAI+6.54%
Load More

Join 40 M users in our growing community

⚡️ Join 40 M users in the crypto craze discussion

💬 Engage with your favorite top creators

👍 See what interests you

View More