Share your thoughts
placeholder
Article
I originally planned to cut my losses and call it a day, but it turned around on its own and handed the profits back.

That plunge in the early hours a few days ago nearly shook me out. But looking closely, trading volume never truly expanded—it was just a panic sell-off, while some whales were quietly buying the dip. The inflow of funds couldn’t be faked. So I re-entered around 0.21096.

Now $BR is at 0.25595, with unrealized gains of +420.12%. Feels good, brothers—we can afford a good meal. I’ve taken 80% off the table, while setting the remaining 20% at the entry price for protection. Le
post-image
BR+17.79%
ETH+0.02%
BTC-0.77%
#USAugustNFPBeatsExpectations
US August Payrolls Beat Forecast And Lift Mood
US job data for August came in stronger than forecast, giving a fresh boost to confidence about the labor backdrop. Hiring held firm, jobless claims stayed low and wage gains showed steady progress. The upside surprise eased fears of a sharp slowdown and put focus back on resilient consumer demand heading into the final stretch of the year.
① Broad Hiring Across Core Sectors
Gains were broad, not tied to one niche. Services led the rise, with health care, leisure and business support adding new roles. Goods producer
NVDA+0.87%
SNDK+11.88%
AAPL-2.51%
GT+2.41%
BTC-0.74%
Why XLM is about to break range and surprise every long holder

$XLM /USDT - SHORT

Trade Plan:
Entry: 0.18871 – 0.19019
SL: 0.19653
TP1: 0.18414
TP2: 0.18061
TP3: 0.17530

Why this setup?
Why now? The 1h price is holding near 0.18945 inside a tight range, and the 15m RSI at 45.02 shows sellers are regaining control after a brief bounce. The 1h ATR of 0.002948 confirms volatility is compressing, which often precedes a sharp move, and the daily trend being range-bound means a directional breakout is overdue. The entry zone between 0.18871 and 0.19019 gives a precise trigger, with TP1 at 0.18
XLM+4.03%
Nobody is talking about this bullish setup hiding in plain sight right now.

$USELESS /USDT - LONG

Trade Plan:
Entry: 0.22428 – 0.23130
SL: 0.19408
TP1: 0.25307
TP2: 0.26992
TP3: 0.29520

Why this setup?
Why now? The daily trend is firmly bullish, and the 1h ATR of 0.014044 shows volatility is compressing just before a potential expansion. The 15m RSI at 54.85 proves there is no overbought exhaustion yet, while the 1h price sitting at 0.22779 places us exactly at the entry reference. This means the entry zone between 0.22428 and 0.23130 is live, targeting TP1 at 0.25307 and TP2 at 0.26992,
USELESS+3.25%
$SOL I’m bearish on this move. It fell 2.7%, while the retail long-short ratio rose from 1.96 to 2.02 and the large traders’ ratio rose from 2.43 to 2.50—both sides increased their long positions in the same direction, and no one has capitulated. This is not the structure of a bottom. The funding rate flipped from positive to negative, meaning those willing to pay to go long have exited; in the past hour, only 4 short positions were liquidated, while not a single long was liquidated, showing that none of the leverage has been forced out and all the overhead positions are still stacked above. I
post-image
SOL-1.43%
. LG Uplus Forms Alliance to Develop 100MW Modular AI Data Centers
LG Uplus announced on September 6 that it has formed the "PMDC Alliance" with four local construction and design companies to develop standardized models for prefabricated modular AI data centers. The partners include GS Engineering & Construction, Xi C&A, Gansam Architects, and D&O CM. The memorandum of understanding was signed on September 4 at LG Uplus's Pyeongchon Mega Center in Anyang, Gyeonggi Province.
Under the agreement, LG Uplus will establish operational standards and technical requirements, while the construction pa
post-image
  • 5
  • 1
I had just sent the app to the background when it suddenly popped back up—are you playing hide-and-seek with me? 😂 This move wasn't chased; I had positioned for it in advance.

While everyone else was running, $ORDI kept grinding within a range. Every time it pulled back to around 3.466, someone stepped in to buy, and the bids kept getting thicker. I thought to myself—this was a textbook pullback holding steady, so how could I not enter? So I opened a long position.

I refreshed again just now, and the current price has already touched 4.26, with the unrealized PnL showing +1104.01%. Honest
post-image
ORDI-0.65%
ETH+0.02%
BNB-1.29%
My hand trembled slightly when I set the stop loss a few days ago; this morning, I realized that filial devotion had been unnecessary. 😂
The last thing I saw before bed, $TOSHI was still ranging around 0.0001169. It hadn’t broken above the key level, but I saw that the key level had never been broken. Before the market had fully started moving, my judgment was: hold as long as the pullback doesn’t break the level; it wouldn’t be too late to exit if it did. That dip a few days ago was pretty scary, and I nearly got shaken out, but the logic hadn’t changed. When I opened the chart this morning
post-image
TOSHI-0.40%
SNDK+0.48%
BTC-0.77%
$SNDK /USDT is range-bound, but a hidden breakdown could rewrite the short thesis.

$SNDK /USDT - SHORT

Trade Plan:
Entry: 1784.64 – 1788.62
SL: 1805.77
TP1: 1772.28
TP2: 1762.71
TP3: 1748.36

Why this setup?
Why now? The daily trend is range, so any break of structure matters more than direction. The 1h price is 1786.63, which sits right at the entry_ref and defines the trigger for the short. The 1h ATR of 7.97331 shows average hourly noise is tight, meaning a false move is likely and the real move will be sharp when it comes. The 15m RSI at 54.43 is neutral, confirming no exhaustion yet
SNDK+0.48%
#vkfyo should make a thunderous comeback in September.
post-image
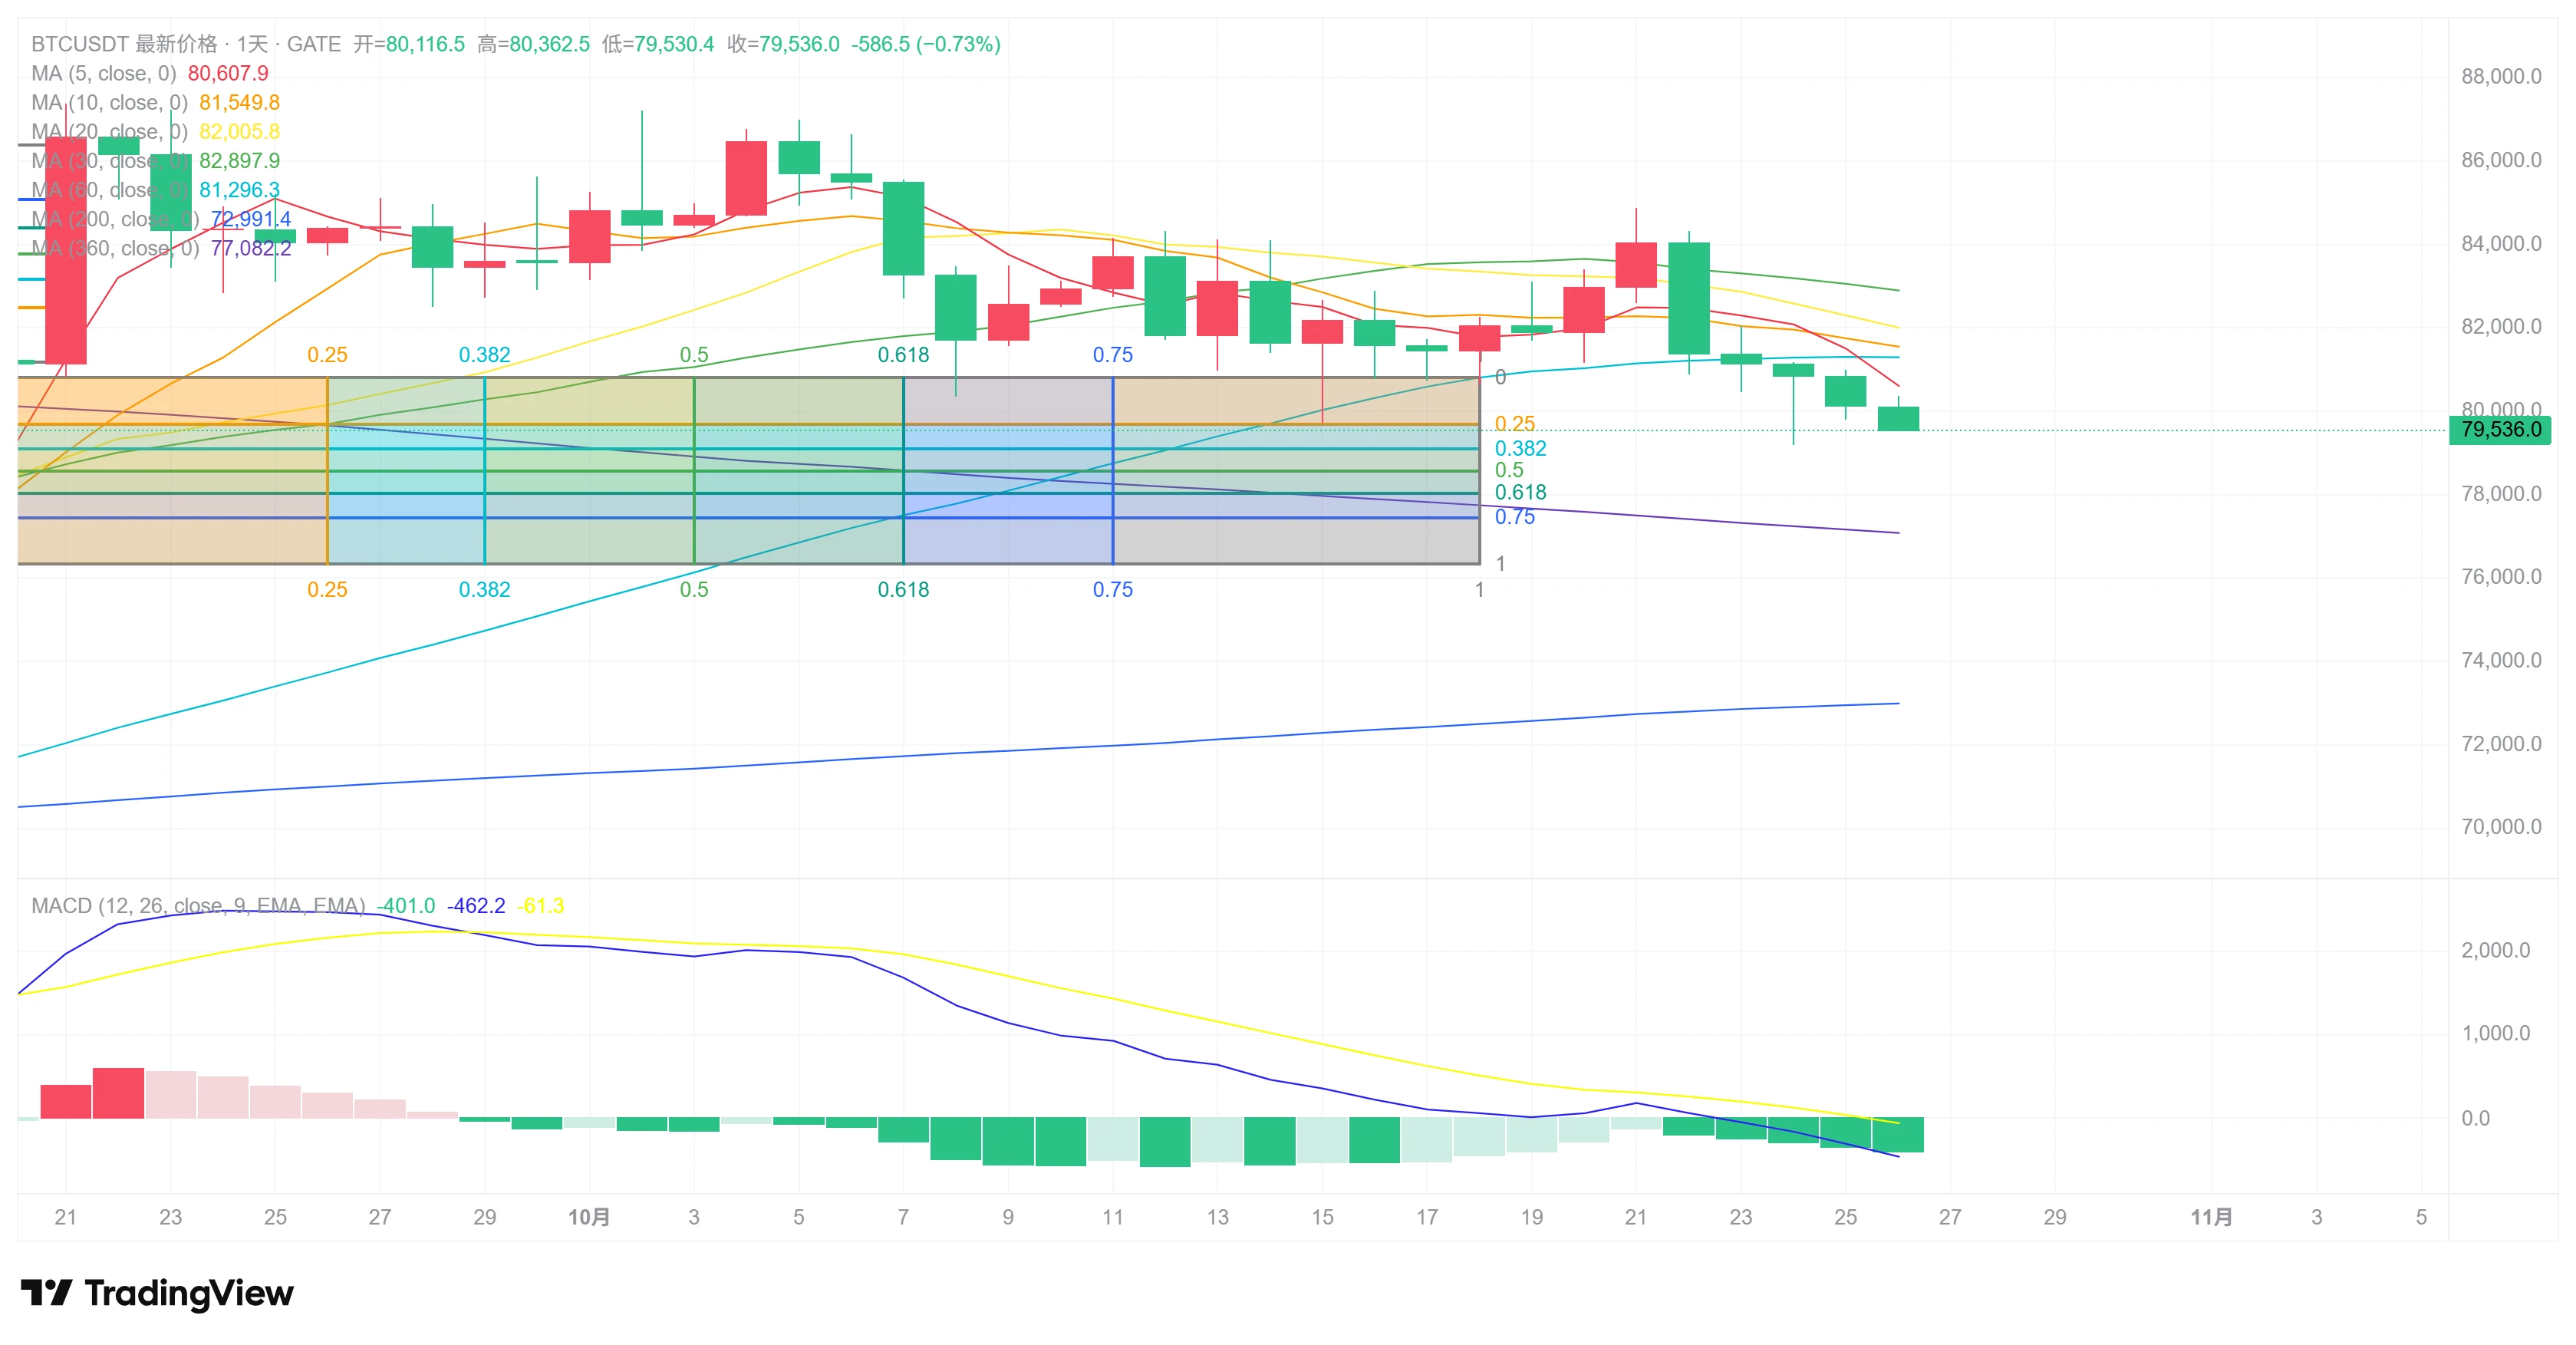
Insiders are quietly stacking shorts on SYMBOL while the 1h price sits at 79121.1.

$BTC /USDT - SHORT

Trade Plan:
Entry: 79044.5 – 79197.7
SL: 79856.2
TP1: 78569.8
TP2: 78202.2
TP3: 77650.9

Why this setup?
Why now? The daily trend is range, which often compresses before a sharp move, and the 1h ATR of 306.299718 shows enough volatility to fuel a short leg. The 15m RSI at 49.4 is barely below neutral, suggesting the last dip did not exhaust sellers yet. The entry zone between 79044.5 and 79197.7 aligns with the 1h price, giving a precise trigger for a short. If price pushes to TP1 at 7856
BTC-0.77%
BlackRock ETF Activity and Ethereum Inflows Give Crypto Markets Two Fresh Demand Signals
live-cover
LIVE1,143
#gStocksPurchaseSubsidyUpTo1000U gStocks Purchase Subsidy: Up to 2% Cashback
Gate has announced a gStocks Purchase Subsidy campaign designed to encourage users to increase their stock purchases and maintain their gStocks holdings. According to the announcement dated September 3, the promotion offers up to 2% cashback on eligible purchases, with a combined reward pool of 100,000 USDT. The campaign is described as first-come, first-served.
The promotion is divided into two main rewards. Reward 1 is a purchase-cashback program with a 50,000 USDT pool. Users need to satisfy both specified net-buy
  • 1
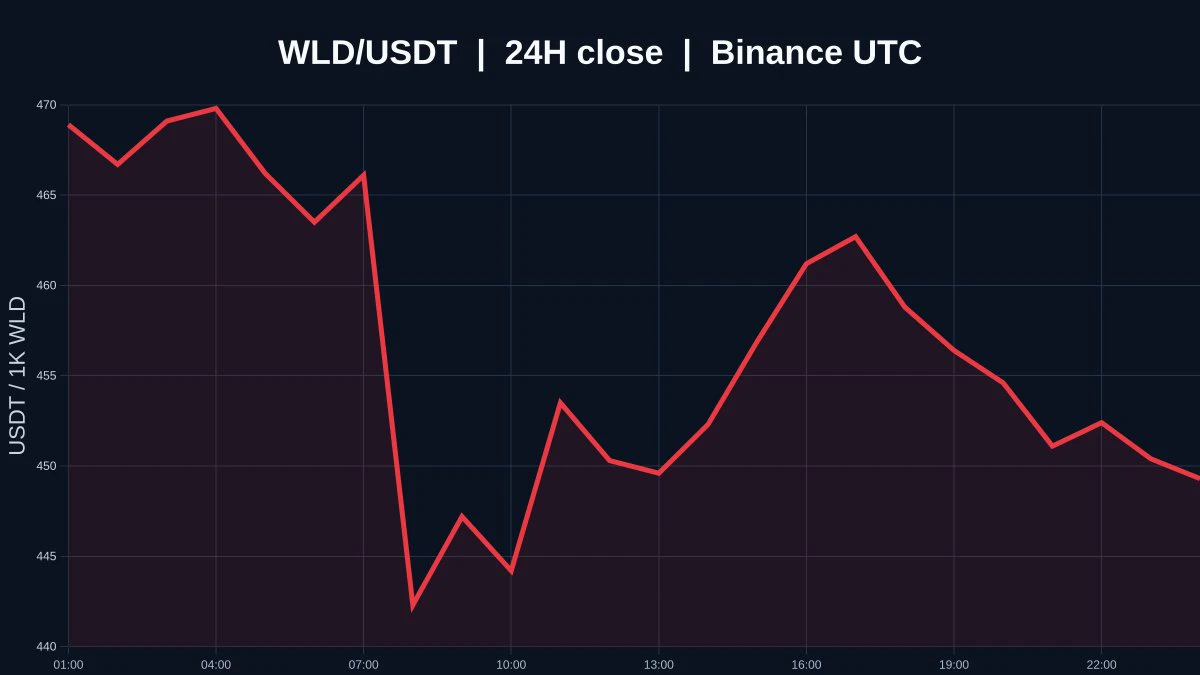
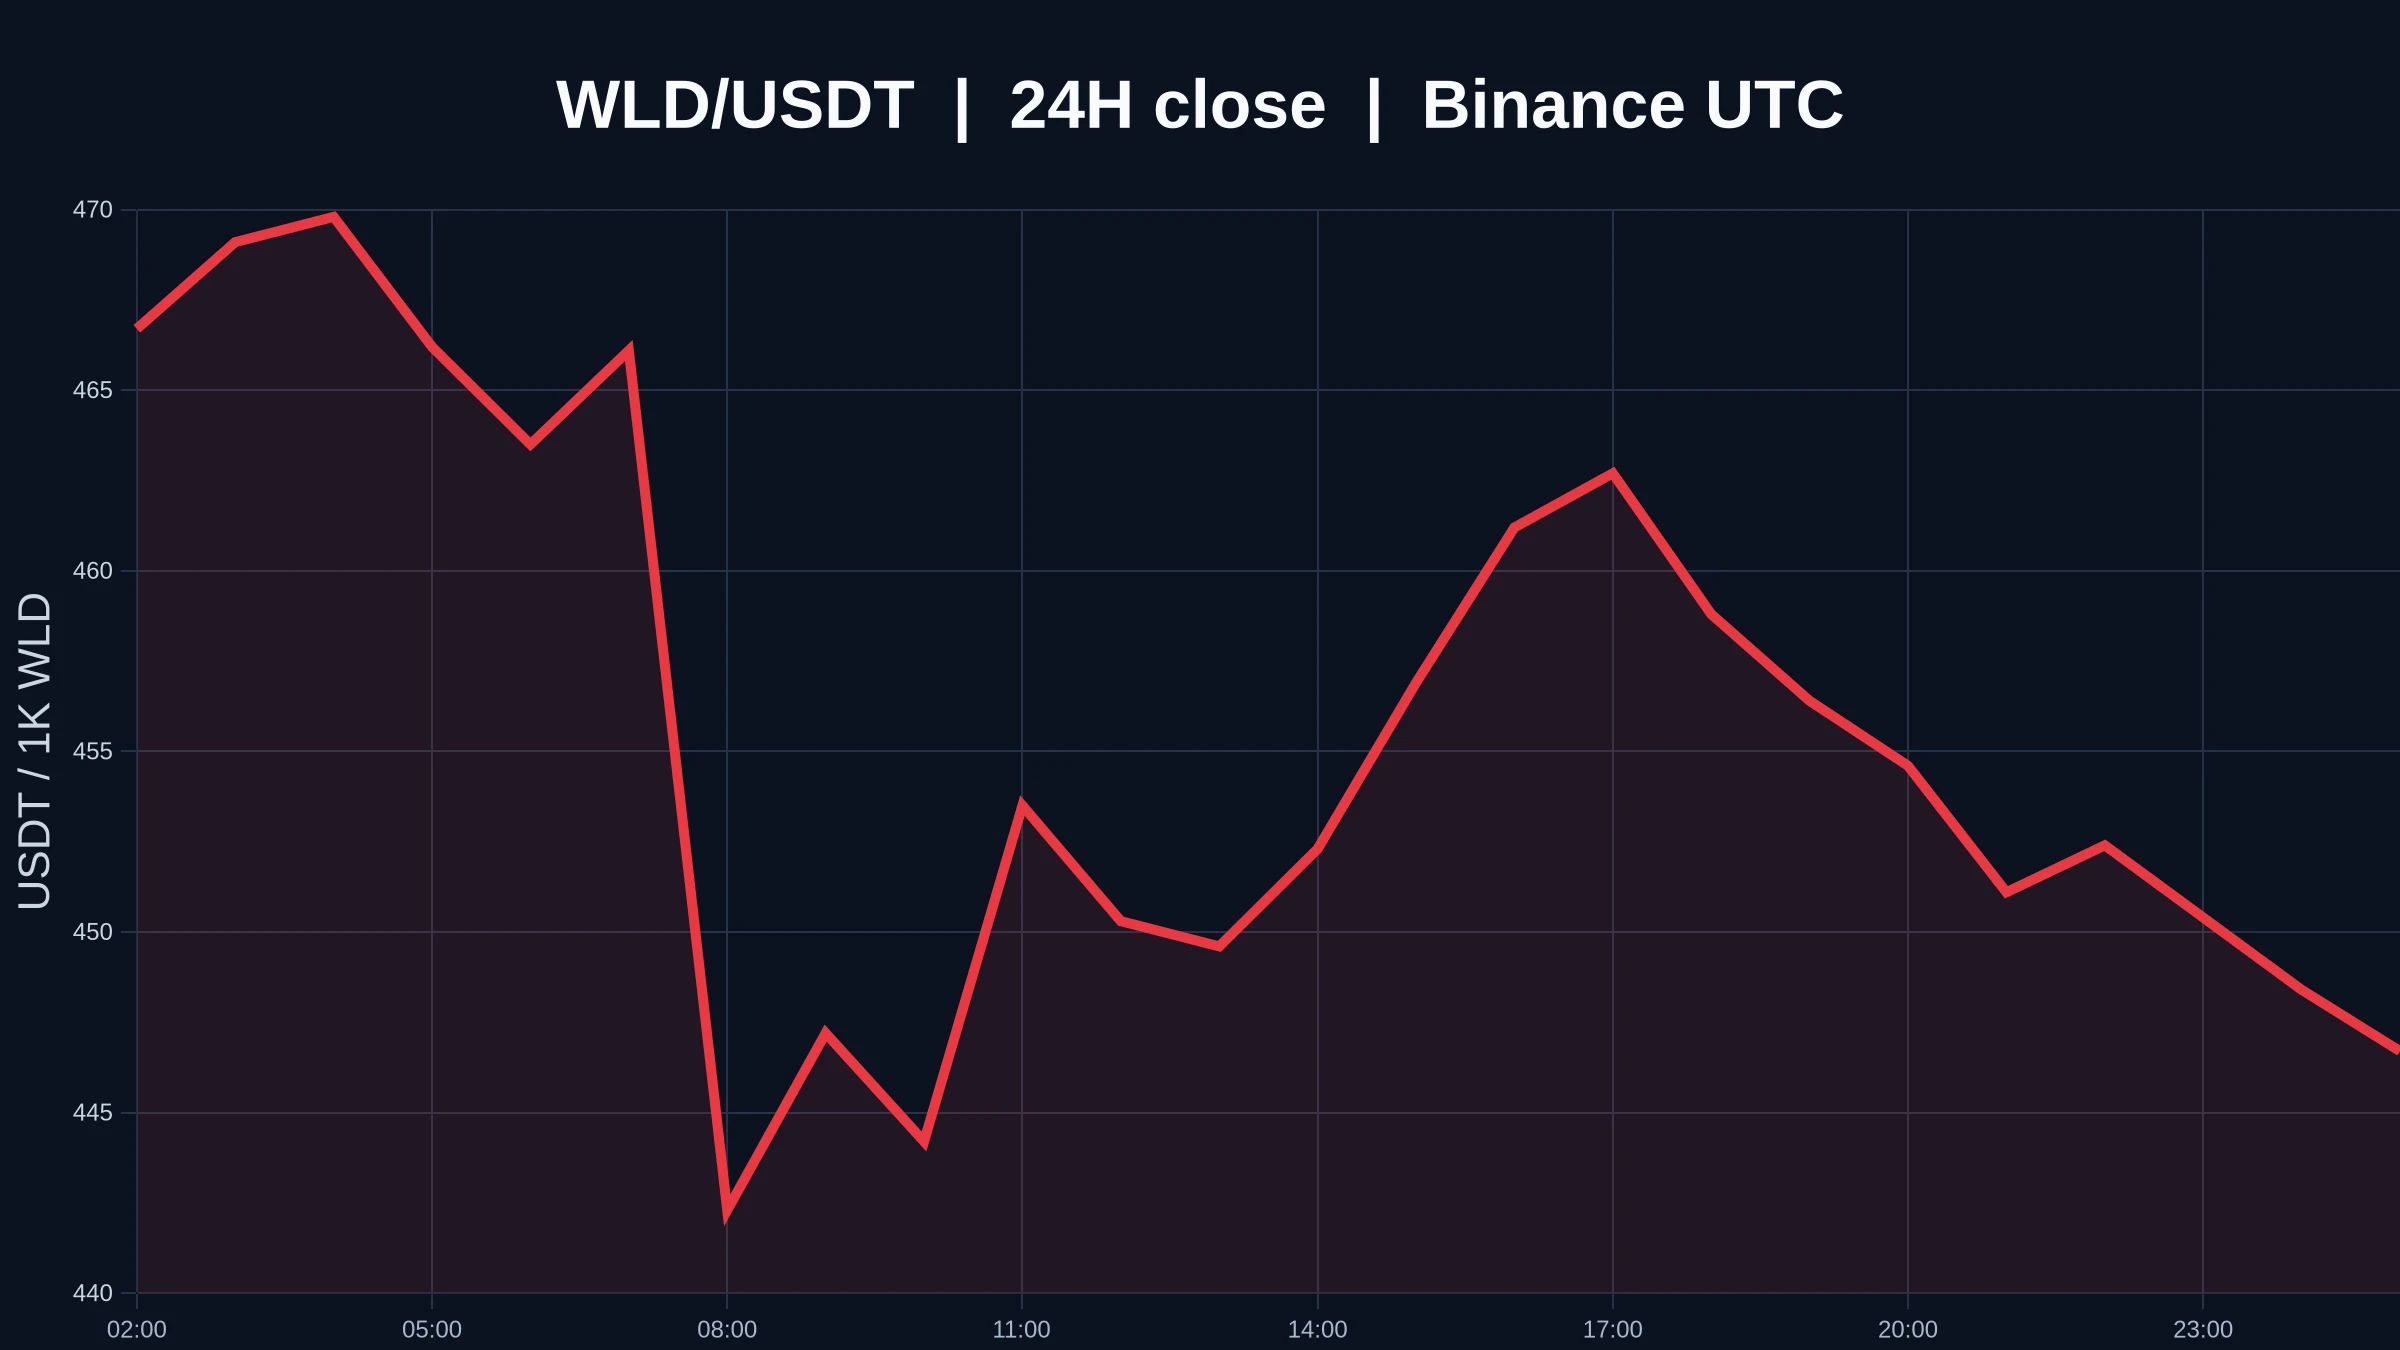
This entry point was not perfect; I tried a long at the second-bottoming area on the $WLD hourly chart. The moving averages had not fully turned upward yet, so I could only use a tight stop-loss in exchange for room for later profits.

After entry, price action was very choppy. Several rallies were pushed back, making it look like the trend was weakening. But each pullback consistently held above the key reference level from the time of entry, so I chose to reduce my trading frequency and let the position run.

Only after the key level above was broken did the price action start to flow smoo
post-image
WLD+11.79%
SOL-1.43%
SNDK+0.48%
$INJ has reached a major decision point after a strong recovery from the $4.60 area.
Price is now testing the $5.80–$6.00 zone, so confirmation matters here.
A clean breakout and hold above $6.00 could open the move toward $6.30 → $6.60.
But rejection from this zone could trigger a pullback toward $5.50 → $5.20.
For now, momentum is bullish, but this is the level that decides the next move.
Long $INJ ‌
post-image
INJ+17.23%
Hunter Biden, son of former U.S. President Joe Biden, plans to launch the $LAPTOP meme coin on Base on Sept. 9, according to WSJ..
And Active time Begins with this!
post-image
MEME-0.03%
In September, the U.S. Department of Commerce put macro data such as GDP and PCE onchain through Chainlink, alongside Wyoming stablecoin reserve verification. News sentiment is bullish, but this is essentially “expectations being fulfilled.”
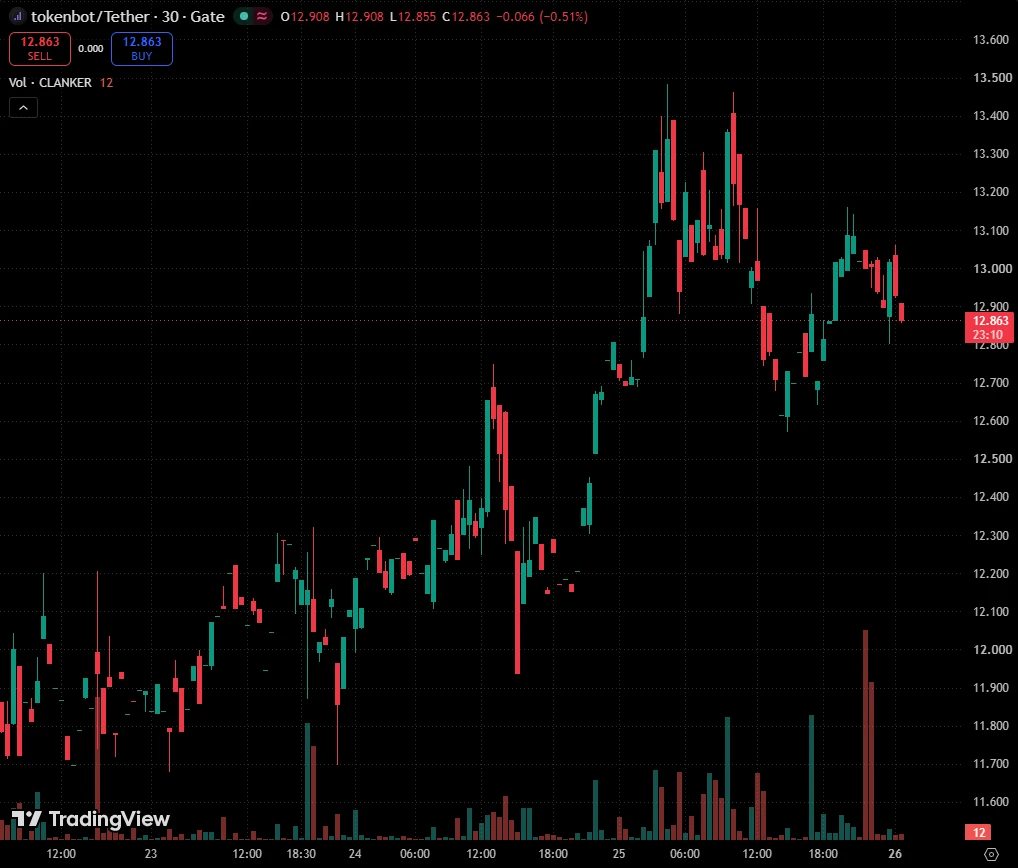
After surging near 13.45, the price saw weakening support. My short thesis was that the positive news had been fully priced in, not that I was bearish on the ecosystem. After opening the position, $LINK retested 12.749; 75x leverage amplified short-term volatility, with unrealized gains of +369.81%. Trades like this are only suitable for quick, event-driv
post-image
LINK+3.43%
BTC-0.77%
ETH+0.02%
Guys, this is a mining project in the BNB ecosystem. Any wallet that has participated in the BNB ecosystem can join.
Previously active wallets get a multiplier bonus.
No need to connect your wallet. Just enter your address and email to start mining!
Just for fun:
BNB-1.25%
During the early session, the price pulled back to around 140.53 and stabilized, so I went long directly. The plan is simple: as long as the hourly candle body does not break down, the upside target is the high-volume trading zone, with the stop-loss placed simultaneously.

After entering, it consolidated for a short while, with one wick in between, but I held the position. Once the hourly candle closed bullish again and pushed upward on increased volume, I took 70% off at the first target, and moved the stop-loss on the remaining position directly above the breakeven line.

The subsequent m
post-image
SOL-1.43%
BNB-1.29%
Load More

Join 40 M users in our growing community

⚡️ Join 40 M users in the crypto craze discussion

💬 Engage with your favorite top creators

👍 See what interests you

View More