
Share your thoughts
placeholder
Article
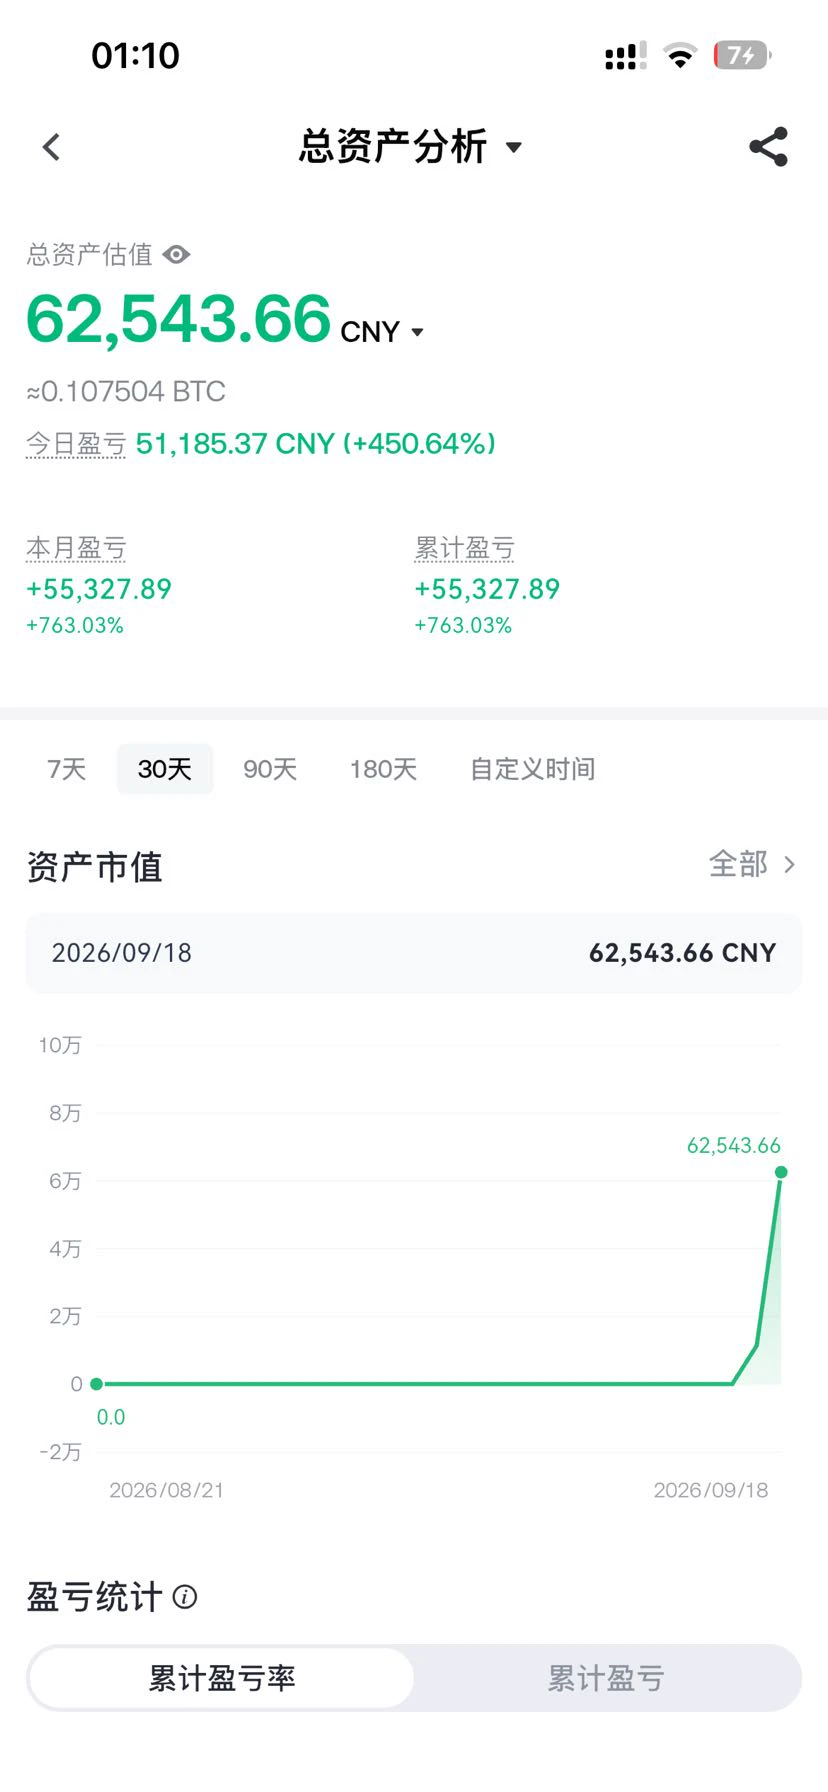
What was once a feast for the bears on Black Friday has dealt them a heavy blow today. The day session rose from 762 to an evening high of 812, giving the bears no chance to catch their breath.
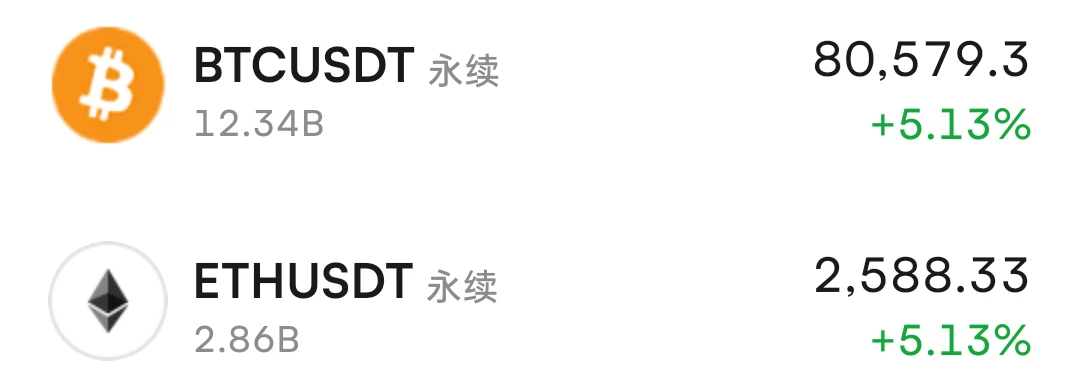
From a technical perspective, BTC and ETH still have further room to rise this evening. After such a substantial rally, signs of a pullback remain relatively weak. On the daily chart, a large bullish candle has firmly held the middle Bollinger Band, changing the previous overall trend. On the short-term four-hour and 15-minute charts, the Bollinger Bands have all opened upward, with both the upper and l
post-image
BTC+5.52%
ETH+5.82%
How it started vs how it ended
LFG
#ZECKeepsRisingBreaking1500 ZEC Keeps Rising — Breaking $1,500 and Rewriting the Zcash Market Narrative
Zcash just crossed another psychological milestone — and this rally is becoming impossible for the broader crypto market to ignore.
ZEC has surged above $1,500, extending one of the most dramatic rallies in the cryptocurrency market during September 2026. The move pushed Zcash to levels not seen in years, with the token reaching an intraday high around $1,535 before pulling back toward the mid-$1,400s.
What makes this move particularly significant is the speed.
ZEC has risen from roughly $47
  • 6
XRP is about to expose the short sellers who are already trapped.

$XRP /USDT - SHORT

Trade Plan:
Entry: 1.3779 – 1.3867
SL: 1.4366
TP1: 1.3415
TP2: 1.3144
TP3: 1.2736

Why this setup?
Why now? The daily trend is range-bound, which means XRP lacks a clear directional trend and traders are hunting for reversals inside that range. The 1h ATR of 0.017415 shows that hourly swings are tight enough to squeeze entries but wide enough to give the trade room. The 15m RSI at 66.09 signals short-term overbought pressure, suggesting momentum is fading and a pullback toward the entry zone of 1.3823 cou
XRP+6.91%
$AKE To put it bluntly, you can only pray that when you're short, there are people going long—and that you can survive to the end.
post-image
AKE+68.69%
  • 1
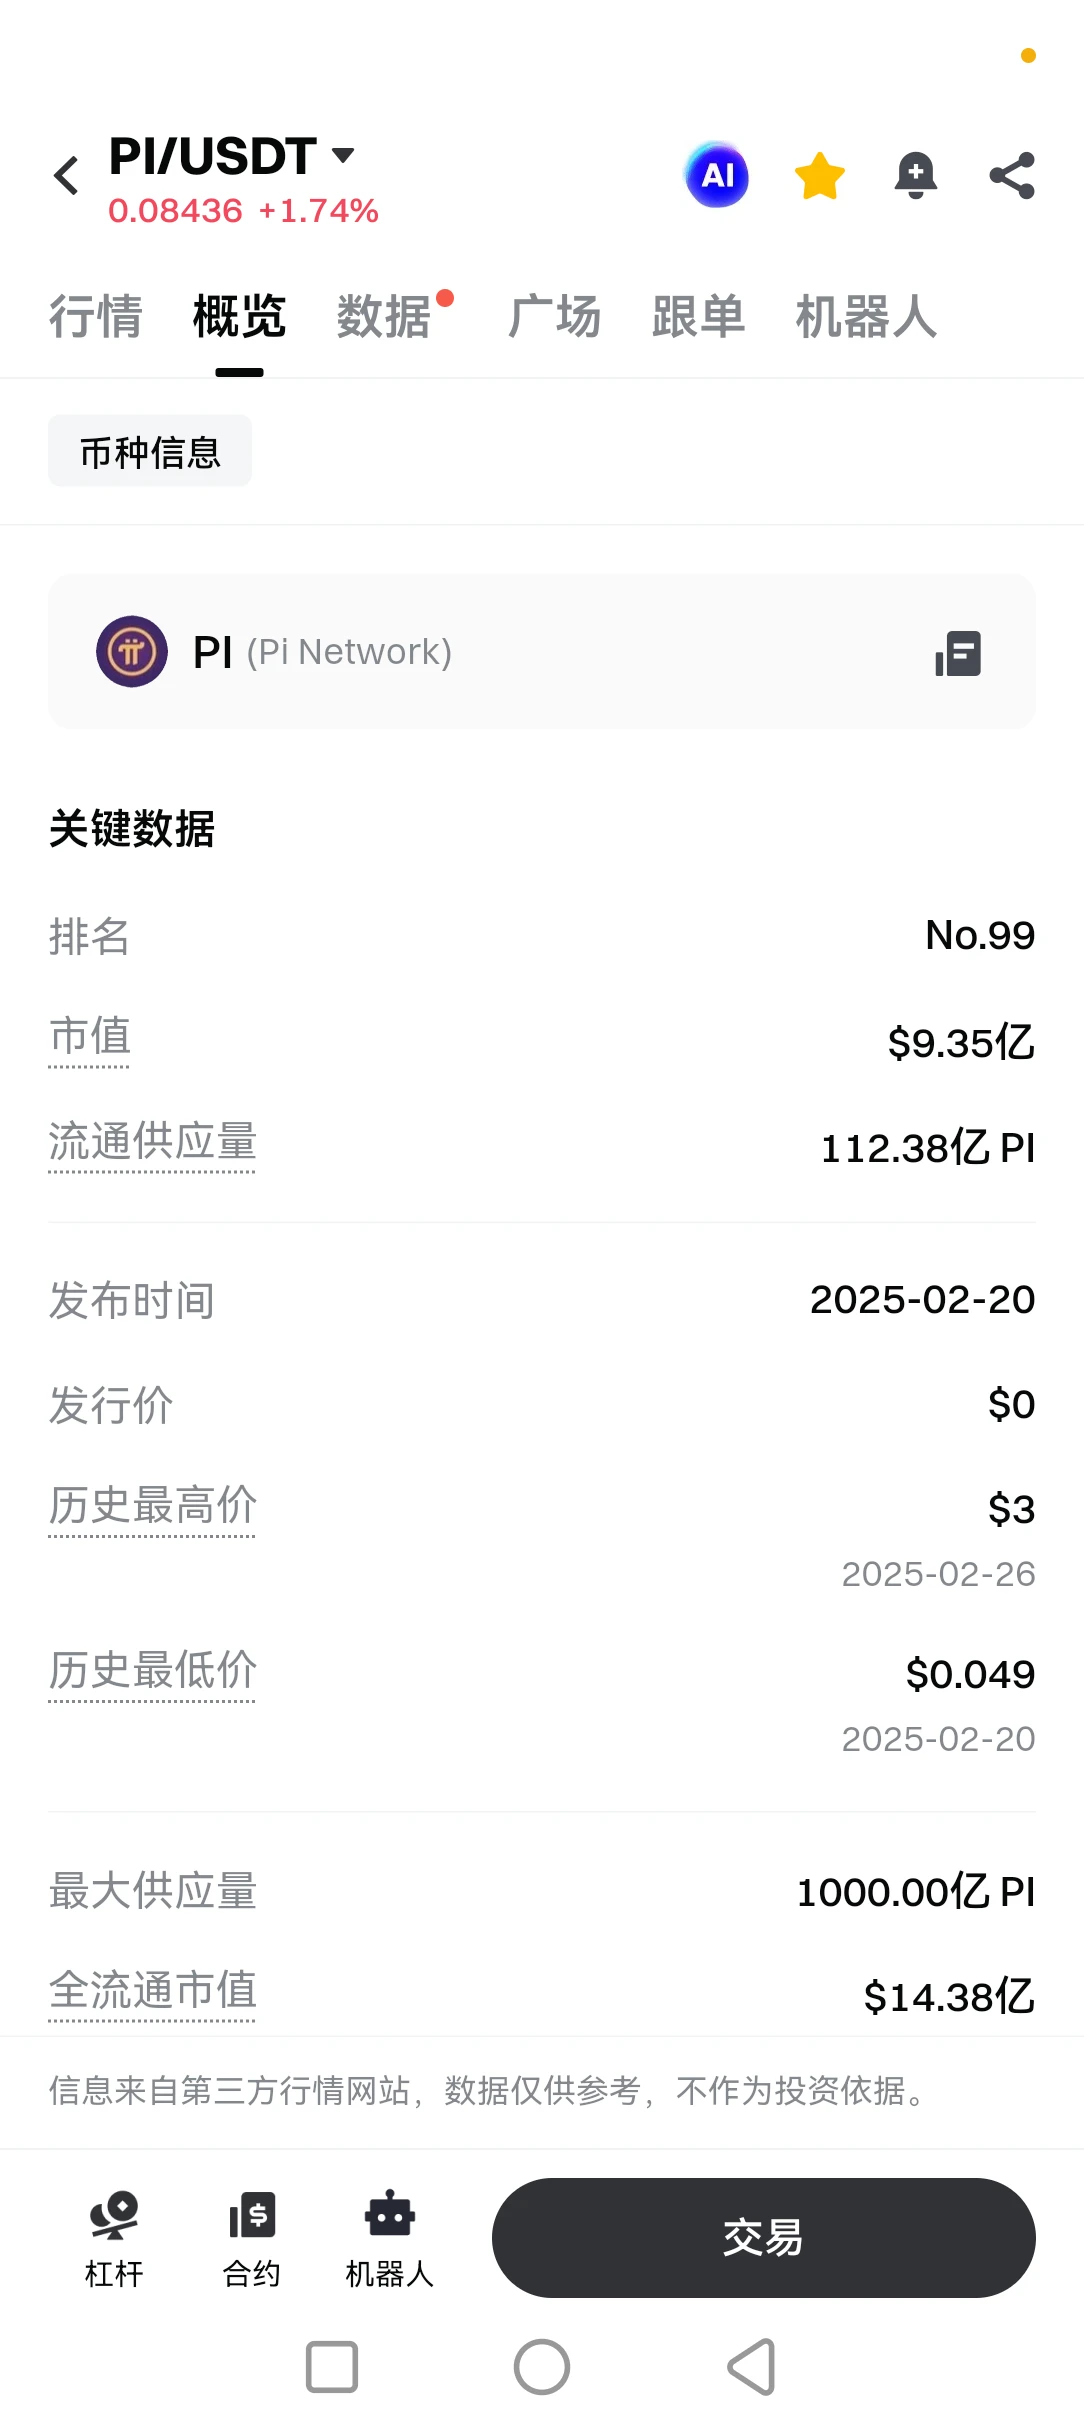
#PI Exchange has more coins again. Who transferred coins to the exchange to sell them again?
post-image
PI+3.58%
The market is pumping right now & all your favourite coins are ripping
ripple:native
hedera-hashgraph:native
sui:native
$Cake
hyperliquid:native
The question is why..
4pm EST All will be revealed
post-image
HBAR+3.89%
SUI+9.27%
CAKE-0.24%
HYPE+10.89%
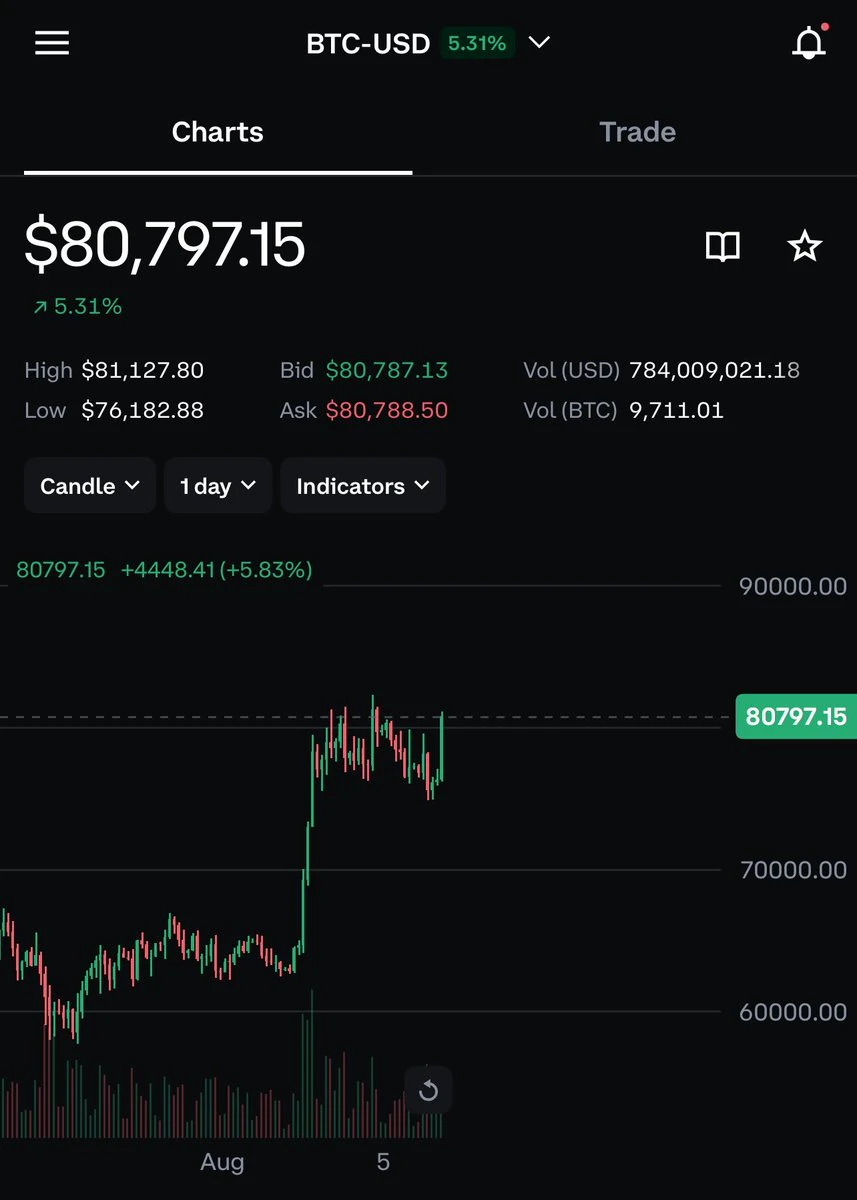
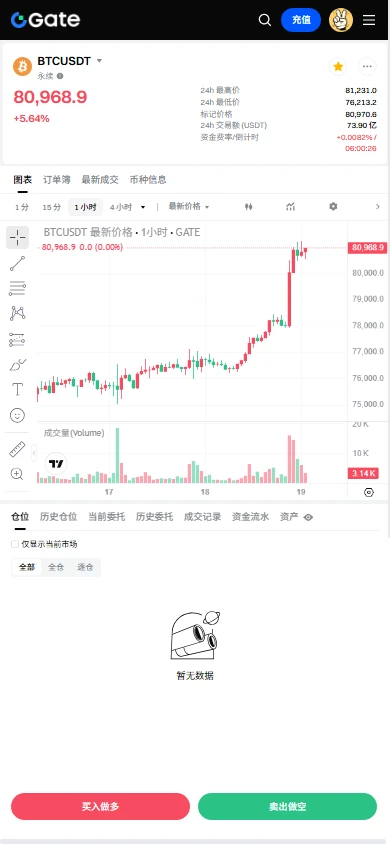
$BTC Signal】Long | 1H breakout rides the band upward
$BTC Riding the band upward after the 1H breakout, RSI is 84.66, the 4H MACD red bars are expanding, and order-book depth above 80800 is favorable. The 1H Bollinger upper band is at 80921, with price moving along the band; the previous 4H large bullish candle traded at 93465, and the market is currently consolidating on declining volume. Depth imbalance is 22.04%, with a Bid/Ask ratio of 1.57, indicating active buying support below. Funding is 0.0060%, OI is stable, and longs are not crowded. The risk/reward ratio is 1.50. The margin for e
post-image
BTC+5.56%
ETH+5.80%
SOL+10.72%
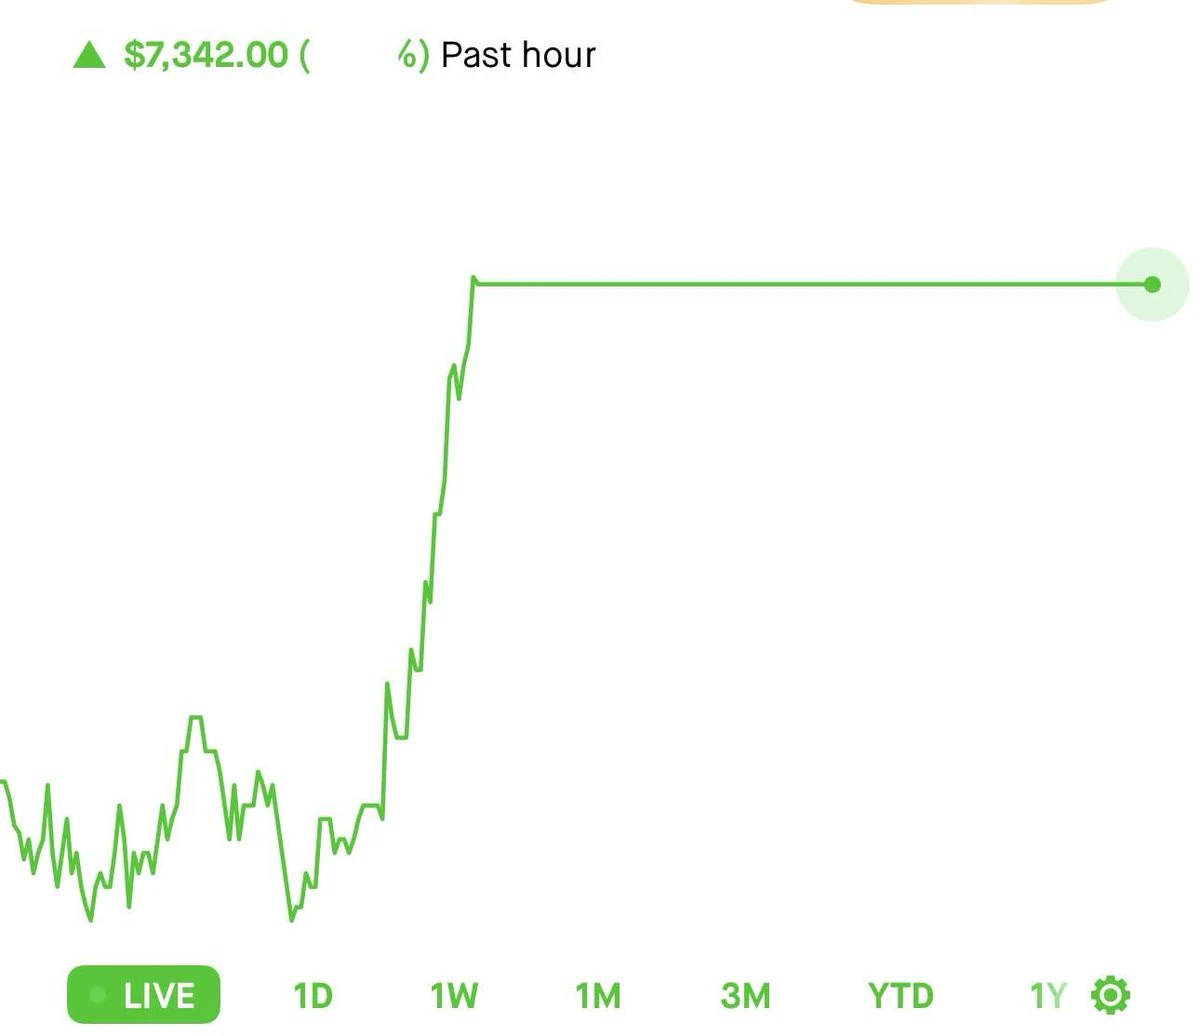
$7.3k an HOUR keeps the 9-5 away $SPY
post-image
SPY-0.44%
LIVE FUTURE TRADING
live-cover
LIVE1,932
The east isn’t shining, but the west is! BTC got us trapped, but the sol trend trade still banked 17 points of profit! Longtime followers know that sol has been signaling to go long on pullbacks all the way—long on pullbacks! All I can say this time is congratulations to the longtime followers—you got to eat the move! #美国众院推动比特币储备立法 #美股AI概念股全线反弹 #NEAR大涨超21%突破3美元 $BTC $ETH
BTC+5.52%
ETH+5.80%
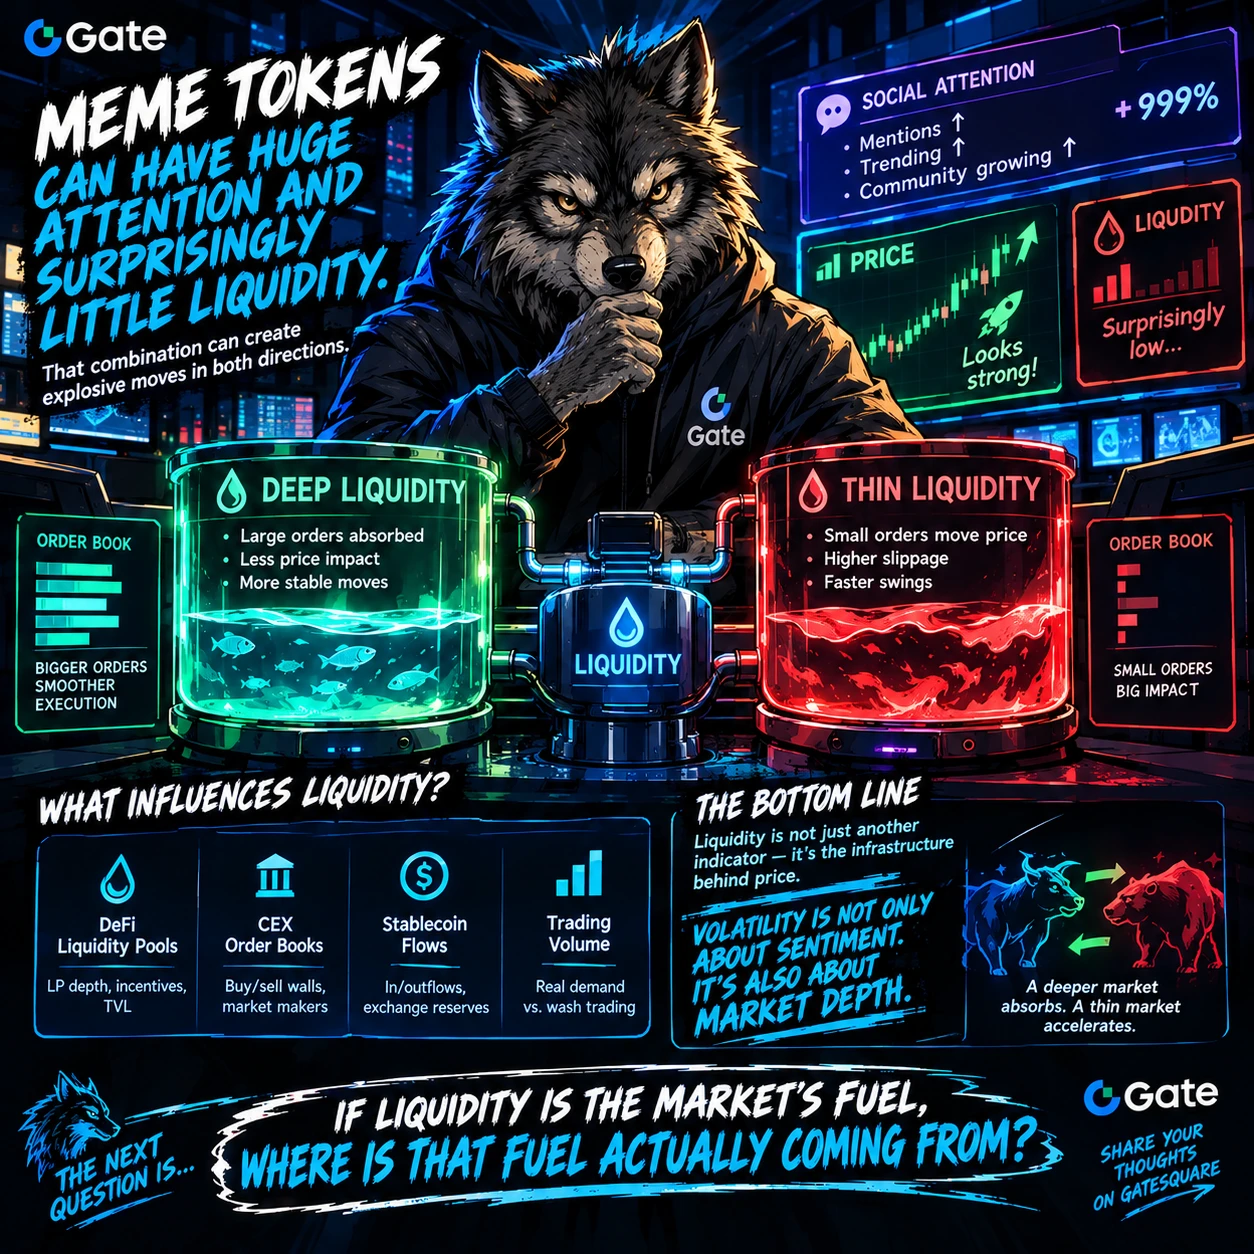
A Meme token can have enormous attention and surprisingly little liquidity.
That combination can create explosive moves in both directions.
But how much of a rally is actually supported by real market depth?
Liquidity is one of the most overlooked concepts in speculative crypto markets.
When liquidity is deep, larger orders can often be absorbed with less price impact. When liquidity becomes thin, relatively small orders can move price much more aggressively.
This matters enormously for Meme assets.
A trader may see a rapid breakout and assume that strong demand is driving the market. But if a
post-image
xxx40xxx
A Meme token can fall while its underlying attention is rising.
It can also rise while liquidity underneath the move is getting weaker.
So what if the chart is telling only half of the story?
Price is the most visible part of crypto markets, but visibility does not equal information.
Imagine a Meme token suddenly gaining volume. The chart looks impressive, social mentions increase, and traders begin watching the breakout. The obvious conclusion is that momentum is strengthening.
But volume alone does not tell us who is trading, why they are trading, or whether the liquidity can absorb the next wave of buying or selling.
This is where market structure becomes important.
Liquidity determines how efficiently orders can move through a market. On-chain data can provide clues about wallet activity, transfers and changes in token distribution. Exchange volume can reveal where speculation is concentrating. Social attention can show whether a narrative is expanding or simply becoming louder.
None of these indicators should be treated as a standalone prediction tool.
Instead, they form a framework.
For example, rising price combined with expanding participation may tell a different story from rising price with shrinking activity. Likewise, a sharp pullback after excessive leverage can have a different meaning from a pullback caused by deteriorating liquidity.
The professional approach is not to ask, “Will it go up?”
The better question is:
“What information would confirm or invalidate my current thesis?”
That shift changes trading from reaction into analysis.
In the next part, we move deeper into the market’s hidden engine: liquidity.
When you analyze a Meme move, do you watch price first—or liquidity first?
This content is not investment advice. Always perform your own research before making financial decisions.
$ARC $GT $ETH
#GateMemeCarnival #Gate广场中秋团圆局 #Arc生态热门代币波动加剧 #ArcEcosystemHotTokensSeeIncreasedVolatility #GateSquareMidAutumnReunion

repost-content-media
ARC+1.31%
ARGUS-12.90%
GSTOCKBSC-36.83%
  • 1
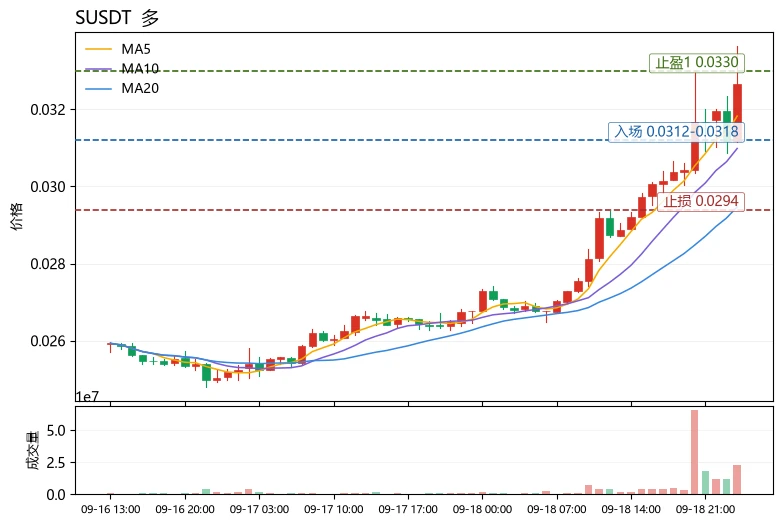
$S Short-term outlook is bullish, but it has entered a high-risk zone for chasing gains, so taking a large position at the current price is not recommended.
The Fear and Greed Index is 56, in the greed range. Risk appetite remains strong but is not at an extreme, indicating that the broader market still has room for an inertial move upward; BTC stabilizing has driven rotation among major coins, and high-beta small-cap coins like $S are beneficiaries of capital outflows, gaining +21.29% over 24h and clearly outperforming ETH's +5.00%, with sector rotation evident. Technically, MA5=0.031824 has
post-image
BTC+5.52%
ETH+5.80%
IN+5.38%
INJ+18.99%
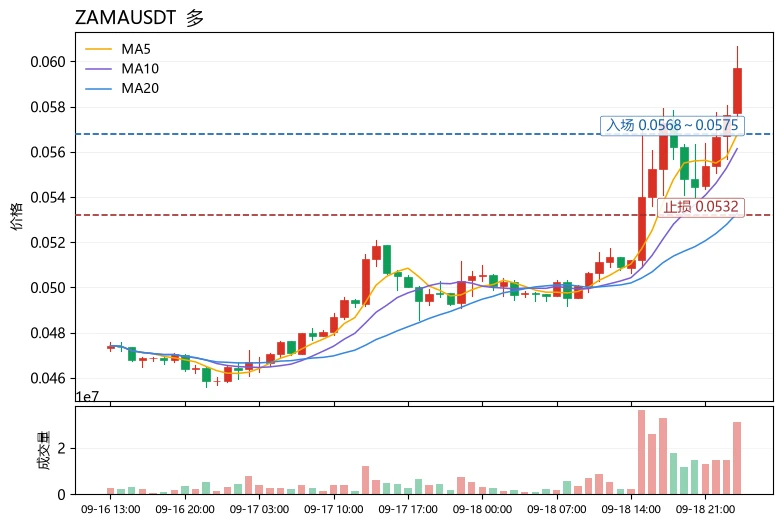
Many people rush to short when they see RSI in overbought territory, which is a typical countertrend-thinking mistake. Overbought does not mean a top; in a strong trend, RSI can remain above 70 for a long time. What should really be managed is position size and exit discipline, not guessing the top.
$ZAM 24h +18.24%, current price 0.05971, already above the upper Bollinger Band at 0.05952, with MA5>MA20 in a bullish alignment, a positive MACD histogram, and the trend intact. However, RSI=76.9 has entered the overbought zone, the funding rate of +0.0050% shows that longs are slightly crowded, t
post-image
ARB+21.79%
BTC update
live-cover
LIVE1,049
bitcoin:native damn
Looks like @saylor will be a very rich 🤑 man
post-image
BTC+5.52%
Why is everyone suddenly watching $CRCL /USDT like a hawk right now?

$CRCL /USDT - SHORT

Trade Plan:
Entry: 90.94 – 91.64
SL: 95.62
TP1: 88.04
TP2: 85.88
TP3: 82.63

Why this setup?
Why now? The daily trend is range-bound, but the 1h ATR of 1.387967 shows enough hourly volatility to make a short trade worthwhile from the entry zone of 91.29. The 15m RSI sitting at 63.8 signals room to run lower before overbought exhaustion, while the 4h higher-timeframe trend reinforces the short bias with a confidence score of 77.4. The first target at 88.04 and the second at 85.88 define a clear reward
CRCL+7.60%
#ZECKeepsRisingBreaking1500 ZEC Keeps Rising — Breaking $1,500 and Rewriting the Zcash Market Narrative
Zcash just crossed another psychological milestone — and this rally is becoming impossible for the broader crypto market to ignore.
ZEC has surged above $1,500, extending one of the most dramatic rallies in the cryptocurrency market during September 2026. The move pushed Zcash to levels not seen in years, with the token reaching an intraday high around $1,535 before pulling back toward the mid-$1,400s.
What makes this move particularly significant is the speed.
ZEC has risen from roughly $47
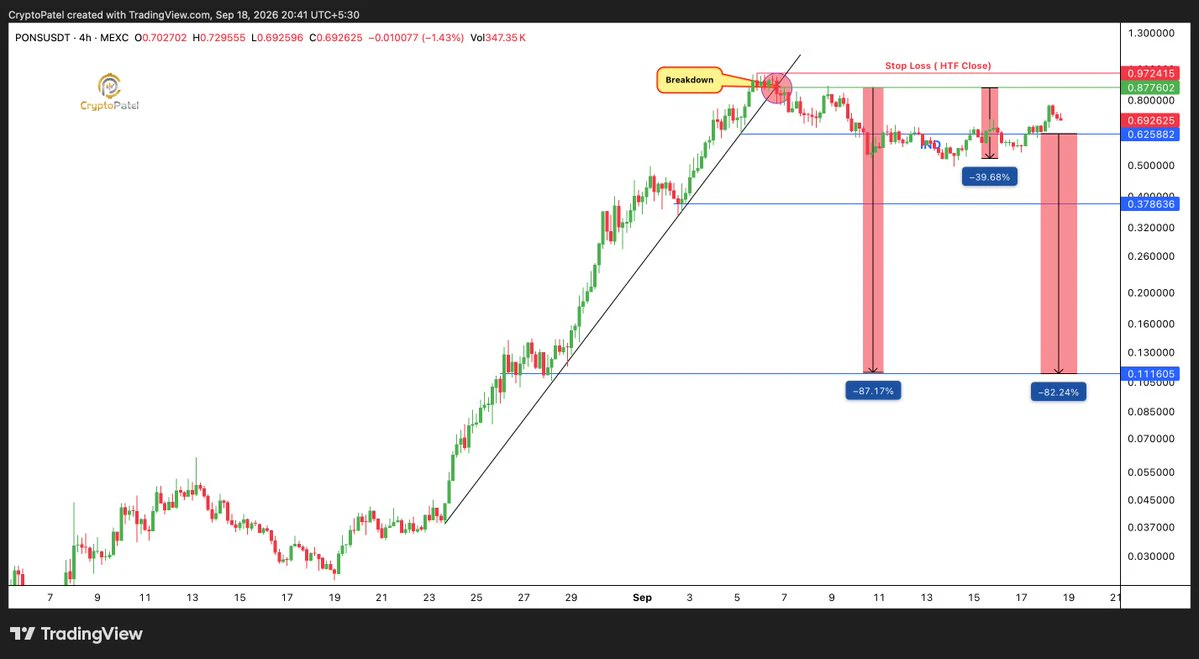
🚨 $PONS WARNING: 263,432× From Launch 🤯
$1 → ~$263K
$10 → ~$2.63M
$100 → ~$26.3M
Crazy Gains For Early Buyers, But This Is Exactly Where You Need To Stay Cautious.
I’m NOT Calling For A Buy Here.
After Such A Massive Move, Distribution Risk Is Extremely High. Early Holders Can Start Taking Profits At Any Time.
Maybe #PONS Pumps More. Maybe It Dumps Hard.
Don’t FOMO. Don’t Become Exit Liquidity.
DYOR + Check On-Chain Data.
post-image
PONS+1.98%
$ONE secured as profit. That’s it for this week. Rest over the weekend and spend time with your family. We’ll fight again next week, brothers.
post-image
ONE+1.84%
Load More

Join 40 M users in our growing community

⚡️ Join 40 M users in the crypto craze discussion

💬 Engage with your favorite top creators

👍 See what interests you

Trending Topics

JapanRealEstatePowerChipStocksRise

58.46k Views3.49k Discussing

Japan's Nikkei extended gains on Sept 18, with real estate, power, and semiconductor sectors leading. Gate covers over 12,800 global stocks and ETFs, offering one-stop USDT trading across US, HK, Korean, and Japanese markets. [👉 Read more](https://www.odaily.news/en/newsflash/518749)

USAIConceptStocksRally

33.34k Views455 Discussing

GateTopsStockPerpetualCoverage

37.51k Views2.3k Discussing

View More