Square
Following
Hot
News
Notifications
Profile
Share your thoughts
placeholder
Article
I'm confused—did we win or lose 😂
post-image
Total cryptocurrency market capitalization exceeds $2.32 trillion, with Bitcoin dominance at 59.7
live-cover
LIVE1,419
Trenches
mihao
m
bade
b
mihao
4Cxj...pump
Market Cap
$.
Change
.
24h Vol
$.
Holders
.
IDOL
I
bade
b
IDOL
0x3b...ab07
Market Cap
$.
Change
.
24h Vol
$.
Holders
.
FOOD
F
bade
b
FOOD
FTu5...pump
Market Cap
$.
Change
.
24h Vol
$.
Holders
.
AGT
A
bade
b
AGT
0x5d...e274
Market Cap
$.
Change
.
24h Vol
$.
Holders
.
NIO
N
bade
b
NIO
7SL2...pump
Market Cap
$.
Change
.
24h Vol
$.
Holders
.
Treat a sideways market as a “waiting period for paying tuition”

What you should be doing during this time isn’t staring at charts,
but:
Continuously tracking changes in the project’s fundamentals
and the narratives around the news
Watching whale wallet activity (on-chain data)
Getting your funds ready and adding to your position only after a breakout is confirmed
But first, you need to establish a starter position
Even if it’s just 10u-100u, use funds you can afford to risk
Money you can afford to lose completely
Rather than sitting entirely on the sidelines. People who stay completely on th
post-image
BTC-0.67%
#晒出我的持仓收益 Er Bing, just keep dragging this out, then. I'm going out to wash my hair; I can't even be bothered to watch you. I'll stream later, and I'll let you know which account will go live when the time comes. The daily stream is announced in TG
post-image
ETH-1.23%
  • 1
Not a single decent bounce since this morning.

As of 19:20, BTC is around 67,250, down 3.1% over 24 hours. It has moved between 66,427 and 70,188 today, and is down 11.2% over seven days (CoinGlass). ETH is hovering around 1,910, with an intraday low of 1,881, down 14% in five days (Barchart).

The real pressure is still that line: the 200-week moving average is around 67.8k, and price is now trading just below it. If it fails to reclaim it by this week's close, the situation changes. The weekly close is at 8 a.m. Beijing time on Monday—that's the first real test of this cycle.

Over the past
BTC-0.67%
ETH-1.26%
  • 4
  • 2
ETH buy now, TP at 1950. Weekends usually rise slowly until the weekly candle closes.
#GateIPOAccessAnthropic
$ETH ‌
ETH-1.23%
  • 2
Sometimes I really want to beat the stuffing out of him.
post-image
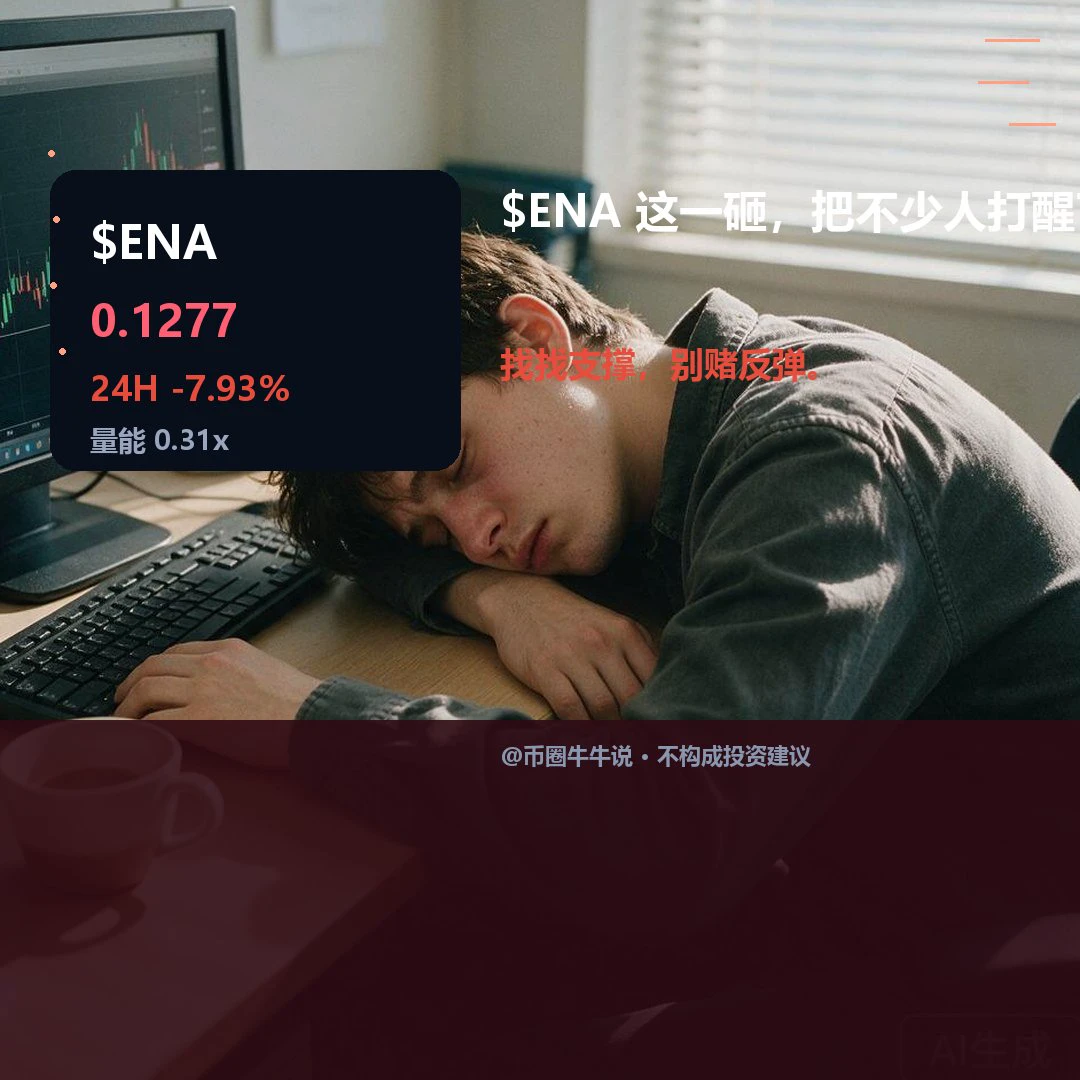
$ENA Currently trading at 0.1277, down 7.93% over 24H (range: 0.1261–0.1427). The 1H trend is weak, with an RSI of 35; the 4H trend is weak, with an RSI of 20. If it breaks above 0.1427 decisively, watch for further upside. If it falls below the 0.1261 support, the short-term structure may weaken. The market is highly volatile; for observation only.
post-image
ENA+8.04%
$ZEC : the next reaction matters

The plotted path needs confirmation before it becomes convincing.

ZEC has a conditional route lower on the 30M chart. Watch whether sellers can hold the rebound below resistance and break the nearest support.

Structure

• Patterns frame the visible price structure.
• Last closed price: 892.77.
• The curve illustrates a possible path with a pullback.

KEY LEVELS

Marked target: 799.791
Resistance: 903.762
Support: 888.636

Reassess after a recovery above resistance followed by a retest that holds.

#USOctoberPPIBelowExpectations

#ShareWeekly
$BTC ‌$ZEC ‌
post-image
ZEC+1.29%
BTC-0.67%
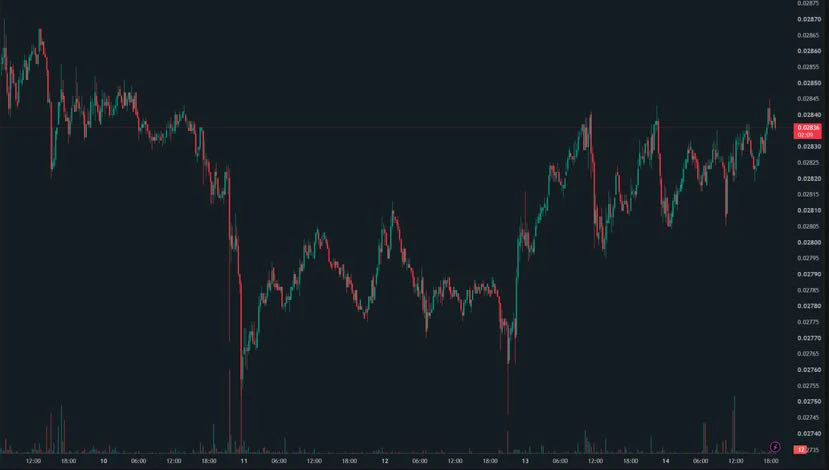
$ETH Fell alongside BTC, but the E/B exchange rate remained quite resilient🤔

BTC fell below $67,000, and ETH was also dragged down to around $1,900. But looking closely at how the two performed, there are still some interesting details:

Over the past 24 hours, BTC fell about 3%, while ETH fell about 2.1%. The ETH/BTC exchange rate instead rose nearly 0.8%, currently holding around 0.0283.

This shows that amid a broad market decline, ETH is starting to outperform BTC on a relative basis.

Of course, this isn't enough to show that capital is shifting from BTC to ETH on a large scale. After a
post-image
ETH-1.23%
  • 2
  • 2
Not all mining machines can mine every coin
#Bitcoin uses SHA-256, while Litecoin and Dogecoin use Scrypt.
Why does it matter? Because each algorithm needs different mining hardware.
A SHA-256 ASIC cannot mine Scrypt coins, and a Scrypt ASIC cannot mine SHA-256 coins.
Remember: Before buying a mining machine, always check the coin's algorithm. The right hardware makes all the difference
#ViaBTCacademy
post-image
BTC-0.67%
LTC-0.07%
DOGE-0.22%
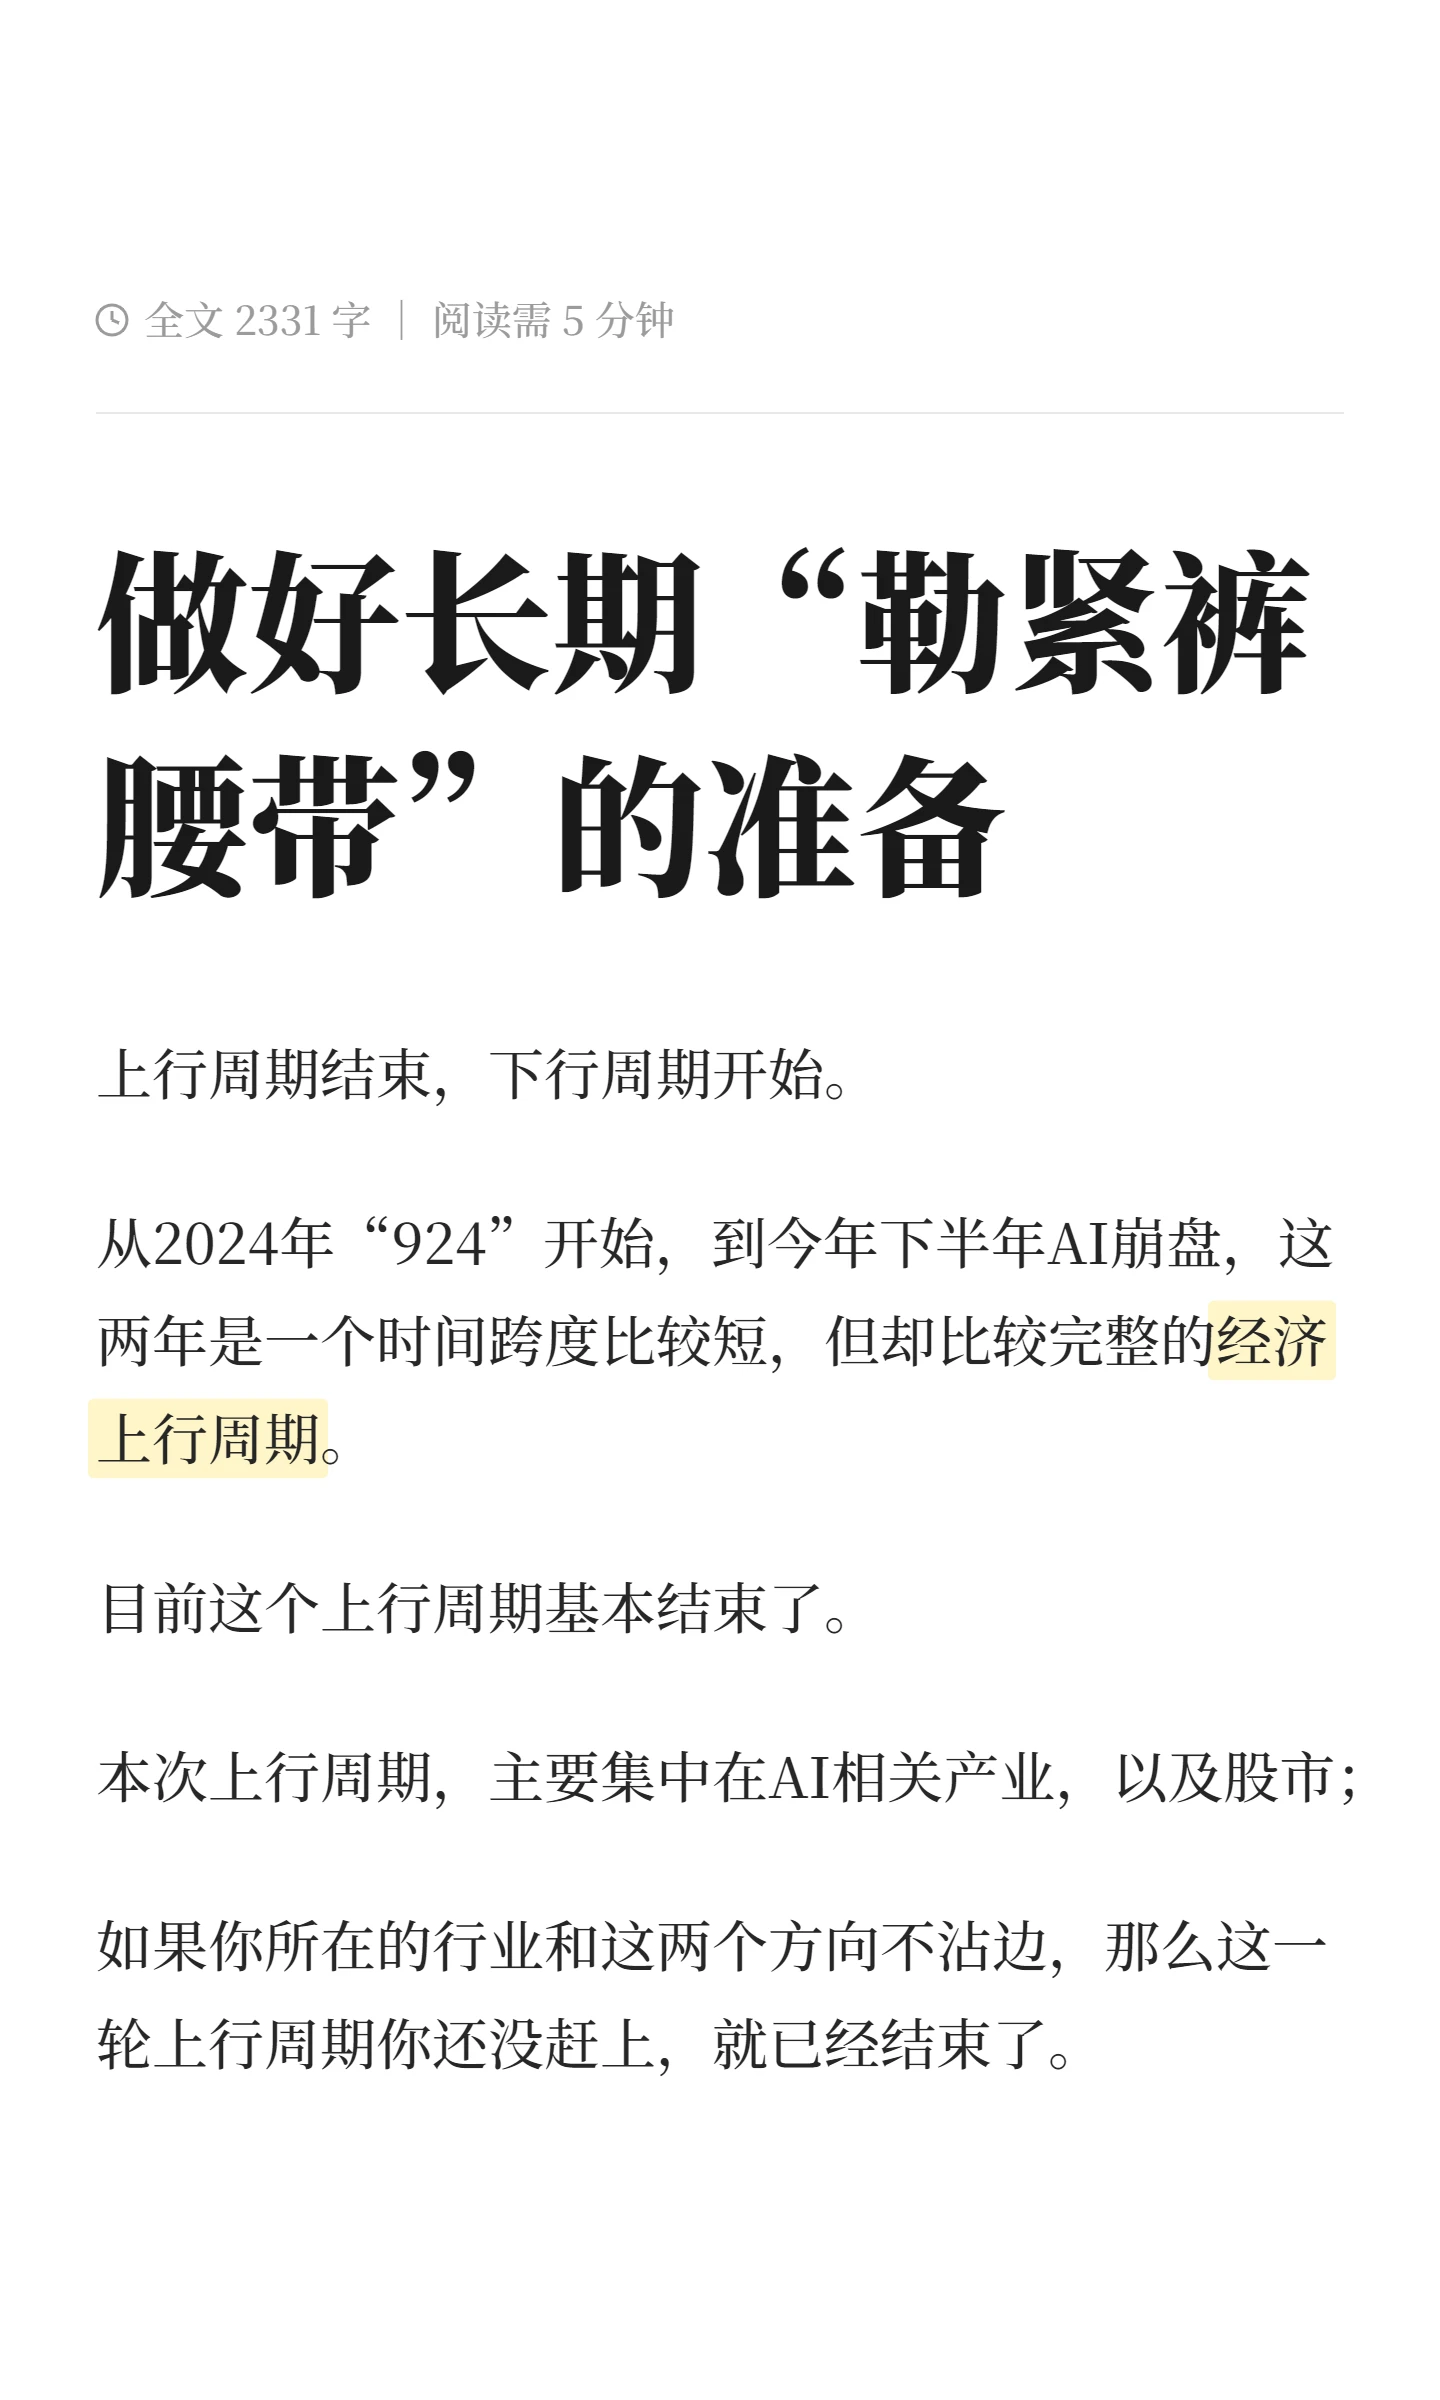
Prepare to “tighten our belts” for the long haul. From “924” in 2024 to the AI crash in the second half of this year, these two years have been a relatively short but fairly complete economic upcycle.
At present, several of the fundamentals sustaining this “mini-cycle” are collapsing:
The US rate-cutting cycle has ended, and the country is back in a rate-hiking cycle;
AI infrastructure construction is far outpacing demand, and investors are beginning to ask about returns;
AI’s displacement of human labor is constraining the growth of domestic demand.
post-image
This move came a little later than expected, but CAP$CAP got the job done. Patience paid off again. Nice result. Today, charting
$SOPH and $BLESS . $
post-image
CAP+8.34%
SOPH-3.83%
BLESS-2.00%
🚨 JUST IN: Michael Saylor's Strategy $MSTR is reportedly sitting on over $7.5 BILLION in UNREALIZED LOSSES from its Bitcoin $BTC holdings as crypto markets face continued selling pressure!
MSTR-2.37%
BTC-0.67%
Bitcoin’s astonishing discovery—I haven’t dared say this until now. Back then, everyone was caught up in the rally, and saying it would have invited a lot of criticism.

Why did the price stop falling near $60k? Because a huge number of short positions had piled up there. The market often has to push higher first to liquidate those shorts. Only after clearing this resistance can it continue lower without restraint.
Fear at 18 and daily RSI at 23, and you dare jump in? You’re trying to catch a “bloodied falling knife”! 🔪📉
Looking back at the 2018 and 2022 bear markets, whenever the price trul
BTC-0.67%
Market update
live-cover
LIVE2,334
67,992. Bitcoin hit a low of 66,456 this week, falling below the 200-week moving average. Everyone’s calling it “the historic bottom” 🧐
But Zuo Zuo checked Binance’s weekly chart, and the last time it fell below this line was this June:
The week of 6/1 was the first time it fell below the 200-week moving average
It then spent 11 weeks hovering around the moving average, bottoming at 57,800
It wasn’t until the week of 8/17 that a single weekly candle surged from 62,900 to 77,734 (+23.6%)
Now: the weekly chart is on its 6th consecutive bearish candle (not closed yet)
The Fear and Greed Index is
post-image
$AKE Ride a roller coaster once, and the shrimp die
post-image
AKE+6.07%
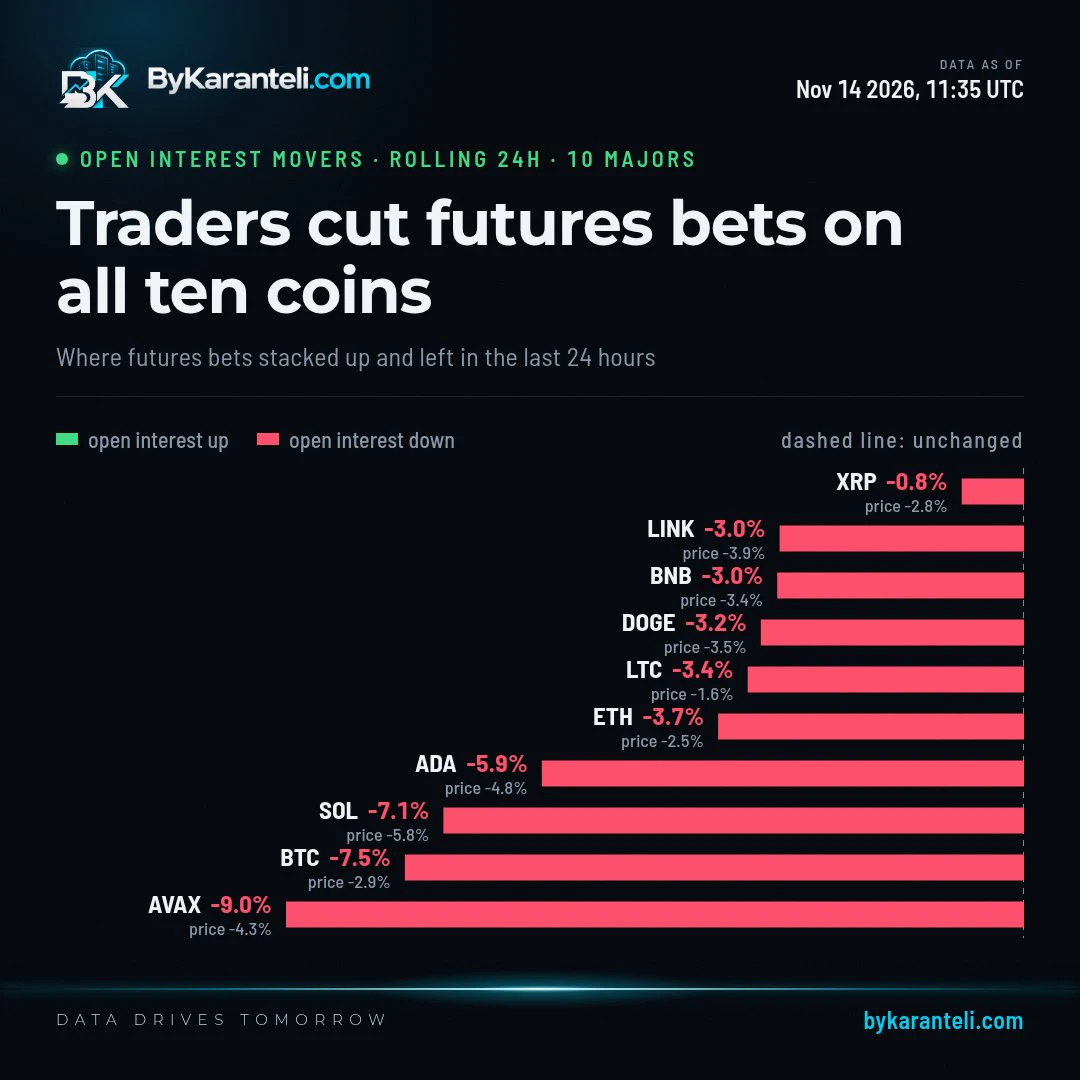
Traders pulled futures money from all ten large coins we track in the 24 hours to Nov 14, and $AVAX led with open bets down 9%. $BTC shed 7.55% of its bets. Only $XRP leaned toward fresh bets on a fall.
post-image
AVAX-0.06%
BTC-0.65%
XRP-1.12%
Load More

Join 40 M users in our growing community

⚡️ Join 40 M users in the crypto craze discussion

💬 Engage with your favorite top creators

👍 See what interests you

Trending Topics

GateIPOAccessAnthropic

314.6K Views2.8K Discussing

Gate IPO Access Phase 3 features Anthropic (ANT), with USDT subscription interest starting from 100 USDT. Successful allocations will be delivered as real shares to Gate Stock Accounts. Indicative price: $70–$78/share Subscription: Nov 12–17 (UTC+8) Allocation is not guaranteed. Please manage risk accordingly.

Dr.HanOxfordUnionSpeech

148K Views611 Discussing

USOctoberPPIBelowExpectations

464.3K Views1.5K Discussing

View More