
Square
Following
Hot
News
Notifications
Profile
Share your thoughts
placeholder
Article
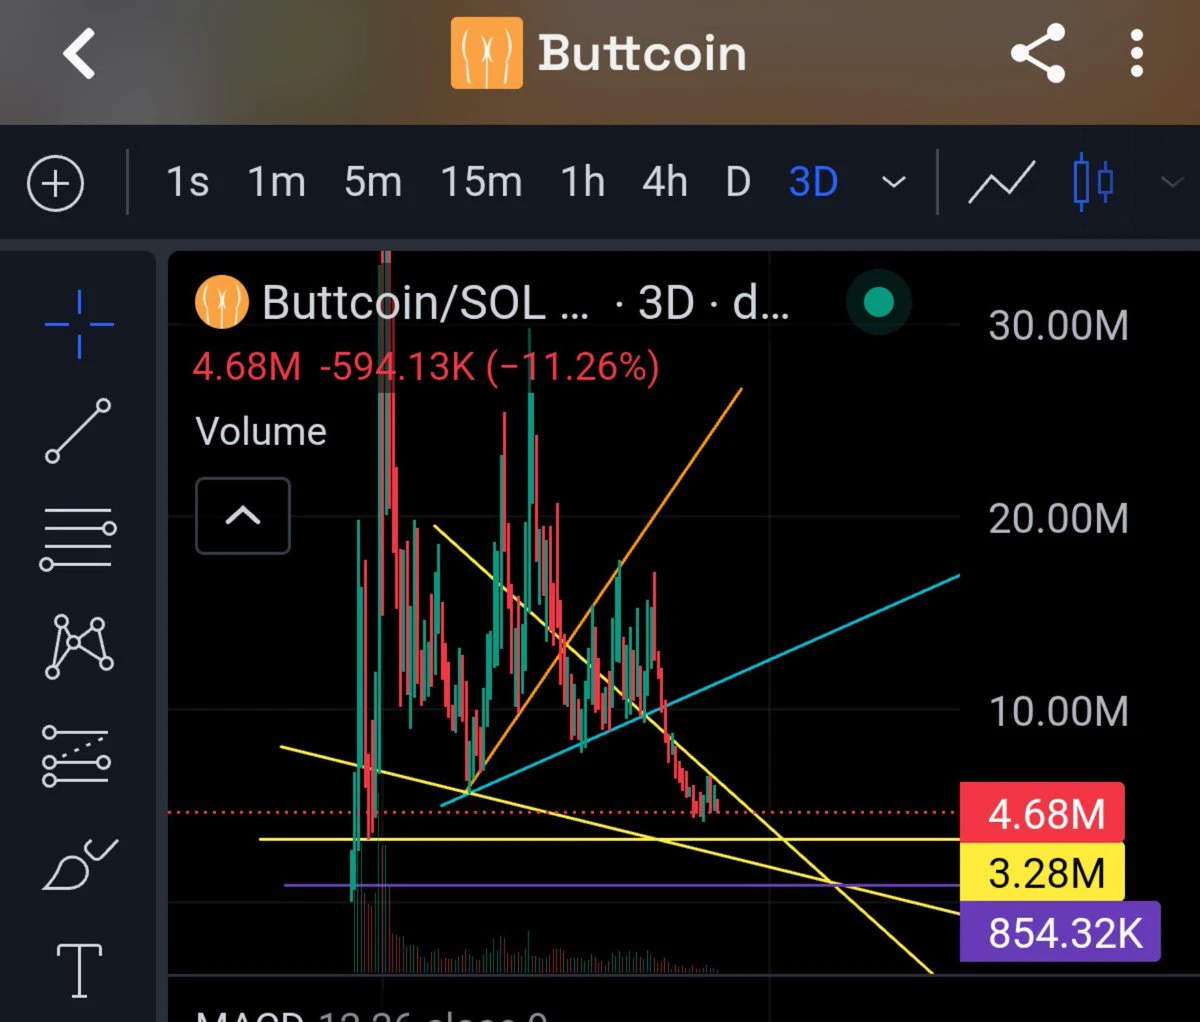
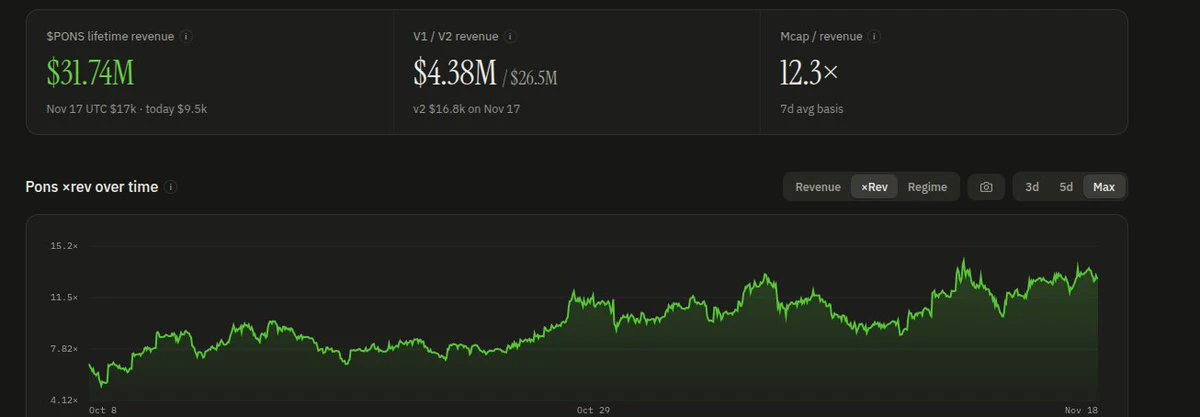
Vlad's cucks still refuse to give up on their pipe dream of the Robinhood chain making a comeback. Their beloved robinhood:0x39dbed3a2bd333467115de45665cc57f813c4571 trades at a higher multiple than PUMP, or even NVDA.
ZERO
post-image
PUMP-1.06%
NVDA-2.97%
Max pain
$buttcoin
post-image
Trenches
DacityCoin
D
bade
b
DacityCoin
DKYc...pump
Market Cap
$.
Change
.
24h Vol
$.
Holders
.
PIEVERSE
P
bade
b
PIEVERSE
0x0e...25a9
Market Cap
$.
Change
.
24h Vol
$.
Holders
.
mihao
m
bade
b
mihao
4Cxj...pump
Market Cap
$.
Change
.
24h Vol
$.
Holders
.
GTAVI
G
bade
b
GTAVI
ERiM...pump
Market Cap
$.
Change
.
24h Vol
$.
Holders
.
GTA6
G
bade
b
GTA6
4kjr...zDnz
Market Cap
$.
Change
.
24h Vol
$.
Holders
.
Turkey’s quantum roadmap runs from 2026 to 2035. The document is thick as a brick, but its core message is simple: build a homegrown quantum technology stack over the next decade. I looked over the two signed documents on my desk, and what really stood out wasn’t the size of the budget, but the fact that the Presidency of Defense Industries was brought in as an implementing agency. That tells you they never intended to take a purely academic approach; they’re aiming for practical engineering and deployment. The roadmap spells out “who does what, how, and to what extent” in the implementation c
post-image
  • 1
$BNB This short trade at 579—is it too early, or perfectly timed?
My criteria are clear: as long as the price hasn't moved above 584, the bearish thesis remains valid.
First, a few key data points: • 4-hour price is 578, while EMA50 is at 617 — clear moving-average resistance, with the trend favoring bears • Stop-loss distance is 1.0%, and the third target is 1.6% away, translating to a risk-reward ratio of about 1.6R at the final target • 1-hour RSI has already plunged to 31; chasing shorts in oversold territory offers poor risk-reward
Specific trading plan: Entry range 577.7–578.7 (short) S
post-image
BNB-0.76%
Crypto Market Updates
live-cover
LIVE27
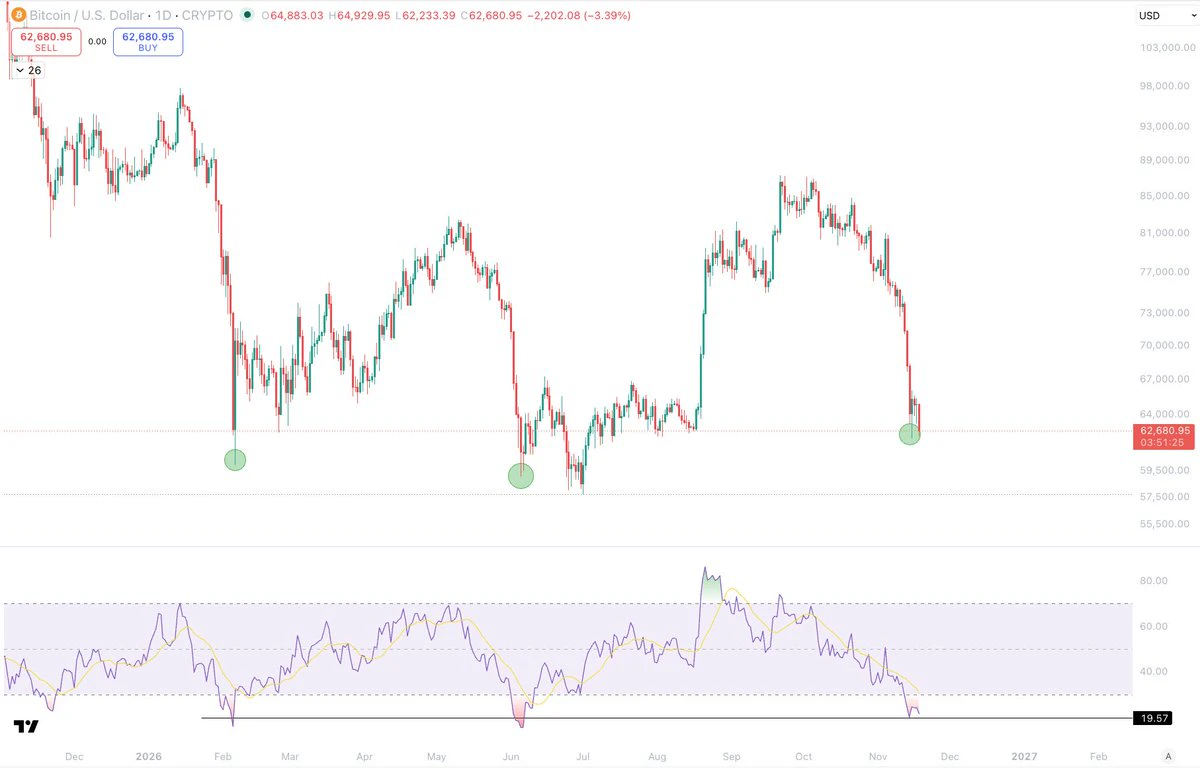
I find this one of the craziest stats of this cycle low area.
Bitcoin has had 3x massive capitulations all around or just above $60,000.
And each of those capitulations has dropped below 20 on the 1D RSI.
For reference, the 2022 bear market had four capitulations and none of them dropped below 20.
In addition, all four of them very at very different price levels.
Never in history has Bitcoin had three capitulation moves that end at the same price.
And no matter how strong they are, all three being below 20 RSI, have not been able to breach $60k.
In the entire history of Bitcoin, there have onl
post-image
BTC-0.67%
Only short coins that have gone absolutely parabolic.
Direction: bearish $PIEVERSE I watched until 5:30 a.m., but my eyes just couldn't stay open any longer. I have to get up tomorrow morning to take my kid to school, and I thought the market makers surely wouldn't cause a sudden wick while I was asleep, right? PIEVERSEUSDT perpetual: currently holding a short position with an unrealized loss of -11,823.40 USDT; PIEVERSE +63.84%
Risk warning: The above is only a record of my personal trading and does not constitute investment advice. Contract trading carries extremely high risks, so please ex
post-image
PIEVERSE+0.58%
I just took a screenshot, and my support points are stuck on the event page, not moving at all. I’m getting pretty anxious watching it. The annual gala is in full swing—click in and check out my progress, and you’ll see. Send me some support points while you’re there. It’s completely free, and after sending them, you can enter the lucky draw too—the prize is yours if you win. I just want a decent ranking; don’t let my page look so bad. Click this link to do it: https://www.gate.com/zh/competition/Annual-Gala?ref_type=165&ch=Direct&ref=UVdMV1w
  • 2
  • 1
Things are getting silly now.
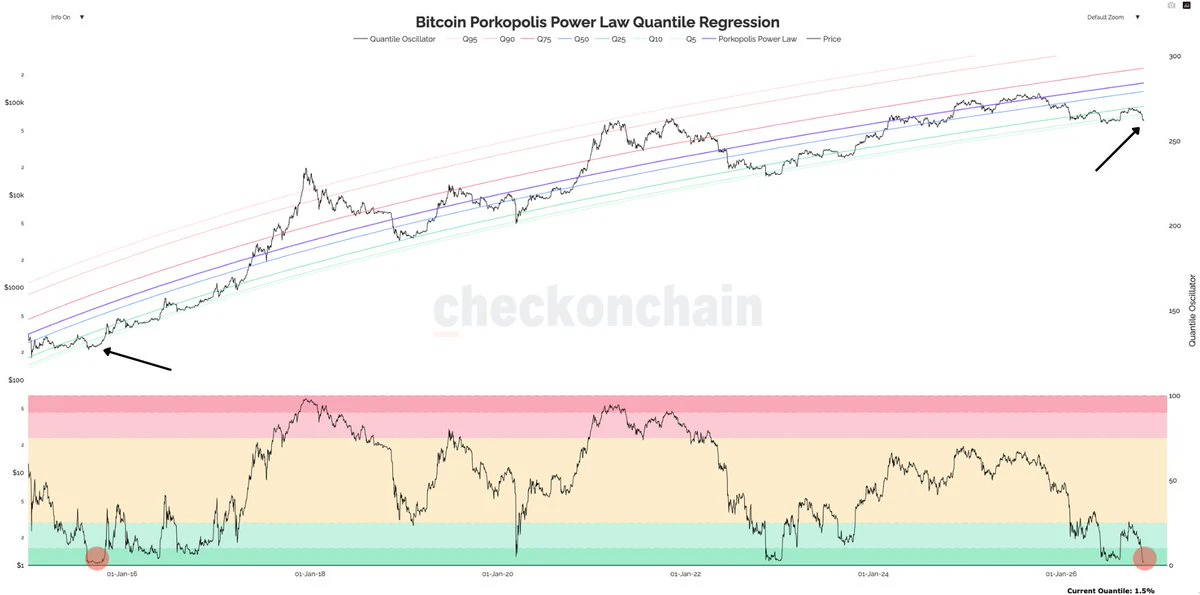
We have just clocked a 1.5% Quantile reading on the Power law regression chart.
There is only one other time in Bitcoins history it has reached this level, and that was at the second low of 2015.
2022 lows only reached 2.5%.
When you get a reading of 1.5%, it means that 98.5% of the future treading days will averagely be higher.
2017 and 2021 tops reached 95%+
When Bitcoin clocked 1.5% back in 2015 it went on to pump for 15 months afterwards.
This, right now, is oversold to a degree that just never really happens.
post-image
BTC-0.67%
  • 1
On November 19, capital flows diverged sharply: BTC alone attracted inflows, while ETH and SOL continued to see outflows. The split in capital sentiment within the major-coin tier widened further, with investors still mostly sitting on the sidelines.
Specific data: $BTC : 11.19 net inflow of 38.12 BTC$ETH : 11.19 net outflow of 2365.57 ETH$SOL : 11.19 net outflow of 51,500 SOL
Capital is clearly taking shelter in BTC, while selling pressure on alts has yet to let up. I just took a loss of over 20,000 last week, so I really don't dare chase right now. I’ll watch to see if BTC can hold its gr
post-image
BTC-0.67%
ETH-1.26%
SOL-0.77%
BTC Faces Capitulation Selling! With $62,000–$66,000 Emerging as Key Support, Has the Market Finally
live-cover
LIVE85
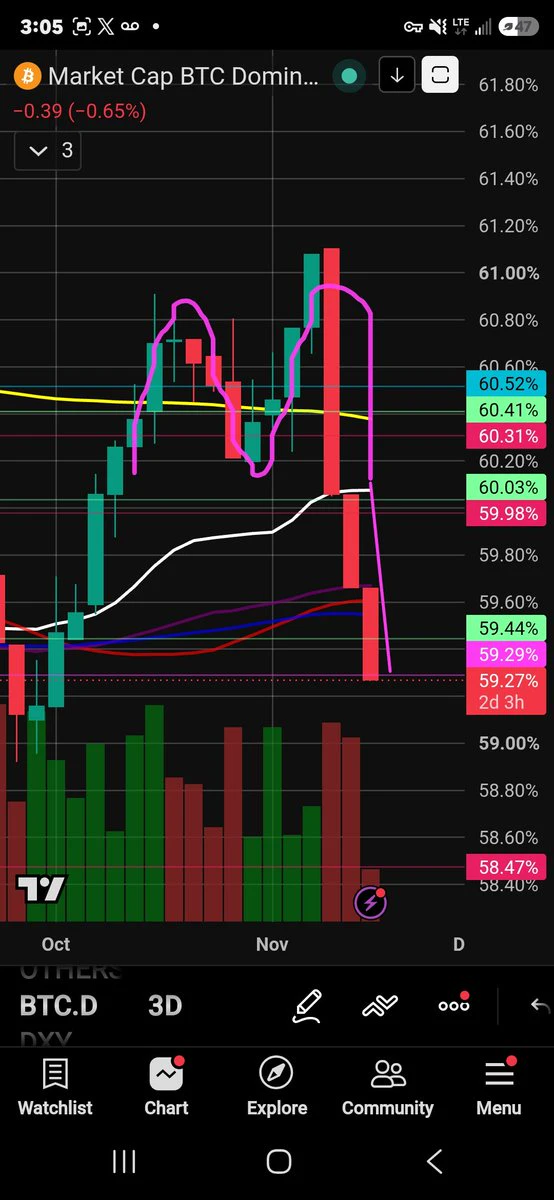
$BTC .D Bitcoin Dominance Hits The Pink M Pattern Target! 💥🎯
post-image
BTC-0.67%
  • 1
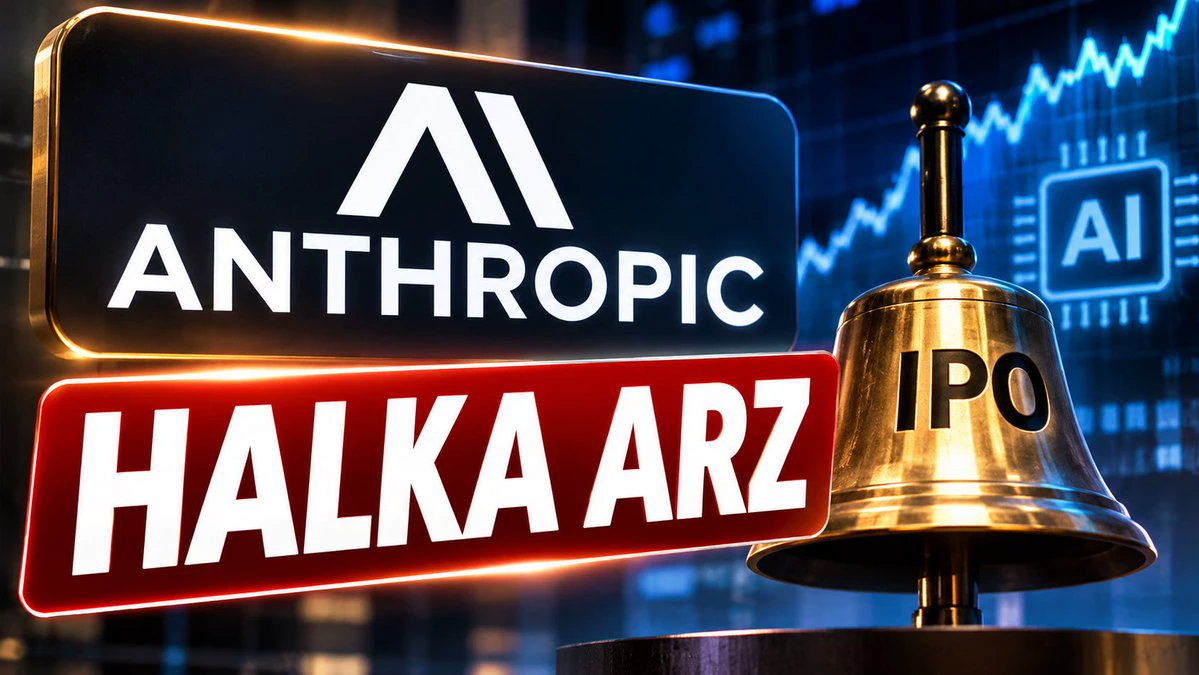
#Anthropic is considering IPO pricing in the range of approximately $80-85 per share.
This is above the previously disclosed $70-78 range. At the upper end ($85), the base IPO could raise up to approximately $70 billion. Adding the $26 billion private sale, the total could exceed approximately $96 billion, making it the largest IPO in history.
#ANT $ANT
post-image
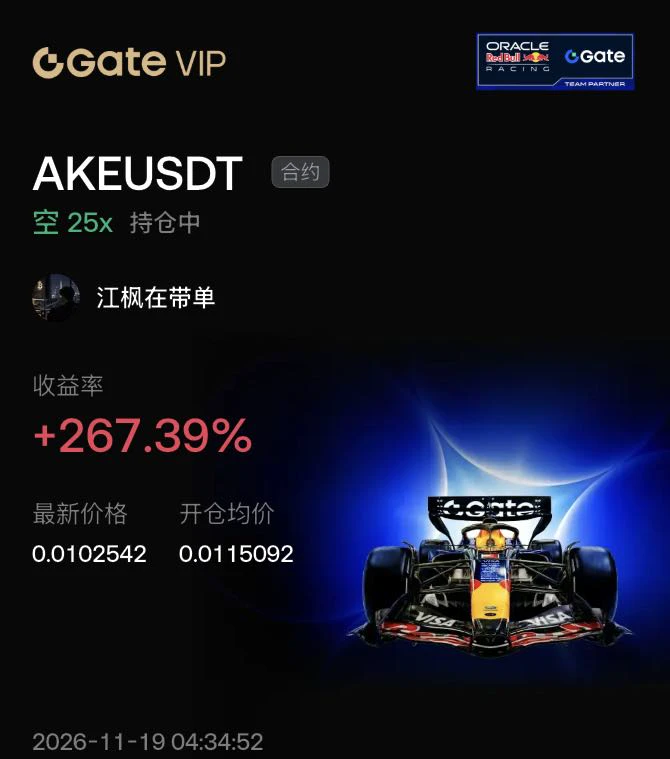
In the chat, I said that coins that rise threefold in a day fall just as fast. $AKE was still at 0.0027 at the close on November 12, rose 348.7% in a single day on the 13th, and surged to 0.018 on the 14th before heading steadily downward.

With no new news to support it, the price was driven entirely by futures capital. Once the buyers left, the price fell on its own, already more than 90% below its peak.

The short opened at 0.0115 is now at 0.0103, with 25x leverage and a 267% gain. The faster it rises, the faster it falls. $BTC #Gate年度荣耀盛典 $EVAA
post-image
AKE+6.39%
BTC-0.65%
EVAA-0.42%
  • 1
SanDisk and ETH are controlled by the same market maker!!!
First, let me show you the evidence—the two charts. At the end of the article, I’ll explain the logic behind my judgment.

First, let me explain market manipulation, the next supercycle (the main direction for crypto going forward), and the next opportunities in the U.S. stock market. I hope this helps you (please be patient; writing this took effort).

Deep Dive: Who Is Manipulating the Market? Uncovering the Playbook Behind the Next “Supercycle”

Many people are waiting for a bull market, but my perspective has moved beyond the chart
SNDK-0.18%
BTC-2.21%
ETH-1.26%
BLK-1.00%
IBIT-2.21%
  • 9
  • 1
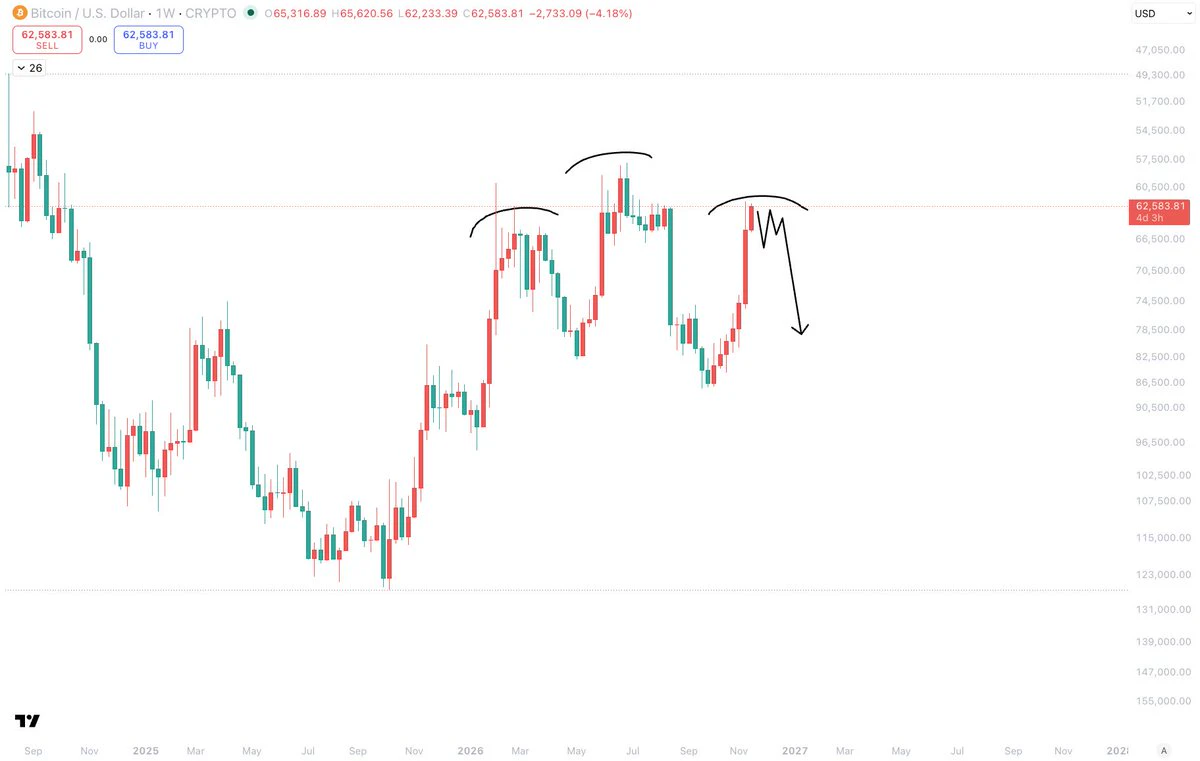
All I can currently see is a large head and shoulders pattern.
I've inverted the chart for even deeper illustrative purposes.
We have had 3x of the largest capitulations ever and held above $60k.
And the chart currently looks like this.
And we're currently on the 7th red week in a row.
The all time record is 9 red weeks, and below that, is this period right now.
So this is the second longest period of red weeks, and price is still above $60,000.
Invalidation is of course a loss of the $58k low.
post-image
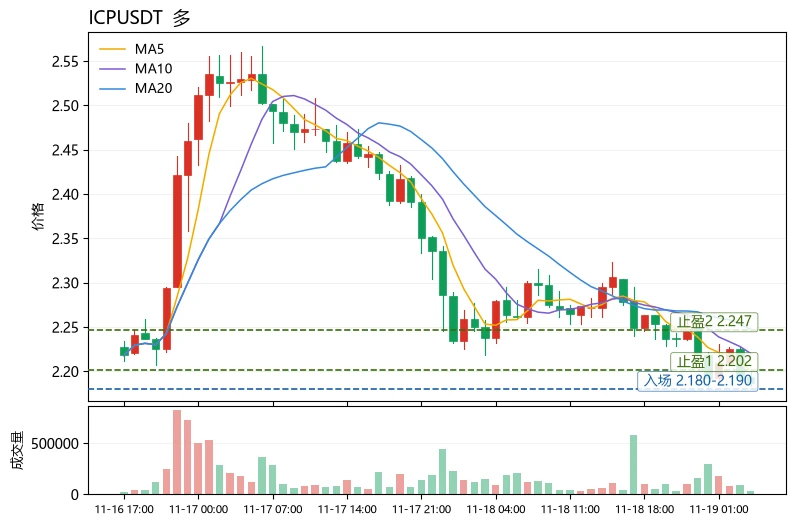
The most unusual detail today is not the drop, but the funding rate: $ICP fell 3.44% over 24 hours, while the funding rate was -0.0041%, meaning shorts still have to pay. Weak prices and a negative funding rate indicate that short sellers are already crowded onto one side, a setup that is most prone to triggering a short squeeze wick amid extreme fear (index 11).
Technically, ICP is currently at 2.187, sitting right on the lower Bollinger Band at 2.18097, with an RSI of just 34.8, close to oversold. But MA5=2.2018 remains below MA20=2.2476, and the MACD histogram at -0.002891 remains bearish,
post-image
TQQQB
TQQQBTQQQB
Four.meme
MC:$3.36KHolders:2
0%
ICP-1.14%
HEI-4.57%
$EDU is building bullish momentum, with price climbing toward $0.0480. A confirmed breakout could push it higher toward $0.0490. Entry: $0.04720–$0.04750 Target prices: $0.04800 / $0.04850 / $0.04900 Stop-loss: $0.04670
post-image
EDU-3.44%
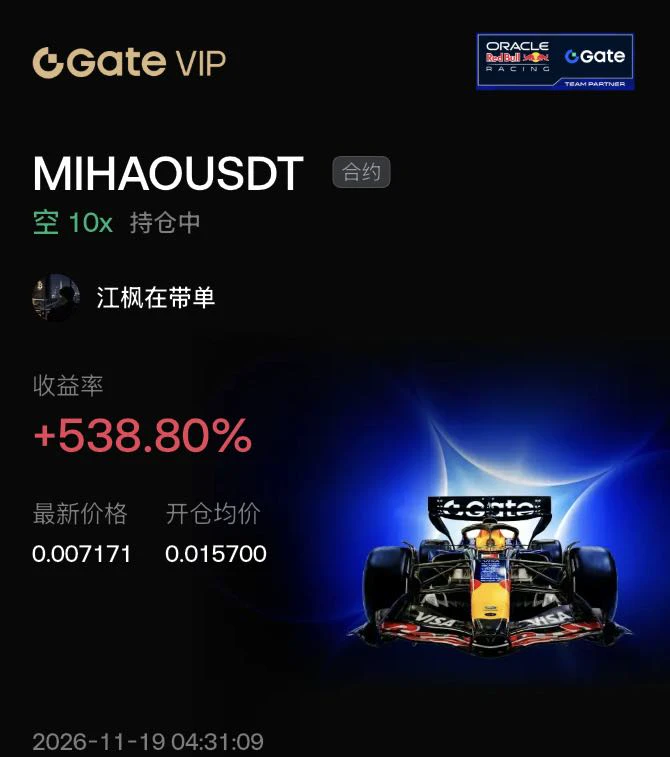
A meme coin’s end isn’t signaled by a price drop, but by a decline in its number of holders. MIHAO’s holder addresses fell nearly 9% in one day, from over 15,000 to over 13,000.

A major influencer changed their profile picture to it, pushing its market cap above 14 million in just an hour. Now it’s below 1 million, down 97% from its peak. People watching it have left, and its holders are leaving too.

A short position opened at 0.0157 is now at 0.0072. At 10x leverage, that’s a 538% gain. Once the hype fades, all that’s left is the way down. $SNDK #黄金跌至3800美元
post-image
SNDK-0.18%
  • 2
Load More

Join 40 M users in our growing community

⚡️ Join 40 M users in the crypto craze discussion

💬 Engage with your favorite top creators

👍 See what interests you

Trending Topics

NvidiaQ3RevenueHits115.8B

234.8K Views7.2K Discussing

NVIDIA is set to report quarterly earnings after the U.S. market close on Nov. 17, with investors focused on AI chip demand, data center revenue and forward guidance. Can NVIDIA deliver another earnings beat? If results or guidance disappoint, could it drag down AI-related assets and broader crypto risk sentiment?

GateAnnualGala

2.6M Views39.4K Discussing

GateMoneyExpandsGBPandEURPayments

328.1K Views1.6K Discussing

View More