











#美股财报季 #Gate广场万圣节 The key things this week are the Fed’s stance on December and whether GDP, PCE, and employment data confirm that inflation is cooling.
The rate decision itself is already known; what can really change the outlook is any shift in the wording of the policy statement.
1. Policy Outlook: Watch Inflation, Employment, and December Signals
I’m more optimistic when I see these kinds of remarks:
· Acknowledging that inflation is continuing to ease, especially with core PCE cooling for consecutive months.
· Paying more attention to downside employment risks, such as slower hiring and a rising unemployment rate.
· Clearly stating that more data is needed for December, indicating that a pause now does not mean rate hikes are over.
The signals that would make me more cautious are also clear:
· Continuing to stress that inflation is still high, especially by viewing rising oil prices as a risk of second-round inflation.
· Maintaining a bias toward “further tightening,” which would lead the market to reprice the odds of a December rate hike.
· Dissenting votes in favor of a rate hike, indicating continued significant hawkish pressure within the Fed.
The market has already priced in no change in rates in October. The probability of rates remaining unchanged in October is above 90%, shifting the focus to December; expectations of another rate hike in December remain strong.
2. Data Analysis: Focus First on Core PCE, Then Employment. Core PCE is the Fed’s most important inflation gauge, determining whether it needs to keep fighting inflation. Employment determines whether the economy can withstand higher rates, while GDP reflects overall economic momentum.
Three combinations are most likely to change rate expectations:
· Falling core PCE + weakening employment: Rate-cut expectations rise, while the dollar and Treasury yields tend to weaken.
· Rising core PCE + strong GDP: The odds of a December rate hike increase, while the dollar and Treasury yields tend to strengthen.
· Falling core PCE + steady employment: Soft-landing trades dominate, relatively benefiting U.S. stocks.
Therefore, core PCE is the first thing to watch, employment is second, and GDP is third.
With oil prices continuing to rise, it’s also important to watch whether energy prices spill over into services and wages.
3. Market Watch: Look at the Dollar and Treasuries First, Then U.S. Stocks and BTC
After the decision, I’ll watch the following in order:
· The U.S. Dollar Index: A stronger dollar usually weighs on gold and crypto assets.
· Treasury yields: Especially the two-year and 10-year yields, which determine the discount rate for U.S. stocks.
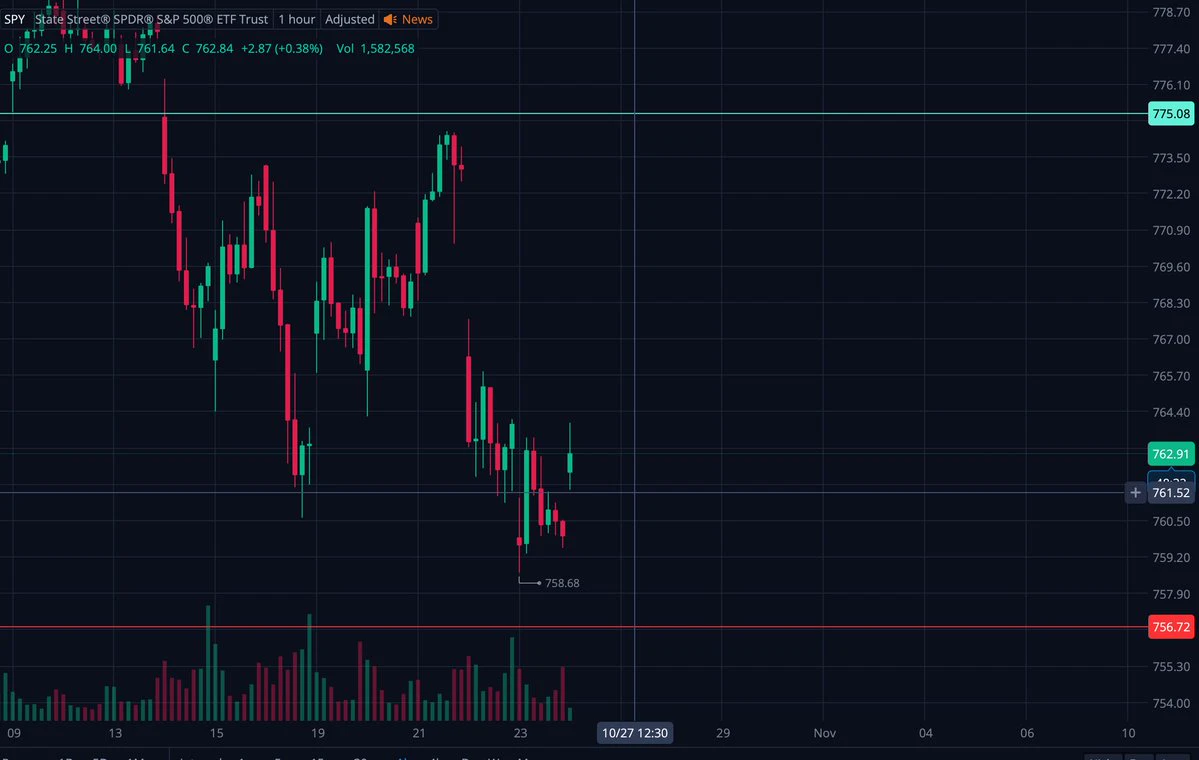
· U.S. stocks: Tech valuations are more sensitive, and high rates weigh on growth stocks.
· BTC: It tends to react later, mainly following the dollar, liquidity, and risk appetite.
If the statement is hawkish, the typical combination is a rising dollar and Treasury yields, pressure on gold, and increased volatility in BTC.
If the statement is dovish, the dollar and Treasury yields fall first, followed by support for U.S. stocks and BTC.
4. Trade Review: I Prefer to Wait for the Decision
I’ll prepare scenarios in advance, but won’t take a large directional position before the decision.
Expectations for the rate itself have changed little; the market is more focused on how the statement assesses inflation, employment, and the path ahead. The actual market moves are consistent with the view that rates will hold in October and December remains a key window.
The outcomes that would truly require me to revise my view are:
· An unexpected rate hike or a strongly hawkish statement: I would need to raise my expectations for the dollar, Treasury yields, and the odds of a December rate hike.
· A significant upside surprise in core PCE: This would reinforce the case for rates staying high for longer.
· A rapid weakening in employment: Even if inflation remains high, this would increase concerns about a policy shift.
· BTC breaking out on rising volume against the trend: This would indicate an independent improvement in liquidity or sentiment.
If the Fed’s remarks conflict with subsequent data, I’ll give more weight to core PCE and employment. The Fed’s core task right now is to fight inflation while also considering employment; short-term policy guidance can change, but two consecutive months of data provide stronger evidence of the trend.
The rate decision itself is already known; what can really change the outlook is any shift in the wording of the policy statement.
1. Policy Outlook: Watch Inflation, Employment, and December Signals
I’m more optimistic when I see these kinds of remarks:
· Acknowledging that inflation is continuing to ease, especially with core PCE cooling for consecutive months.
· Paying more attention to downside employment risks, such as slower hiring and a rising unemployment rate.
· Clearly stating that more data is needed for December, indicating that a pause now does not mean rate hikes are over.
The signals that would make me more cautious are also clear:
· Continuing to stress that inflation is still high, especially by viewing rising oil prices as a risk of second-round inflation.
· Maintaining a bias toward “further tightening,” which would lead the market to reprice the odds of a December rate hike.
· Dissenting votes in favor of a rate hike, indicating continued significant hawkish pressure within the Fed.
The market has already priced in no change in rates in October. The probability of rates remaining unchanged in October is above 90%, shifting the focus to December; expectations of another rate hike in December remain strong.
2. Data Analysis: Focus First on Core PCE, Then Employment. Core PCE is the Fed’s most important inflation gauge, determining whether it needs to keep fighting inflation. Employment determines whether the economy can withstand higher rates, while GDP reflects overall economic momentum.
Three combinations are most likely to change rate expectations:
· Falling core PCE + weakening employment: Rate-cut expectations rise, while the dollar and Treasury yields tend to weaken.
· Rising core PCE + strong GDP: The odds of a December rate hike increase, while the dollar and Treasury yields tend to strengthen.
· Falling core PCE + steady employment: Soft-landing trades dominate, relatively benefiting U.S. stocks.
Therefore, core PCE is the first thing to watch, employment is second, and GDP is third.
With oil prices continuing to rise, it’s also important to watch whether energy prices spill over into services and wages.
3. Market Watch: Look at the Dollar and Treasuries First, Then U.S. Stocks and BTC
After the decision, I’ll watch the following in order:
· The U.S. Dollar Index: A stronger dollar usually weighs on gold and crypto assets.
· Treasury yields: Especially the two-year and 10-year yields, which determine the discount rate for U.S. stocks.
· U.S. stocks: Tech valuations are more sensitive, and high rates weigh on growth stocks.
· BTC: It tends to react later, mainly following the dollar, liquidity, and risk appetite.
If the statement is hawkish, the typical combination is a rising dollar and Treasury yields, pressure on gold, and increased volatility in BTC.
If the statement is dovish, the dollar and Treasury yields fall first, followed by support for U.S. stocks and BTC.
4. Trade Review: I Prefer to Wait for the Decision
I’ll prepare scenarios in advance, but won’t take a large directional position before the decision.
Expectations for the rate itself have changed little; the market is more focused on how the statement assesses inflation, employment, and the path ahead. The actual market moves are consistent with the view that rates will hold in October and December remains a key window.
The outcomes that would truly require me to revise my view are:
· An unexpected rate hike or a strongly hawkish statement: I would need to raise my expectations for the dollar, Treasury yields, and the odds of a December rate hike.
· A significant upside surprise in core PCE: This would reinforce the case for rates staying high for longer.
· A rapid weakening in employment: Even if inflation remains high, this would increase concerns about a policy shift.
· BTC breaking out on rising volume against the trend: This would indicate an independent improvement in liquidity or sentiment.
If the Fed’s remarks conflict with subsequent data, I’ll give more weight to core PCE and employment. The Fed’s core task right now is to fight inflation while also considering employment; short-term policy guidance can change, but two consecutive months of data provide stronger evidence of the trend.