







Share your thoughts
placeholder
Article
crypto makret update
live-cover
LIVE670
The privacy sector all moved today, but it has shifted from broad-based gains to divergence.
ZEC 1,027 (weekly +23.98%, MACD above the zero line, trend phase)
DASH 68.16 (+9.02%, volume 11.2x average)
LTC 54.70 (+7.7%, following the rally)
ZEN 7.085 (−0.7%, the only one to close down)
DASH touched a high of 74.63 before falling back to 68.16, with the upper wick accounting for half of the day's range. 11x volume combined with a long upper wick = high-level turnover, not a breakout.
$ZEC $DASH
post-image
ZEC+1.65%
DASH+20.76%
LTC+9.01%
ZEN0.00%
#Gate事件合约晒单挑战
PONS IS MAKING NOISE
Pons is suddenly one of the most watched launchpad stories on Robinhood Chain. The latest GateNews data shows Pons generated $1.84M in 24-hour revenue, surpassing Pump.fun’s $1.18M. That is a major signal because revenue reflects actual activity flowing through the platform rather than price movement alone.
THE NUMBERS MATTER
Pons generated roughly $660K more revenue than Pump.fun during the reported 24-hour period, meaning Pons was ahead by about 56% on that comparison. This puts the focus directly on activity, users and transaction flow around Robinhood Ch
post-image
PONS+33.01%
PUMP-5.21%
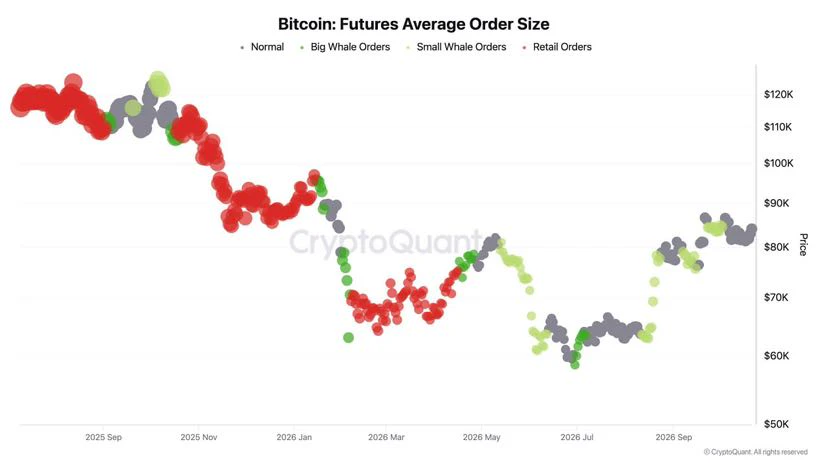
The essentials… Let’s talk about Bitcoin’s long-term cycle and some of my personal views, for reference only—not investment advice. These are merely records of historical reviews.
As seen in Chart [1], the price has formed a double-bottom pattern around a major level and a high-volume trading zone; based on the volume-price relationship, after a prolonged decline, two waves of panic-driven bottom testing have occurred. Following two waves of support and consolidation, the price broke through the bottoming region on August 17 with a high-volume bullish weekly candle, gaining nearly 26.5%. Judgi
This short trade was quite grueling. When I entered, the price was still fluctuating at a high level and whipsawed several times, with the position briefly showing an unrealized loss. At the time, I chose not to hold through it and wait for the market to turn. Instead, I placed the stop-loss above the previous high to contain the worst-case outcome. I also deliberately kept the position size small, leaving myself room to reassess.

After the downward move was confirmed, the price action became much smoother. Once the trade had run for a while, I first took profit on most of the position, whil
post-image
HEMI-22.52%
BTC+0.56%
DOGE+9.71%
STOP SCROLLING. THE CAPITAL FLOW IS LOUD.
$BTC ETFs have now recorded 3 straight weeks of net inflows.
Three weeks of investors adding exposure.
The headlines can debate Bitcoin.
The money is already voting. ₿
#BTCReclaims80K
post-image
BTC+0.54%
If you’re not confident about a trade, taking a look keeps you clear-headed; buying even one lot is foolish. This move has already laid out the answer: to those who haven’t gotten in, hear me out—now is not the time to rush. Once the next round of structure emerges, I’ll alert you immediately. Market opportunities reveal themselves to those who wait, and profits come from holding.
$ADA $ETH
post-image
ADA+4.16%
ETH+1.24%
Everyone’s watching HYPE bleed—but the 4H chart just whispered a secret the crowd missed.

$HYPE /USDT - LONG

Trade Plan:
Entry: 85.409 – 85.721
SL: 84.072
TP1: 86.685
TP2: 87.431
TP3: 88.551

Why this setup?
Why now? The 1D trend is bullish, and the 4H MTF is *Armed* with 95% confidence. RSI on 15m sits at 58.18—not overheated, just warming up. ATR (1h) at 0.622 suggests volatility is coiled. Entry zone: 85.409–85.721. Targets: TP1 86.685, TP2 87.431. The invalidation line at 82.117 is your safety net. This isn’t a gamble—it’s a precision setup with a 2.4R to first target.

Debate:
If pr
HYPE+0.41%
🔥 On September 6, we’ll host an exclusive live class where you’ll truly learn.
You’ll learn how to make the most of the crypto sector, guided by a team of experts.
Reserve your spot with free access before they run out:
post-image
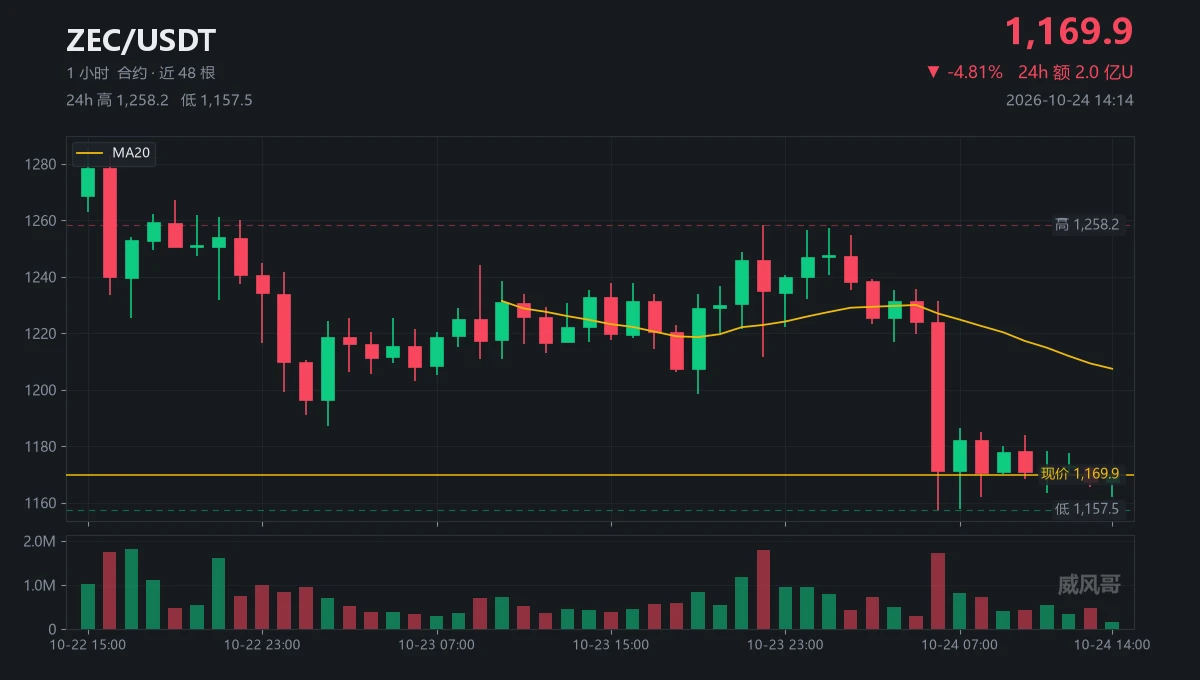
Everyone’s long ZEC while the 4h quietly flips—who’s holding the bag at 1034?

$ZEC /USDT - SHORT

Trade Plan:
Entry: 1030.6 – 1039.0
SL: 1087.2
TP1: 995.5
TP2: 969.3
TP3: 929.9

Why this setup?
Why now?
- 1D trend says bullish, but the 4h MTF is screaming SHORT at 84% confidence—that’s a divergence most retail misses.
- RSI on the 15m is overheated at 73, while ATR (16.8) shows room to bleed.
- Entry zone 1030–1039 is a liquidity magnet; TP1 at 995.5 is a 3.8% drop before the daily bias even blinks.
- This isn’t a trend trade—it’s a mean-reversion sniper shot against the macro tide
ZEC+1.61%
Everyone’s staring at the wrong side of DOGE while the 4h chart whispers a trap.

$DOGE /USDT - SHORT

Trade Plan:
Entry: 0.09084 – 0.09122
SL: 0.09335
TP1: 0.08929
TP2: 0.08812
TP3: 0.08638

Why this setup?
Why now? RSI on the 15m is screaming at 72.87—overbought in a range. The primary signal says SHORT at 0.09103, targeting 0.08812, but the alt path flips long to 0.09327. With 77% confidence and a tight 0.000745 ATR, the market is coiling. This isn’t a breakout; it’s a liquidity grab waiting for late longs.

Debate:
If the daily is range-bound, do you fade this 4h pump to 0.09122 or rid
DOGE+9.71%
Fed Policy Remains a Key Market Driver Ahead of the Next Inflation Data Release
live-cover
LIVE396
September 6 $BTC early-morning analysis
The 4-hour chart continues its range-bound recovery, up 0.78%, with net capital inflows of 143 million and buying funds continuing to return. The price has held above the Bollinger middle band at 79465.4, with solid support at the 78618 low below; large sell orders are placed in the order book, indicating clear overhead selling pressure. The Bollinger upper band at 82352.8 is strong mid-term resistance, while the lower band at 76578 serves as a key defense level. The market is experiencing a recovery rebound after the decline and has not yet entered a s
post-image
BTC+0.54%
ETH+1.21%
Reduce the position at 80; target 2,500. A breakout would be enough.
post-image
I had just switched the app to the background when it shot up in an instant—is it playing hide-and-seek with me? A few days ago, the last thing I looked at before bed was ZORA. It had been moving sideways at the bottom for several days, with funds quietly entering and buy orders piling up, yet the price remained suppressed—a textbook night before a breakout.
I said it then: don’t hesitate to go long. I entered at 0.00793, and when I woke up this morning, 0.00885 had already given me the answer: +281.6% secured.
Don’t let profits inflate, and don’t let drawdowns cause despair. This gain feels g
post-image
ZORA-1.45%
LAB+2.09%
DOGE+9.71%
Today is the weekend, and the market is fluctuating downward. Congratulations to everyone who followed me into opening short positions last night—you all made a killing. My short position also raked in 1.6 million. Today, I’ll wait for the right opportunity to continue opening short positions. Ethereum is still headed for 2350; once it rebounds to 2470, you can confidently open short positions. Today is the weekend, and the market is fluctuating downward. Congratulations to everyone who followed me into opening short positions last night—you all made a killing. My short position also raked in
post-image
ETH+1.24%
Why is everyone ignoring LINK/USDT’s 95% confidence squeeze right now?

LINK/USDT - LONG

Trade Plan:
Entry: 11.894 – 11.936
SL: 11.711
TP1: 12.068
TP2: 12.171
TP3: 12.324

Why this setup?
- 4h bias LONG (95%) + 1D trend bullish = stacked timeframe alignment.
- RSI 15m at 62.45—momentum hot, not overbought—room to run.
- Entry at 11.915, TP1 12.068, TP2 12.171. ATR 1h (0.085) shows tight risk: SL 11.711 is only ~1.7% away.
- Why now? The “Armed” status means the trigger is set—waiting for a 1h close above 11.936 to ignite the move.

Debate:
Are you fading this 95% long or loading bef
Everyone’s watching HYPE bleed—but the 4H tape just whispered a secret the crowd missed.

HYPE/USDT - LONG

Trade Plan:
Entry: 85.541 – 85.841
SL: 84.249
TP1: 86.773
TP2: 87.494
TP3: 88.576

Why this setup?
- RSI 15m at 60.38: Momentum is re-loading, not exhausting.
- ATR 1h (0.60) is tight—volatility is coiled, and 95% confidence LONG says the spring is set.
- 1D trend: bullish. The pullback to 85.691 is a gift, not a trap. TP1 at 86.773 is the first door; TP2 at 87.494 is the real prize.
- Why now? The clock says 17:17 UTC—liquidity is thin, stops are stacked below 85.541. Smart mon
HYPE+0.52%
This move doesn’t even require me to think—the account is dancing on its own. $DELL Just holding it and it hit a new high; I really didn’t see that coming.

I just checked the account: entry price 453.65, current price 522.51, return +731.52%. The profit rhythm was timed perfectly. Don’t ask me how I managed to hold it—when the logic is solid enough, your hands won’t shake. This wave has been a very satisfying big win, and the patience earlier wasn’t wasted.

I actually had my eye on it when the market was grinding along the bottom. Volume expanded but the price didn’t rise, clearly showing
post-image
DELL-0.78%
LAB+2.09%
ZEC+1.61%
Everyone’s staring at SOL’s 103.1—but the real trap is hiding in the 15-minute RSI.

$SOL /USDT - SHORT

Trade Plan:
Entry: 103.0 – 103.2
SL: 104.5
TP1: 102.1
TP2: 101.4
TP3: 100.4

Why this setup?
• RSI at 61.91 on the 15m screams overbought *before* the 4h rejection zone—this is a classic fade setup.
• Trend is range-bound on 1D, so 103.1 is the pivot: shorts target 102.1 (TP1) and 101.4 (TP2), while invalidation sits at 102.3.
• Why now? ATR (0.56) shows low volatility—meaning the squeeze is building, and the first move past 103.2 likely triggers the cascade.

Debate:
Do you trust t
post-image
SOL+2.55%
Load More

Join 40 M users in our growing community

⚡️ Join 40 M users in the crypto craze discussion

💬 Engage with your favorite top creators

👍 See what interests you

View More