



Square
Following
Hot
News
Profile
Share your thoughts
placeholder
Article
$S SUSDT - bull market!
The daily chart of S has surged by approximately 260% in just a few weeks.
Price has broken above its previous high and is currently attempting to establish support above it.
Higher highs, higher lows, and no break below the previous swing low.
This is what a bull market looks like, and the chart says it all.
The next major resistance is at $0.09. A confirmed breakout above this level could open the door to a massive upside move.
Keep it on your radar and don't miss this opportunity.
post-image
S+25.83%
Here’s a Way to Predict When AI Chatbots Will Turn Bad
Physicists at George Washington University have published a formula that estimates how many good answers an AI chatbot will give before it slips into a bad one, and early tests suggest it works.
The study, by Neil Johnson and Frank Yingjie Huo, appeared in the journal Patterns and builds on a preprint, a version posted publicly before formal peer review, first released in February.
⚠️ Personal market analysis only. NFA — manage risk and DYOR.
Educational content, not investment advice or a recommendation to buy, sell, deposit, or withdraw
post-image
The post-quantum narrative has been pretty hot lately, with several more projects popping up besides pqc. Let’s trace it back and see who actually lit the fire.
The spark was strk. On the 8th, Starknet said it was considering moving off Ethereum and building its own chain, with the goal of becoming the first fully post-quantum-resistant chain.
On the 11th, the head of starkware came out again, saying AI is helping quantum computers speed up the cracking of Bitcoin and Ethereum signatures, and that everyone should enter “bunker mode.”
strk has doubled over the past few days, with its market cap
post-image
STRK+19.88%
ETH+1.58%
BTC+1.15%
MEME+0.99%
Smart money is quietly loading RLC while everyone else is still sleeping on this setup.

$RLC /USDT - LONG

Trade Plan:
Entry: 1.0455 – 1.0699
SL: 0.9405
TP1: 1.1456
TP2: 1.2042
TP3: 1.2921

Why this setup?
Why now? The daily trend is bullish and the 1h price sits at 1.0577, which is also the entry reference point for a long bias. The 15m RSI at 40.92 signals room to run before overbought, while the 1h ATR of 0.04883 confirms enough momentum to push toward the first target at 1.1456. The higher time frame structure supports a move to TP2 at 1.2042, but the trade is invalidated if the invali
post-image
RLC+9.60%
Micron $MU netted $37.7 billion in one quarter
The buyback plan was expanded from $10 billion to $35.16 billion, taking effect on December 9, 2026.
Meanwhile, Micron's quarterly net profit surged more than tenfold year over year.
After the earnings report was released, the stock price barely moved.
Why?
Because the market may have already priced in the positive news.
What is truly worth watching is not how much Micron earned, but how long this storage cycle can continue and whether future results can keep exceeding market expectations.
Strong performance does not necessarily mean the stock pr
post-image
MU-0.69%
  • 4
Layout: Bitcoin, Ethereum, Dogecoin
live-cover
LIVE880
  • 3
When Volcker took over the Federal Reserve in 1979, the year-over-year U.S. CPI surged to 14.8% in March 1980. He did not choose to “wait and see.” Instead, he pushed the federal funds rate to around 20% and used money-supply targets to force inflation down. Three years later, CPI had fallen to around 3%, but the cost was two recessions, in 1980 and 1981–1982. The unemployment rate exceeded 10.8% by the end of 1982. Midwestern farmers, squeezed by high interest rates and collapsing land prices, drove their tractors to Washington and blocked the entrance to the Federal Reserve. That was not pol
post-image
$APT
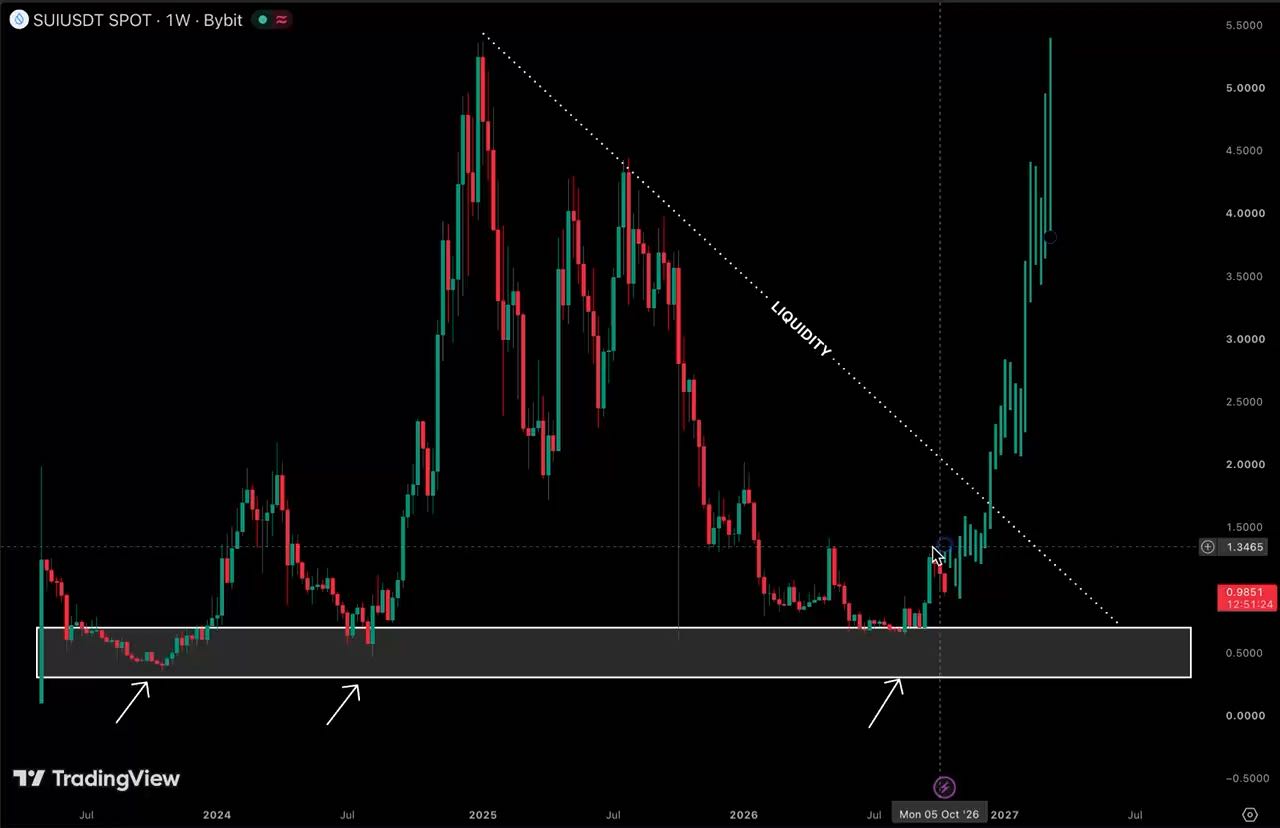
What a disgusting chart. It's very clear that $SUI won out against it.
There is some silver lining in PA if you're interested in a trade.
Good Luck.
post-image
APT+5.41%
SUI+2.07%
XAG+1.02%
Daily Trading - BTC
it's always like this, the price matched the analysis but hit SL before continuing its decline 😅.
$BTC ‌
CryptocurrencyAnalysis
Just watch and pay attention. The price will drop temporarily. I don't hold positions for too long here.
$BTC ‌
repost-content-media
BTC+1.15%
#GateAtTOKEN2049
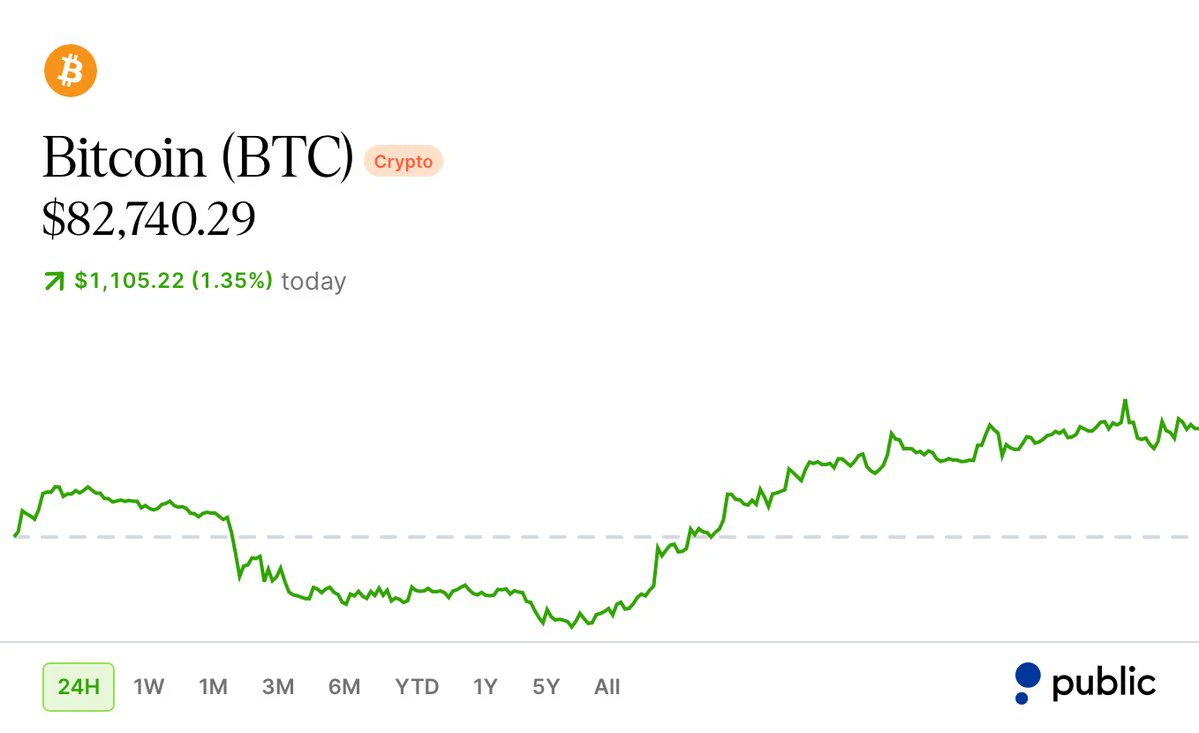
Today is Monday and Crypto market seems staying stable as yesterday and keeps it’s yesterday rise , also if today market moves upside again Hopefully market will recover but if not and go below $70k’s this is also affects negatively ..
post-image
  • 2
Elk dinner at my wife's favorite restaurant in Breckenridge.
Perfection 🤌
post-image
$NEAR You should definitely hold on to good coins—they've already multiplied several times by now, and they're the ones that really make money
NEAR+11.69%
Goldman Sachs connected its $100 billion money market fund to Avalanche
Without issuing a single token
BlackRock and Franklin actually issued tokens, with the shares living directly on-chain
Goldman didn’t do that—the fund is still the same fund as before
The chain is only responsible for settlement
Money is piling into this chain. Tokenized stocks brought in $131 million over the past seven days
That’s eight times the runner-up, more than all the other chains combined
AVAX closed at 7.56 four weeks ago and is at 10.90 today
Bitcoin gained only 7% over the same period
Not a s
post-image
GS+1.70%
AVAX+5.72%
BLK+1.35%
BTC+1.15%
On Ethereum’s one-hour chart, the bullish momentum has clearly weakened after this rally, and the risk of a pullback is gradually accumulating. Technically, the price came under pressure and retreated after surging to touch the upper band, and has now fallen below it. Although the price is temporarily holding above the Bollinger middle band, trading volume during the rise has shrunk significantly compared with the earlier rally, showing insufficient willingness to chase higher. This rally was driven by short-term funds and lacks sustained buying support. The high-level consolidation is a typic
post-image
ETH+1.59%
$dope falling wedge pump coming
solana:33jENUQnjoitkMFpvNJcSHyLAHFWJuHwT6E3E8CNpump
33jENUQnjoitkMFpvNJcSHyLAHFWJuHwT6E3E8CNpump
#crypto
post-image
SOL+1.64%
$S remains strong, and the risk of overcrowding is also rising
$S 24 hours +26.88%, current price 0.06113. The 1-hour and 4-hour RSI are 74 and 79, respectively. The strength is real, and so is the overcrowding. The question is not whether it can continue rising, but who will be willing to catch it during the first pullback.
Set emotions aside first; the structure offers very specific information. The 1-hour EMA20 is at 0.05678611, currently showing strength; the 4-hour EMA20 is at 0.04976159, also currently showing strength. The shorter timeframe reveals changes, while the longer timeframe li
post-image
Accurate prediction; facts are always the best proof. $ETH Next, watch whether it will challenge the previous high and then pull back, or form a double bottom. Before a double bottom forms, however, note that if the attempt to challenge the previous high fails, a double top may form; alternatively, if the third upward push fails to exceed around 2550, a head-and-shoulders pattern may form. All of these patterns could lead to further price declines.
It appears that the first round of pullback has now been completed. A support level will subsequently form at the level retested this morning. The
ETH+1.59%
  • 1
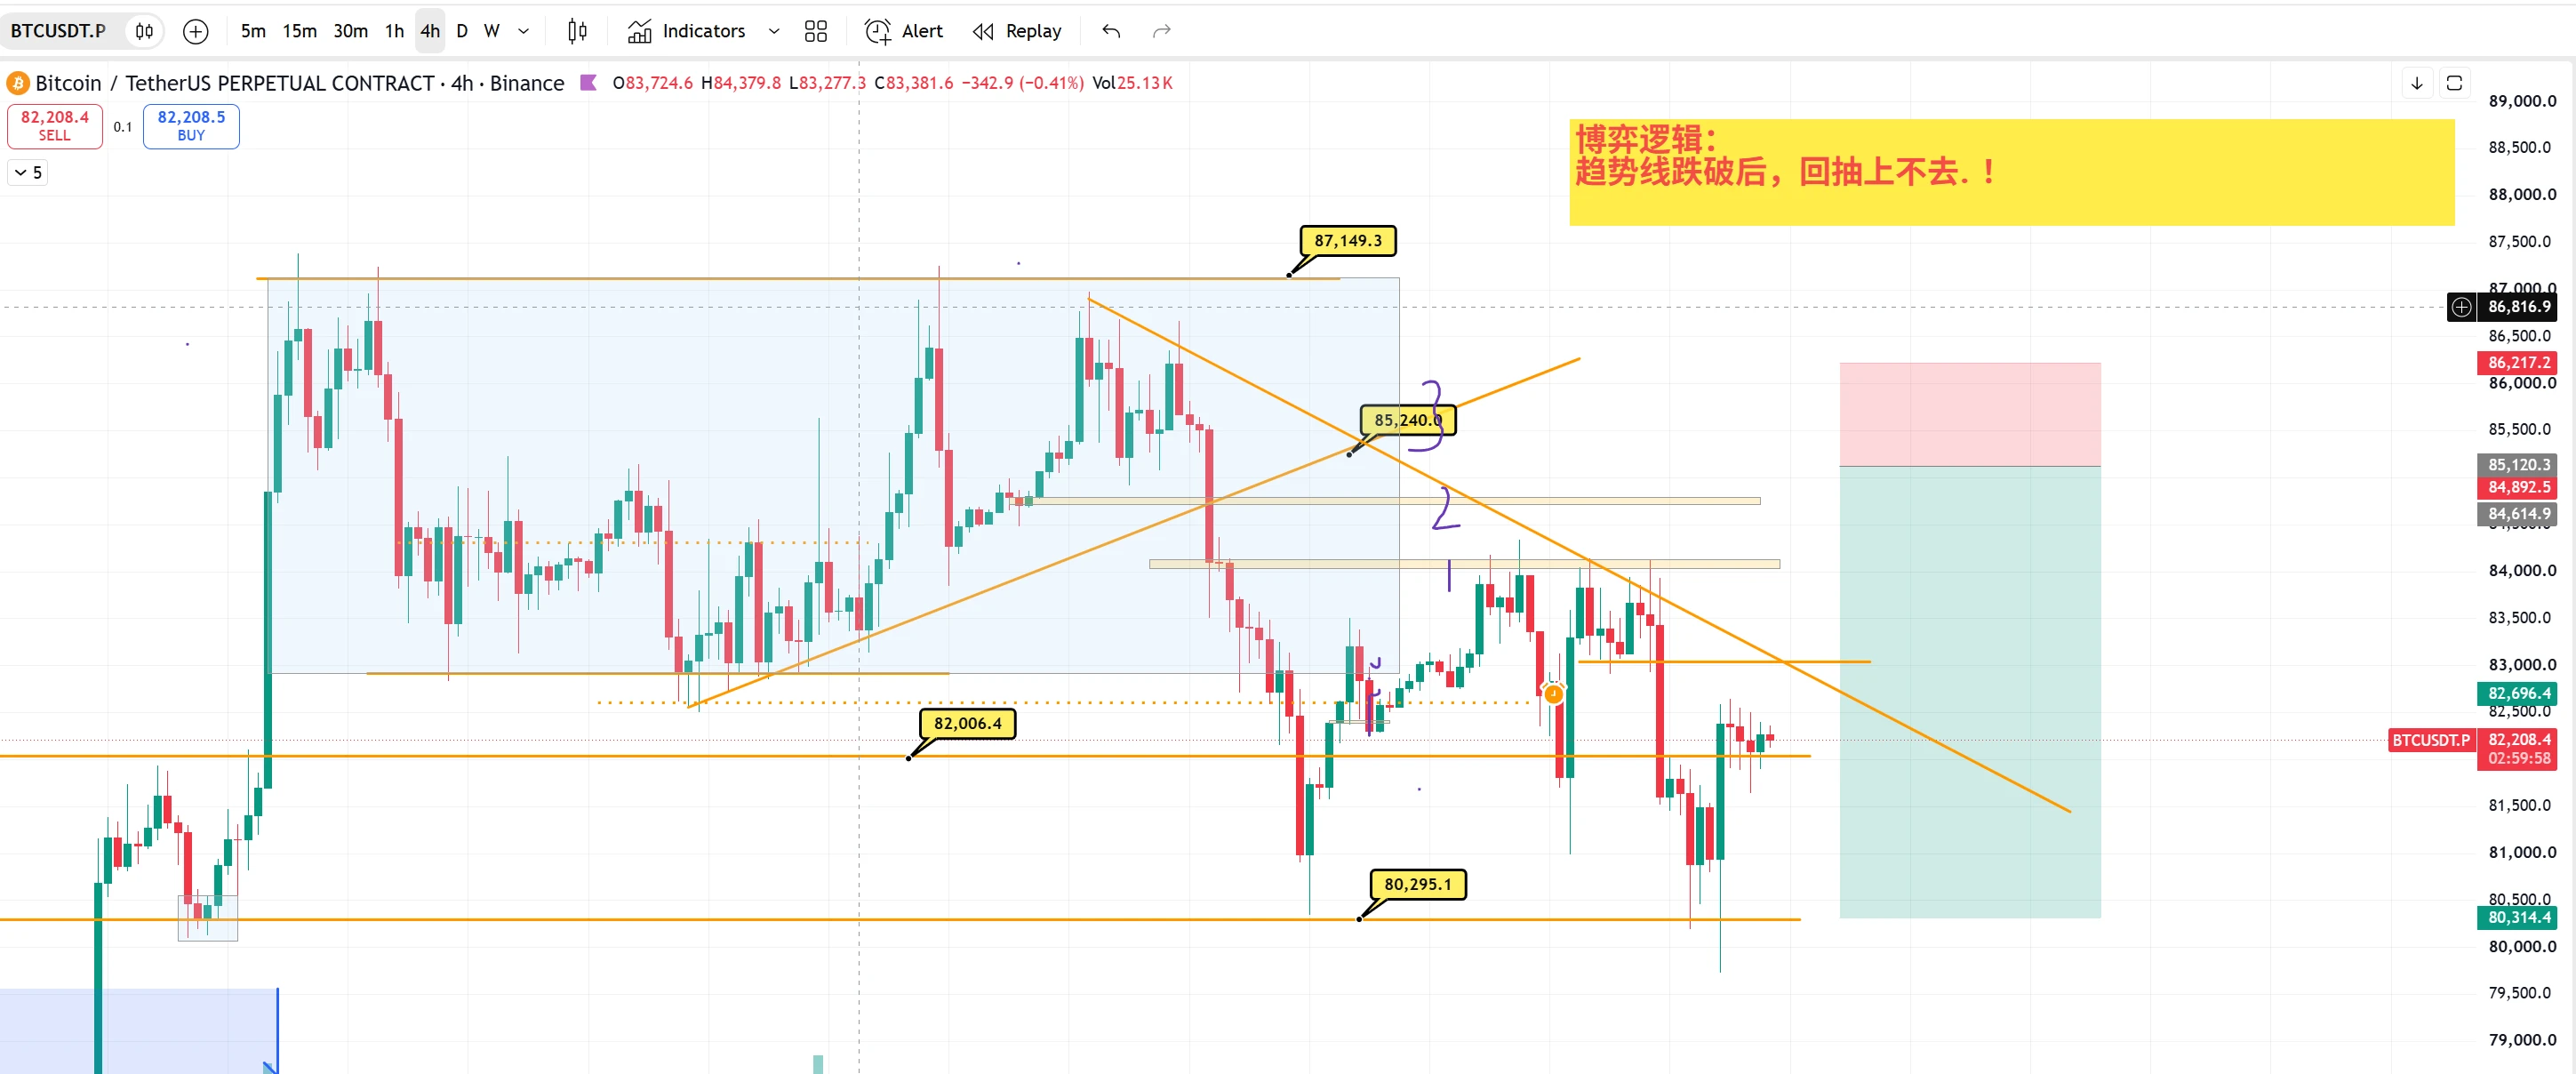
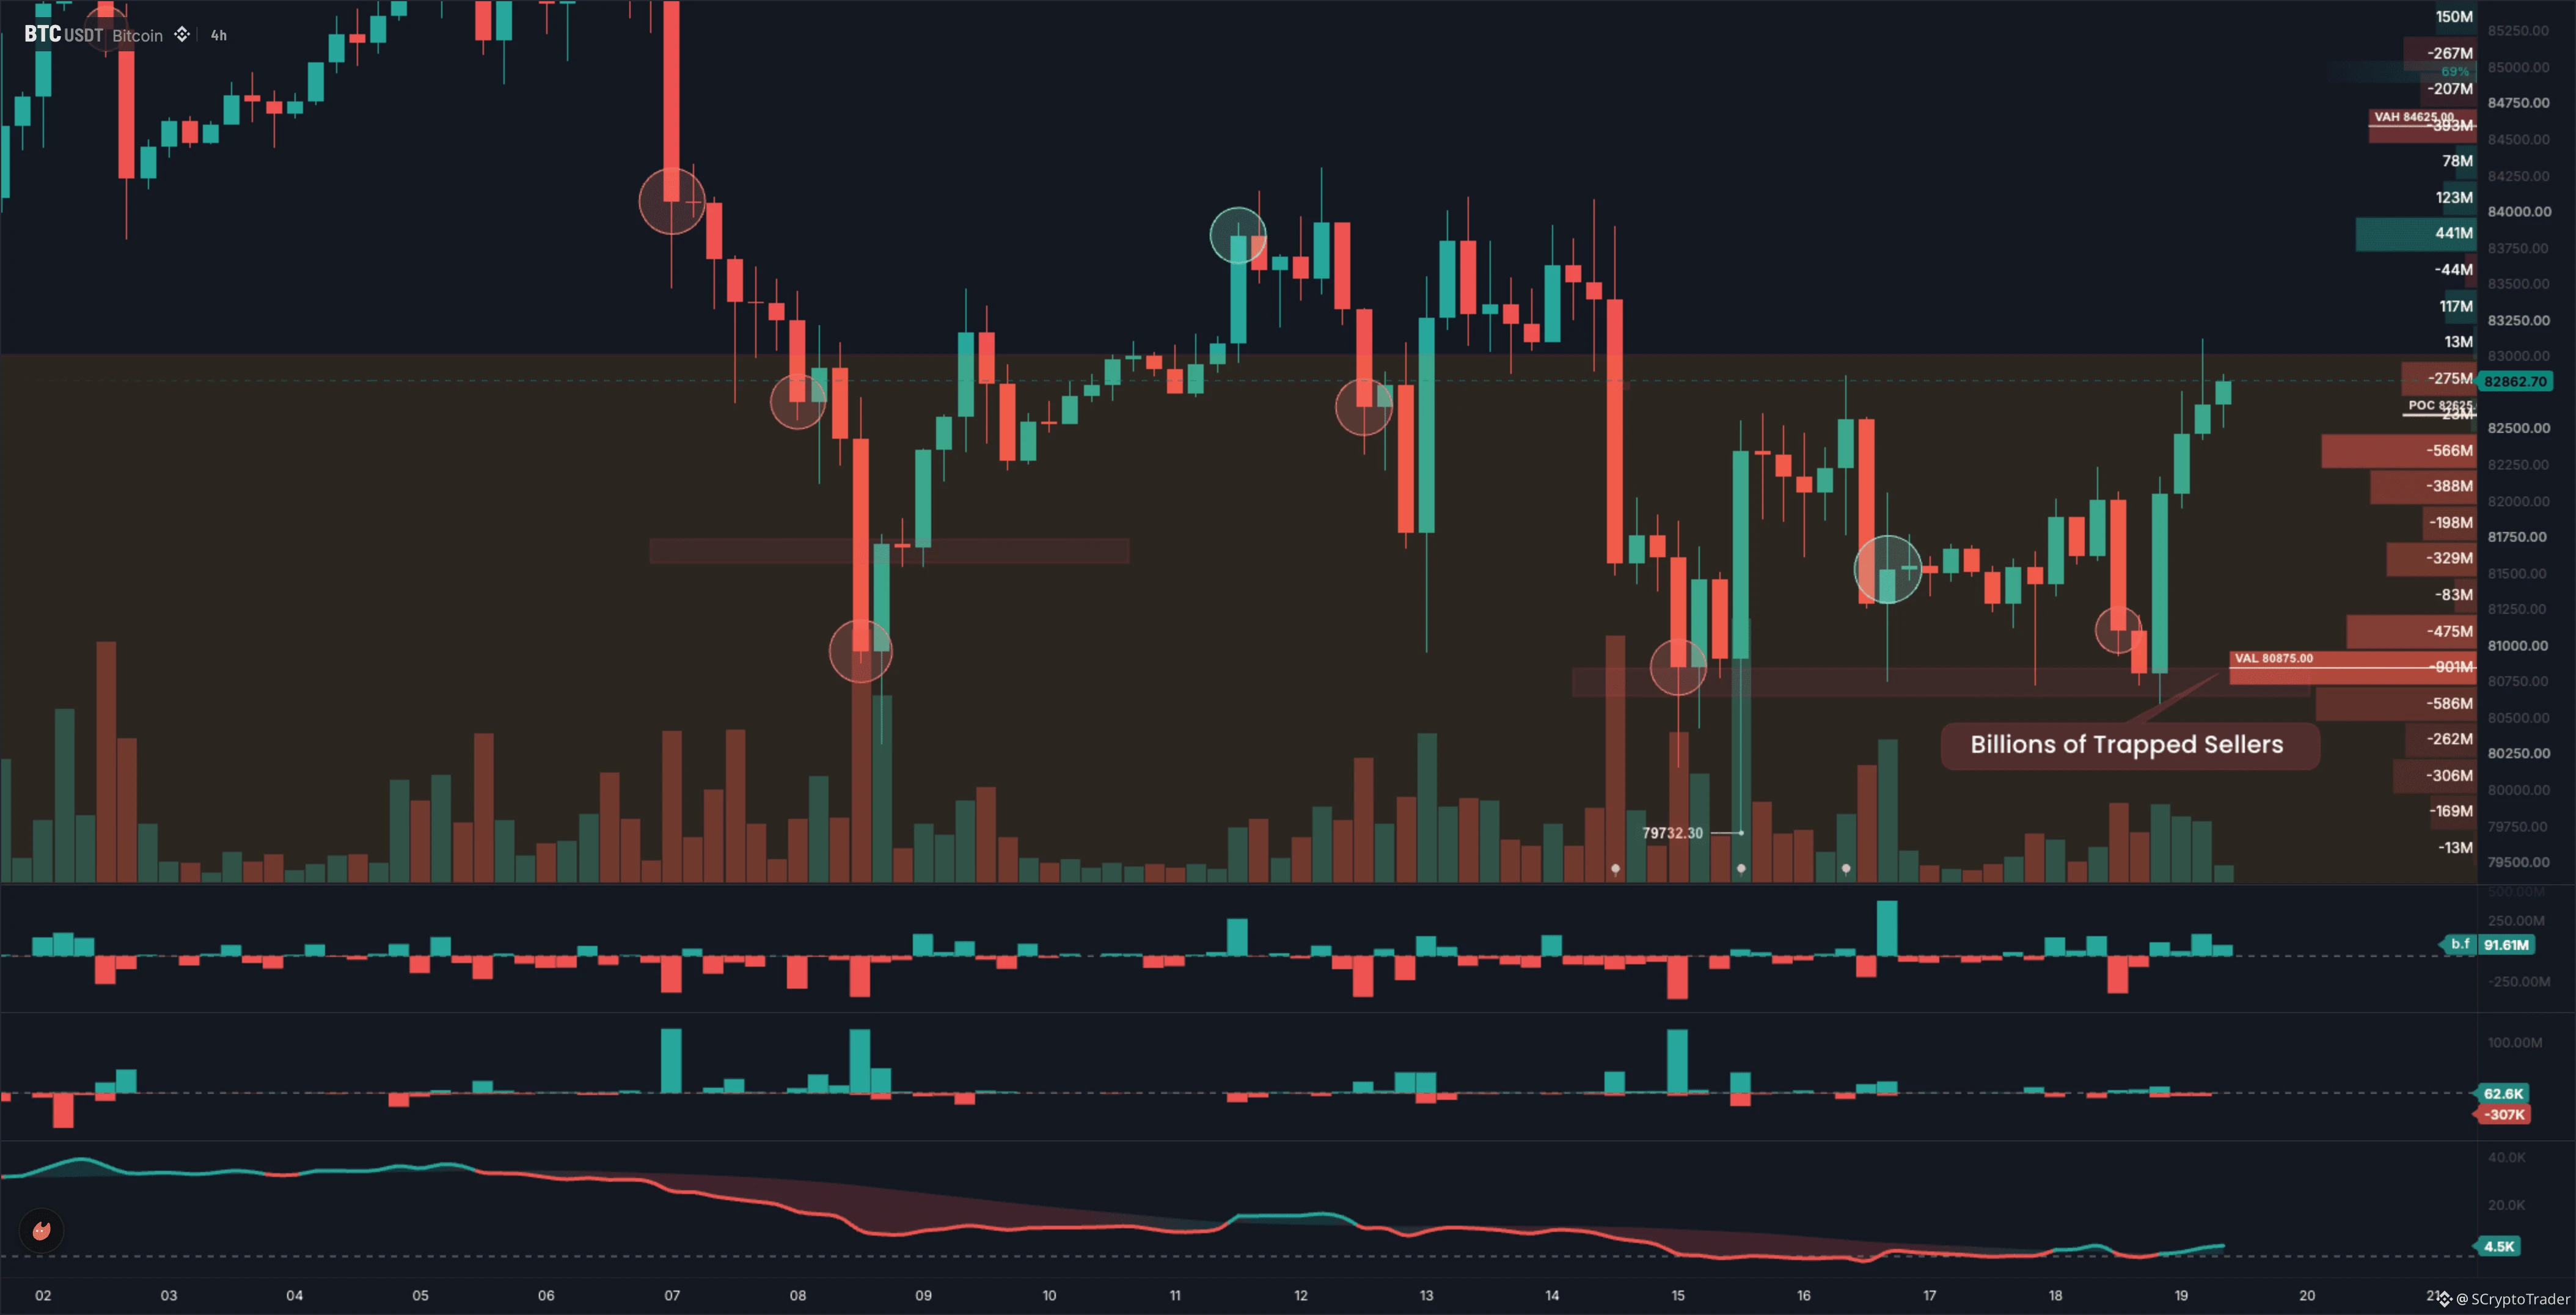
Starlink|BTC Yesterday’s Strategy Review
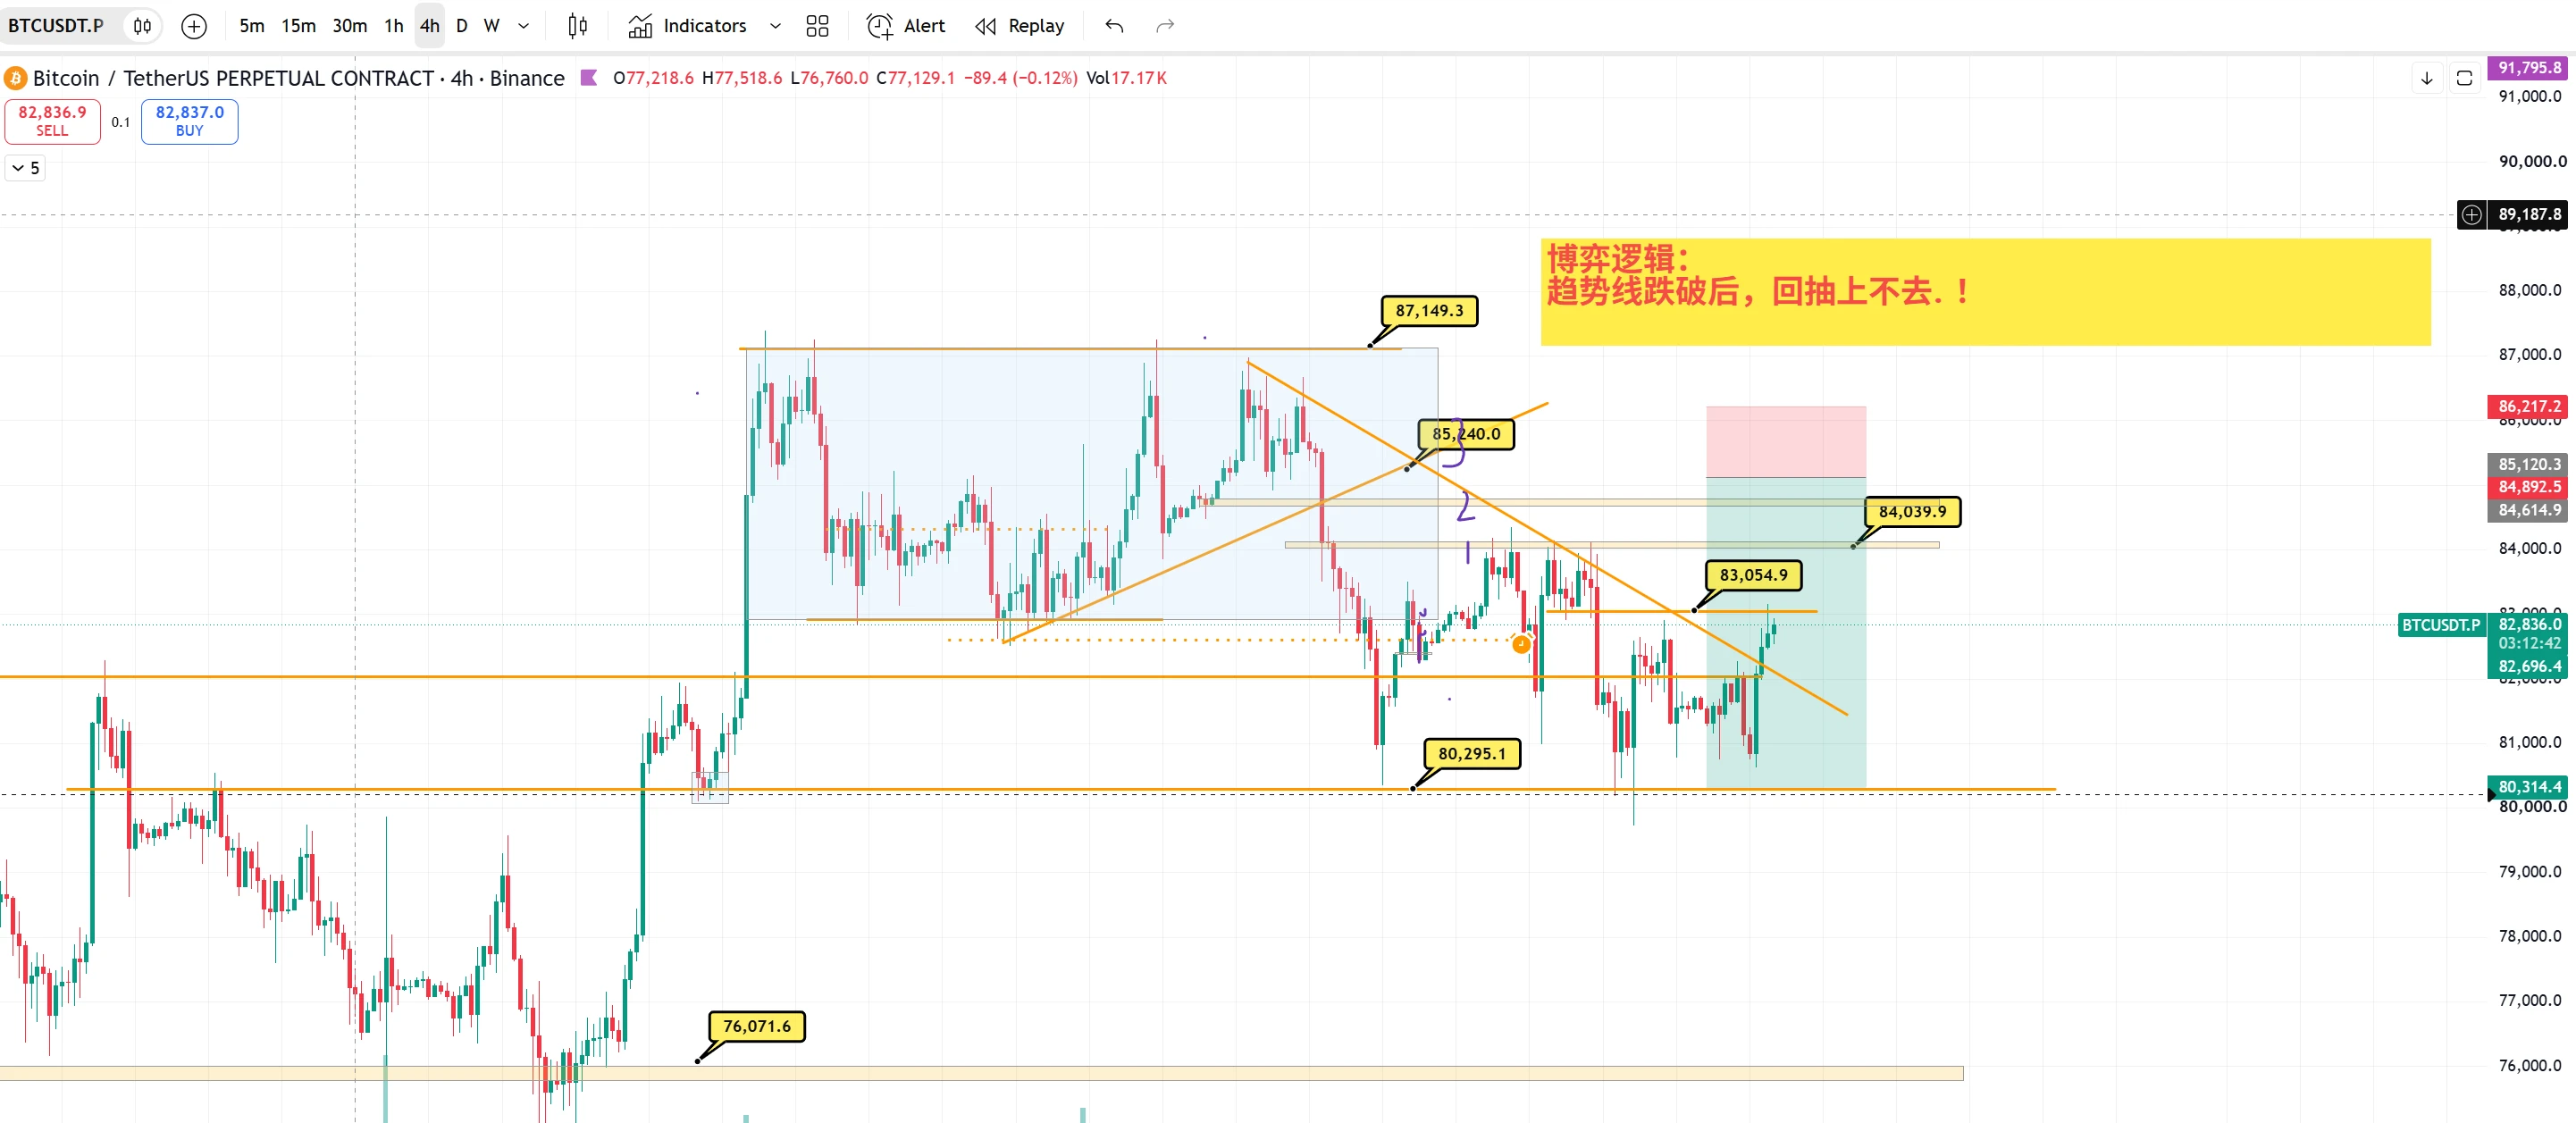
For this BTC recovery move, yesterday’s direction has received a direct answer from today’s market!
BTC fell all the way from 86664, hitting a low of 80344. When market sentiment was at its worst, many people were still worried that it might continue breaking down.
But after a sharp drop at the lows, you can’t focus only on the decline.
Yesterday’s strategy was: don’t chase shorts; wait for stabilization at the lows and look for a rebound recovery.
BTC subsequently rebounded all the way from around 80344, reclaiming 83000 and reaching a high near 84000!
post-image
BTC+1.15%
ETH+1.59%
🔹 XRP Ledger fixes a major vulnerability that existed nearly 11 years ago, which attackers could ex
live-cover
LIVE1,737
$LUMIA 24 hours +16.08%, but what is most worth debating now is not the gain or loss, but which one is misleading us—the 1-hour or the 4-hour chart. I would rather lay out the counterargument first.
The bears see the risk of breaking below 0.106, while the bulls need to prove that buyers will still step in after a breakout above 0.1833. Current volume is 0.09x.
The current price is 0.1213, about 12.61% above the 1-hour support at 0.106 and about 51.11% below the resistance at 0.1833. Position determines which side is more urgent; the next level to watch shifts to 0.0758.
It is more reliable to
post-image
LUMIA+17.73%
Load More

Join 40 M users in our growing community

⚡️ Join 40 M users in the crypto craze discussion

💬 Engage with your favorite top creators

👍 See what interests you

Trending Topics

GateAtTOKEN2049

41.6k Views21.89k Discussing

Gate brought a series of major events to TOKEN2049 Singapore! From the official launch of Gate Money to the F1 Red Bull driver meet-and-greet and the Gate Gala, we witnessed a new chapter of "One Gate, Borderless Finance." Which moment from TOKEN2049 stood out most to you?

LedgerLossesNear90Million

39.59k Views308 Discussing

GateWCTCS9GlobalTradingCompetition

34.71k Views5.19k Discussing

View More