
Share your thoughts
placeholder
Article
$FONE just broke trough few resistances with confirmation on lower time frames.
Had to close my long with huge loss sadly.
Structure and indicators are getting back to the state it was few days ago when it was constantly dropping.
Starting to short from 0.0109
#FONE
post-image
FONE+16.81%
$NOK
There is a ShortW type setup
post-image
NOK+2.86%
Most traders missed NEAR's 84% short signal because the 1D trend screamed bullish.

$NEAR /USDT - SHORT

Trade Plan:
Entry: 2.4312 – 2.4610
SL: 2.6323
TP1: 2.3065
TP2: 2.2134
TP3: 2.0737

Why this setup?
- The 4h timeframe is flipping bearish against the daily uptrend—this is the classic “bull trap” setup.
- RSI 15m at 55 shows weak momentum, not enough fuel to break 2.4610 resistance.
- Entry zone 2.4461 with TP1 at 2.3065 gives a 5.7% move before the daily trend reasserts.
- ATR 1h (0.0597) means volatility is compressed—breakouts are violent. Why now? Price is stalling under supply
NEAR+13.68%
$RAYSOL 24-hour gain of 44.9%, but the current price of 1.2625 has already retraced 12% from the high of 1.4422—you think it’s an entry opportunity, but I’m telling you this big bullish candle is most likely a bull trap before a long squeeze. Trading volume of 400 million looks lively, but the retreat after the price spike shows that someone was aggressively selling above 1.44. There is no financial news supporting it today; it’s purely a sentiment-driven move. This type of coin is the most dangerous—the pump relies entirely on momentum, and once that momentum breaks, the price will cascade.
T
$AVAX With A Strong Bounce Off The Bullish Restest Of The Blue Falling Wedge 🚀
post-image
AVAX+2.40%
牛来 & HNT Futures Trading Challenge
https://www.gate.com/share/act/fd00c752
post-image
牛来-20.56%
HNT-5.52%
  • 9
This trend doesn’t even require me to think—the account is dancing on its own. Before the market had fully started, $UNI held its key level, had moved sideways at the bottom for so long, and buying pressure was strengthening. I judged this move would most likely step up to the next level, so I went long directly. Entered at 5.766, now 7.113, +1658.77%. It was truly sluggish at first, but the breakout feels great; getting the rhythm right is just comfortable. Trading-wise: Take 80% off the table first—don’t get greedy for the last bite. Move the stop-loss on the remaining 20% to the entry price
post-image
UNI+0.29%
LAB-4.68%
XRP+0.36%
Everyone, are you satisfied with this yield and stability?
Privacy leader #ZEC pumped again 🥲 The good news is that it’s up 6x since we entered ✌️ The bad news is that the short grid entered at 10XX is at an unrealized loss 🥲 You really can’t short it even a little! Market maker, are you still pumping because you want to surpass Bitcoin? $ZEC
post-image
ZEC+22.69%
  • 1
$SOL Signal】Go long, trading around the 105.3 support
$SOL 4H RSI surged to 60.7, the 1H MACD histogram turned green at -0.17, and the price is stuck at 105.6. The 4H Bollinger Bands narrowed to 100.6-106.9, while the 1H bands are opening downward. The order book bid ratio is 1.05, with dense buy walls at 105.28-105.60 below; the negative funding rate of -0.0016% shows no signs of overcrowding. Bulls and bears are battling around 105.3, with a turning point approaching. Buying the dip offers a slightly better risk/reward ratio than chasing shorts.
🎯Direction: Long
⚡Entry/Limit Order: 105.283
post-image
SOL+2.14%
BTC+0.01%
ETH+0.67%
Everyone’s watching ARB’s range—but the 4h chart just whispered a secret that most retail is ignoring.

$ARB /USDT - SHORT

Trade Plan:
Entry: 0.18559 – 0.18925
SL: 0.20496
TP1: 0.17426
TP2: 0.16549
TP3: 0.15233

Why this setup?
Why now? The 1D trend is flat, yet the 4h structure is screaming SHORT with 55% confidence. RSI on 15m is at 59.58—not overheated, but stalling right under entry resistance (0.18742). ATR (0.00731) shows tight coils; break below 0.18559 opens the trapdoor to TP1 at 0.17426. This isn’t a reversal—it’s a range rejection play.

Debate:
If ARB taps 0.18925 first, do yo
ARB+10.24%
What can be the AMC top? I’m a bit conflicted.
post-image
AMC-1.11%
I did nothing—just went to the restroom, and when I came back, the candlestick chart had already done the work for me 💨 Before bed last night, I was still thinking about my position. The judgment at the time was simple: it was forming a base without breaking down, and someone would always buy the dip, so there was no need to scare myself. So I didn’t tinker with anything, set my stop-loss, and closed the app.

Then I opened the market this morning, and 2505.95 gave me a direct surprise. This move up from 2111.16 went even more smoothly than I expected. Calculated out, the +3252.19% gain is a
post-image
ZEC+22.69%
SOL+2.14%
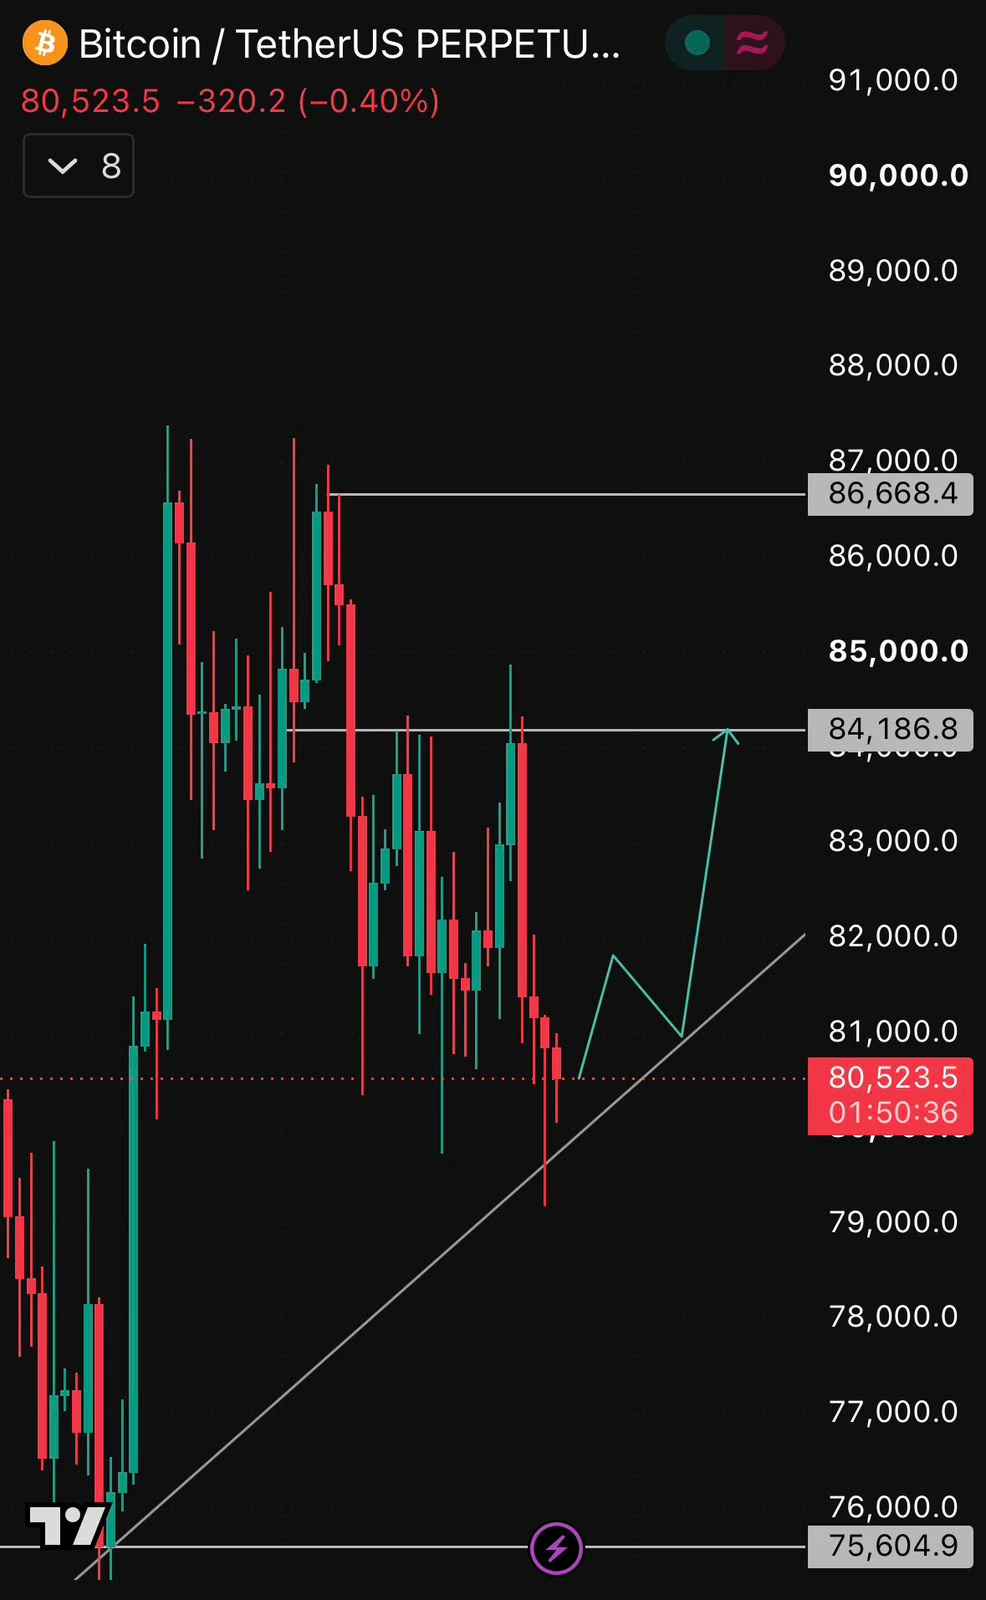
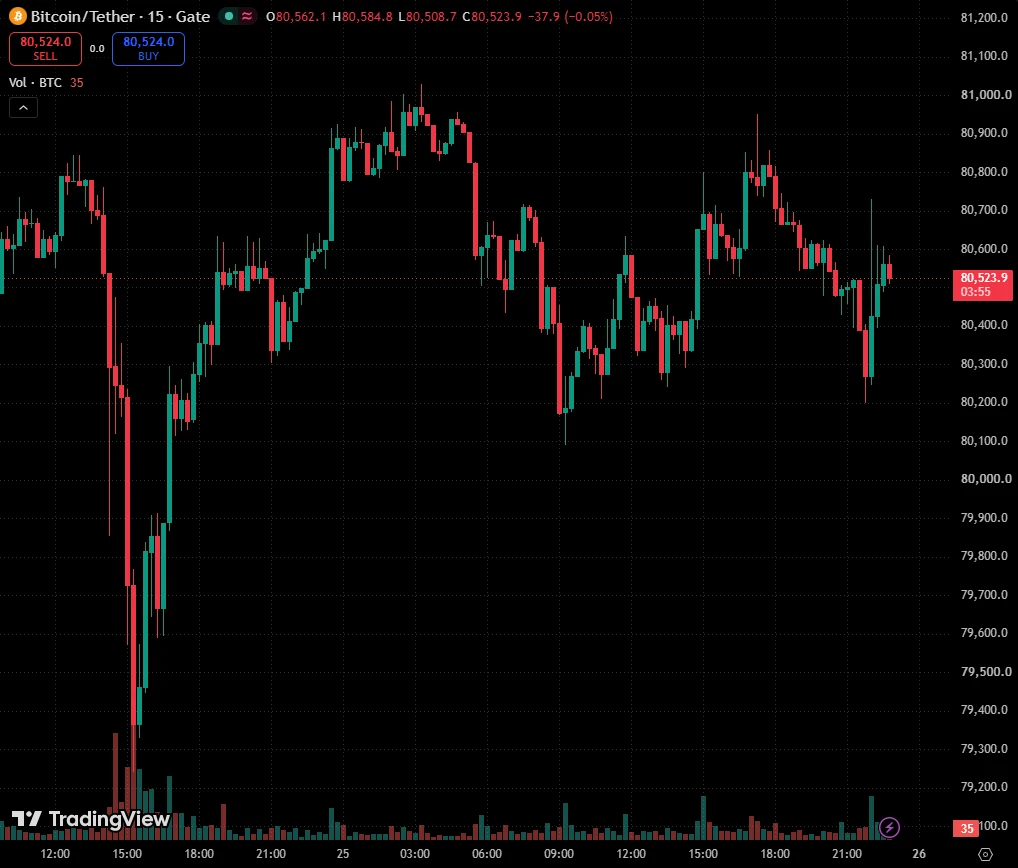
#Gate事件合约晒单挑战 Bitcoin four-hour price movement forecast, personal opinion, betting bullish, with the following analysis:
BTC traded sideways within the 79.55k–80.20k range over the past 24 hours, with buying support emerging each time it retested the 79.5k area, indicating solid short-term support.
Four-hour technical signals are bullish: SAR is below the price, bullish momentum is stronger than bearish momentum, and RSI at 56 is neutral to slightly strong, with no signs of overbought conditions. In terms of fund flows, the low futures funding rate suggests that long positions are not overcro
post-image
BTC+0.01%
ETH+0.67%
The market humbles everyone eventually, but this time it has been pretty gentle with me.
When it plunged intraday, 1.117 looked like it was about to collapse, but it ultimately couldn’t push any lower. Volume dried up completely—those who were going to run had already done so, leaving only the ones who didn’t want to move.
When I checked the chart after lunch, the price had already started quietly climbing back. I had just one thought at the time: at this level, set a stop-loss and take a shot at a rebound.
Now at 4.532, with a +14729.64% return, the guys on board should be waking up laughing,
post-image
SNDK+1.18%
XRP+0.36%
Important Reminder❗
The US stock market will be closed on Monday for the Labor Day holiday.
Here is a brief overview of the practical impact on the market:
1. With the US stock market closed, there will be no movement in US market trading on Monday night, macro news flow will be relatively light, and liquidity will decline significantly.
2. Although gold and crude oil will not be closed for the entire day, they will close early. Liquidity will shrink late at night, increasing the likelihood of slippage and sudden price spikes. Try not to leave large positions open until late at night.
3. Some
post-image
CL+0.14%
XAU-0.24%
VODForge is a free Mac and Windows app that turns YouTube links and playlists into local MP4 or MP3 with a real queue.
Paste a URL, pick quality up to 4K, and compare source vs output side by side. No account. Open source.
post-image
[New Streamer] Market Prediction
live-cover
LIVE38
$FLOCK Signal】1H pullback support + negative funding rate short squeeze, long setup
$FLOCK After spiking to 0.08205 on the 1H chart, the price fell sharply to the current 0.07301 and has briefly stabilized above 0.0728. RSI has fallen to 59.68 on the 1H chart, while the 4H chart remains elevated at 69.09. The 1H MACD has formed a death cross, with the histogram at -0.0001, indicating weak downward momentum. Order-book depth imbalance is 8.64%, with dense bids below 0.0728. The funding rate is -0.0168%, with shorts paying to hold positions; OI is stable.
🎯 Direction: Long
⚡ Entry/limit order
post-image
FLOCK+21.39%
Beginner Trader - Real Account Live
live-cover
LIVE51
Load More

Join 40 M users in our growing community

⚡️ Join 40 M users in the crypto craze discussion

💬 Engage with your favorite top creators

👍 See what interests you

View More