Square
Following
Hot
News
Profile
Share your thoughts
placeholder
Article
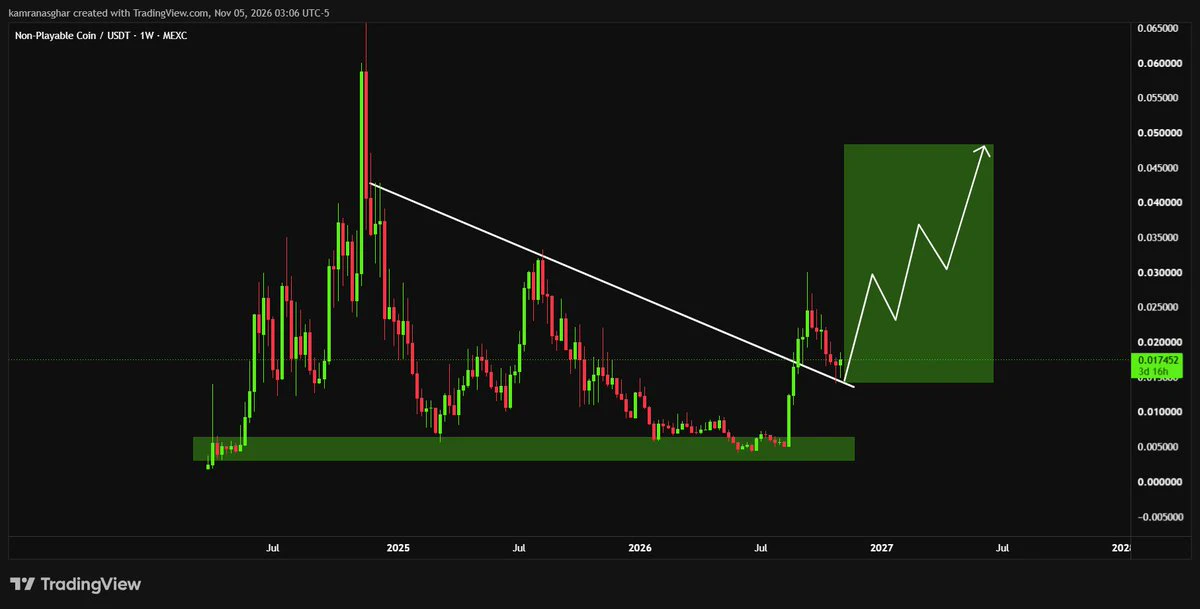
ethereum:0x8ed97a637a790be1feff5e888d43629dc05408f6 bouncing sharply off broken trendline support.
Bullish continuation active as price aims for a major run to $0.0480.
post-image
ETH-1.26%
BTC at a critical turning point! What Happens If BTC Breaks Above $82,000?
live-cover
LIVE1,962
Trenches
ZIG
Z
bade
b
ZIG
0x8c...1145
Market Cap
$.
Change
.
24h Vol
$.
Holders
.
BTC
B
bade
b
BTC
C5xp...pump
Market Cap
$.
Change
.
24h Vol
$.
Holders
.
HIGH
H
bade
b
HIGH
7ymF...high
Market Cap
$.
Change
.
24h Vol
$.
Holders
.
STONK
S
bade
b
STONK
6GmA...UNgx
Market Cap
$.
Change
.
24h Vol
$.
Holders
.
CORLA
C
bade
b
CORLA
0xba...7777
Market Cap
$.
Change
.
24h Vol
$.
Holders
.
This is gold's weekly chart.
We can see that gold has experienced drops close to 50% before.
If the exact same price action repeats, then from 4600 we definitely have to make it to the 3100 range! $XAUUSD
XAUUSD+1.58%
Many media outlets are like this nowadays, making things up and stirring up controversy
post-image
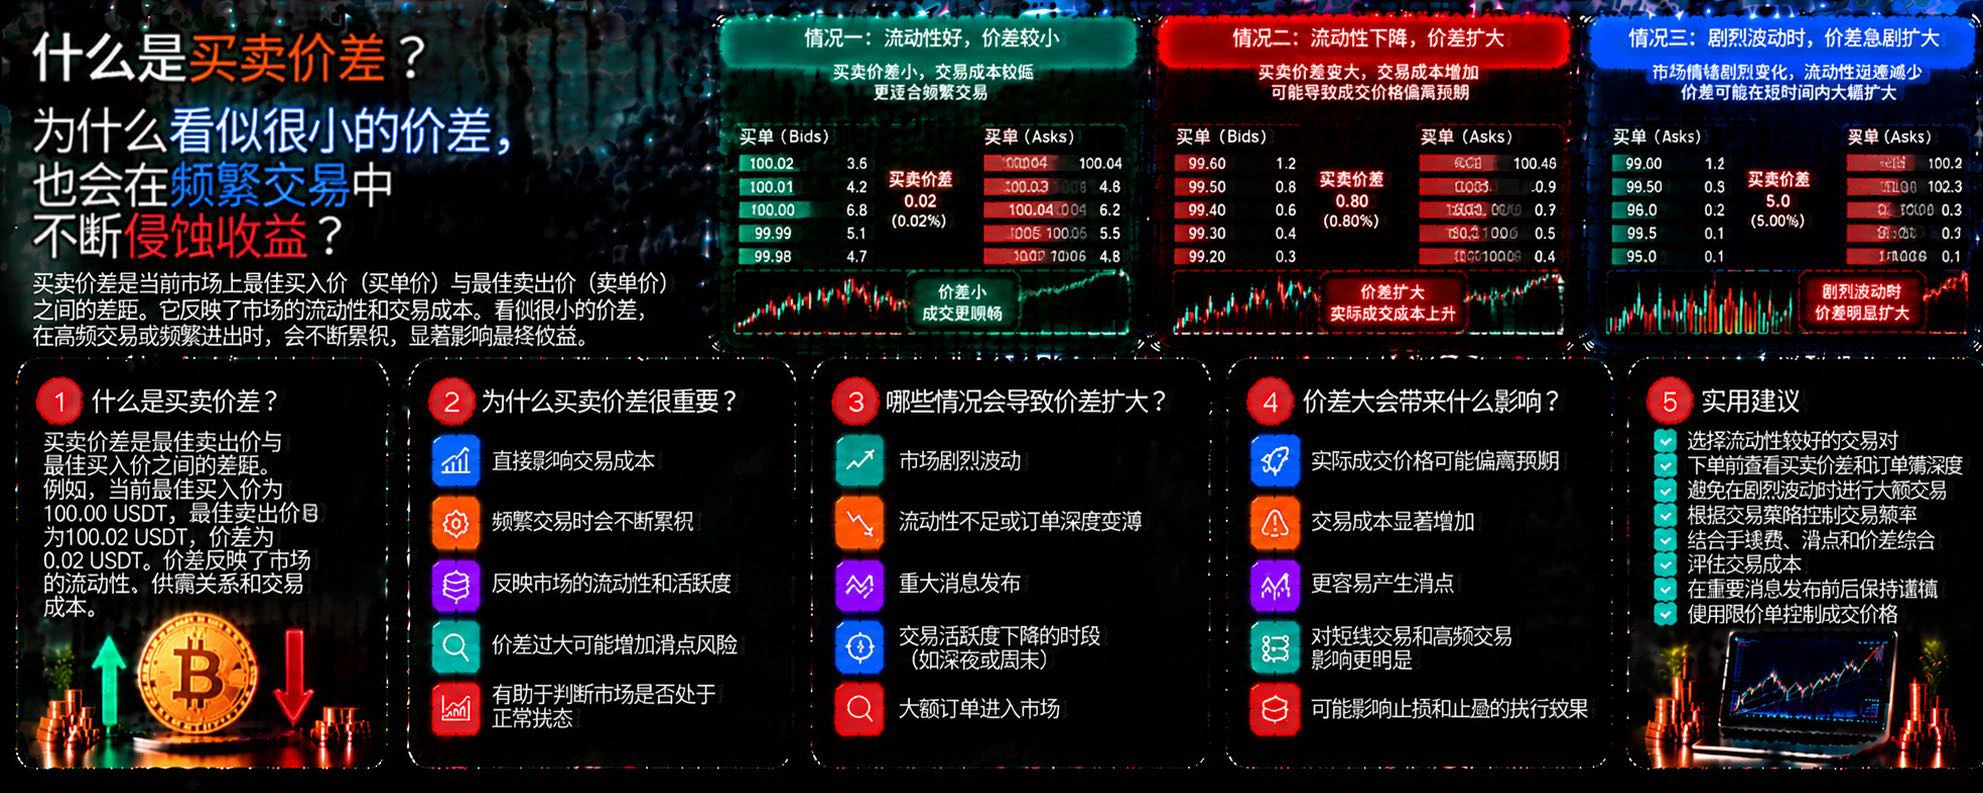
What is the bid-ask spread? Why can even a seemingly small spread continually erode returns through frequent trading?
In cryptocurrency trading, many people focus only on price movements and overlook the spread between buying and selling. Even when market prices barely change, frequent trading can rack up costs from spreads and fees, ultimately reducing actual returns.
First, what is the bid-ask spread?
The bid-ask spread is the difference between the best ask price and the best bid price in the market. For example, if an asset’s best bid is 100 USDT and its best ask is 100.10 USDT, the spread
post-image
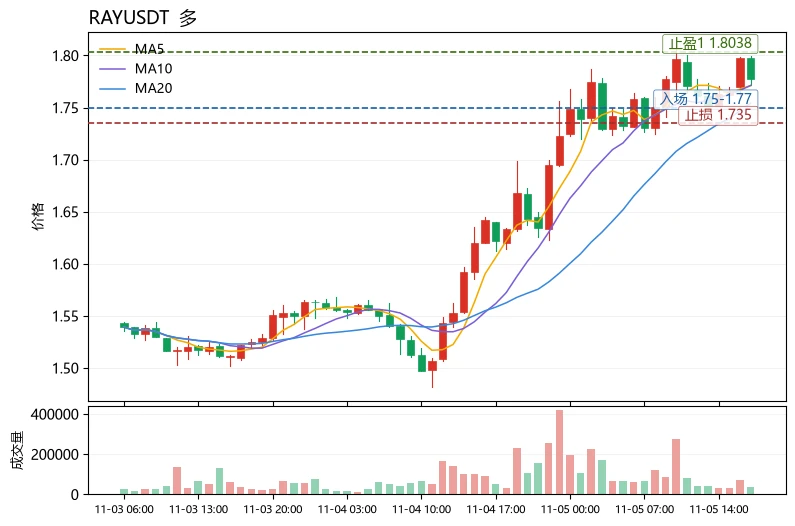
Many people see a funding rate of 0 and assume that neither longs nor shorts are taking a side. In fact, a zero rate means the perpetual price is tracking spot, with both sides waiting for the other to move first. $RAY is in exactly this state now.
The current price is 1.7771, up 9.70% in 24 hours, but the funding rate is +0.0000%, indicating that this rally is not being driven by leveraged longs in futures. FOMO buying isn't extreme, which leaves room for further upside. On the moving average front, MA5=1.77104 is above MA20=1.75418, with the short-term average supporting the price; RSI=61.2
post-image
BEB
BEBBe En Be
Pump.Fun
MC:$61.33Holders:1
2.75%
RAY-0.66%
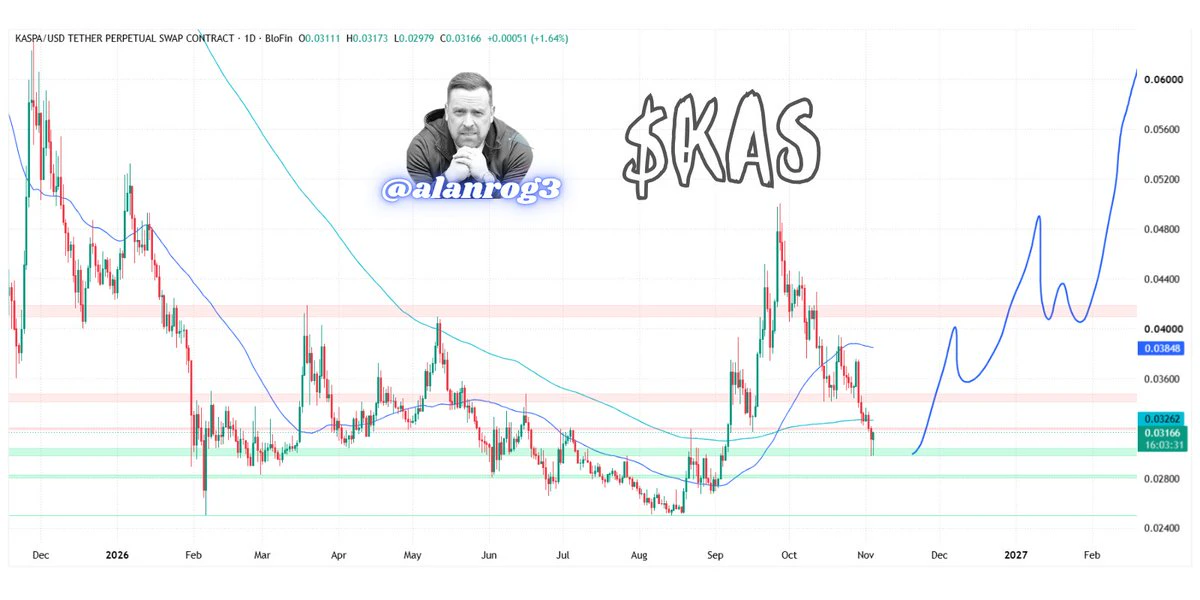
$KAS pulled back to the zone it bounced from before. I think this is a nice spot.
post-image
KAS+0.33%
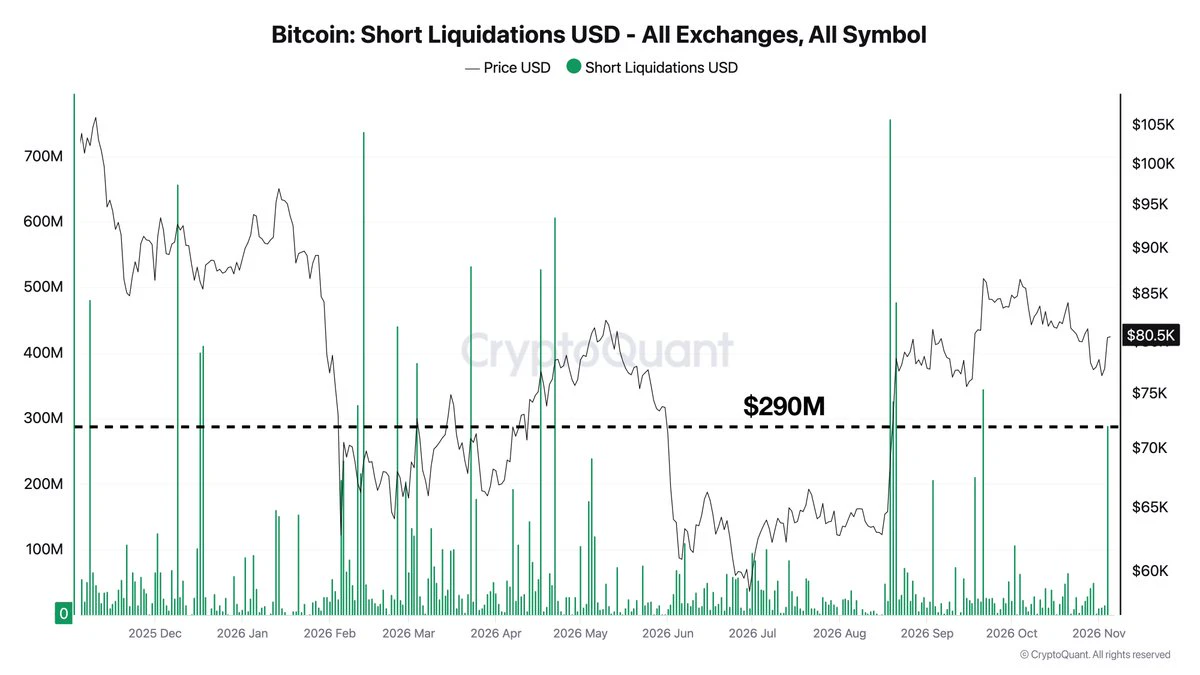
Nearly $290 million in Bitcoin shorts were liquidated in a single day - the most since September 21. Funding has remained positive since May.
Will there be enough fresh buying to sustain the rally after the shorts are closed?
I break it down in Morning Brief #294
post-image
BTC-0.65%
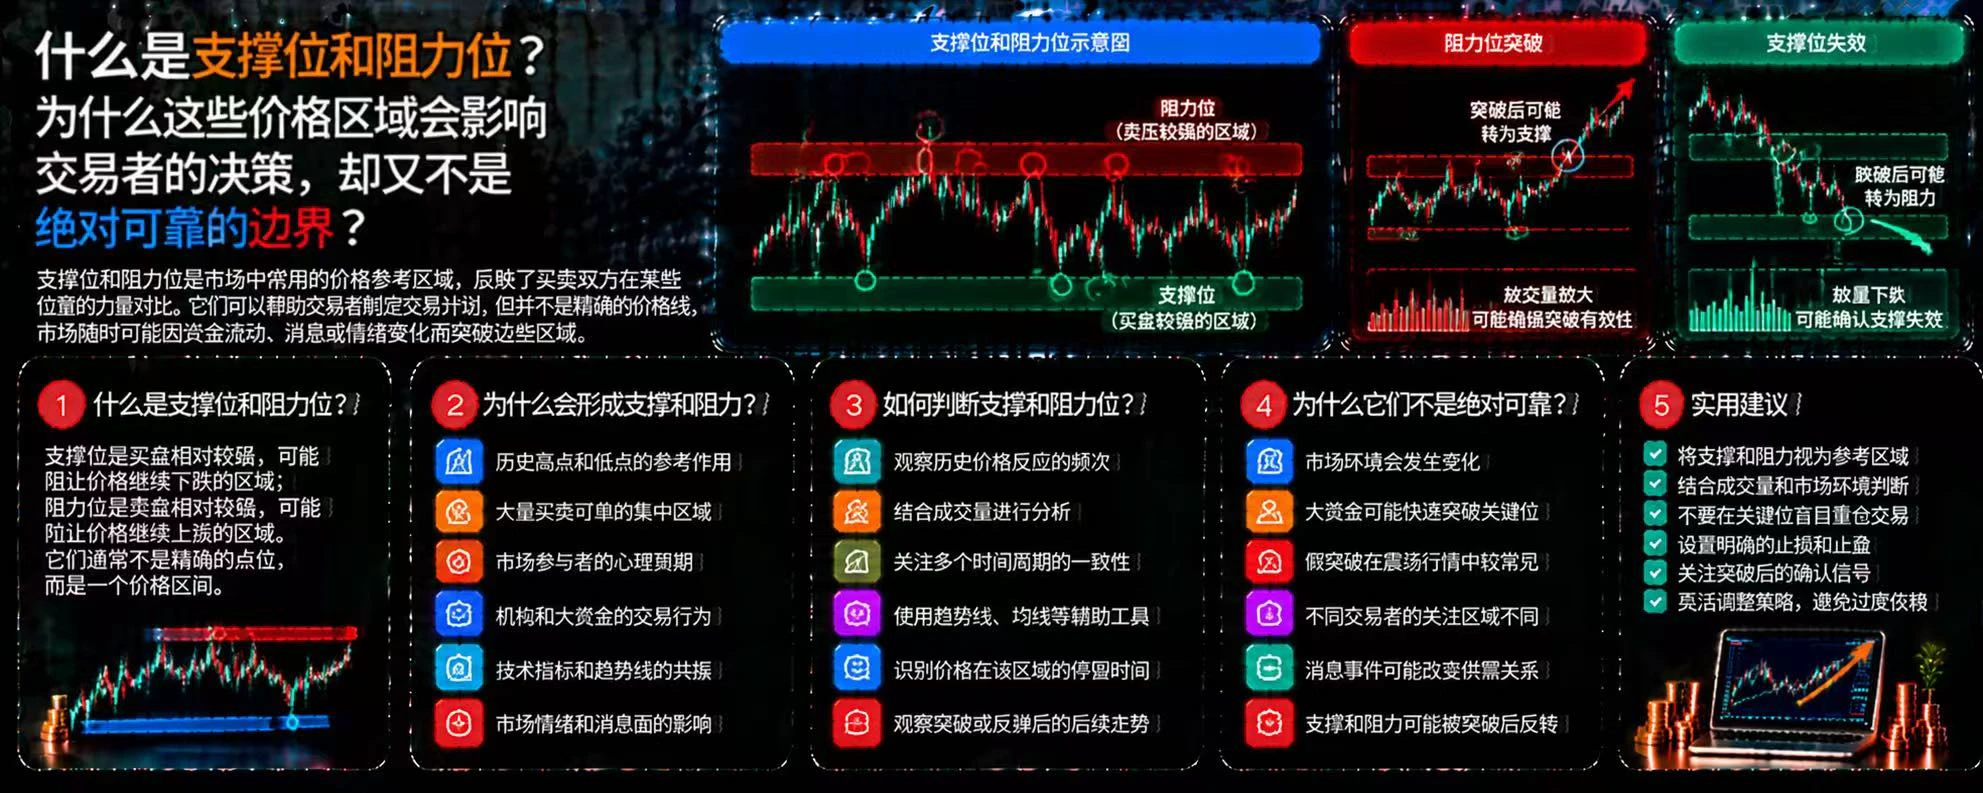
What are support and resistance levels? Why do these price zones influence traders’ decisions, yet are not absolutely reliable boundaries?
In crypto trading, prices often bounce or pull back repeatedly in certain areas. Traders usually call these areas support and resistance levels. They can help analyze market structure, but they do not guarantee that prices will bounce or reverse.
First, what are support and resistance levels?
A support level is an area where buying pressure may increase and a price decline may temporarily slow; a resistance level is an area where selling pressure may increa
post-image
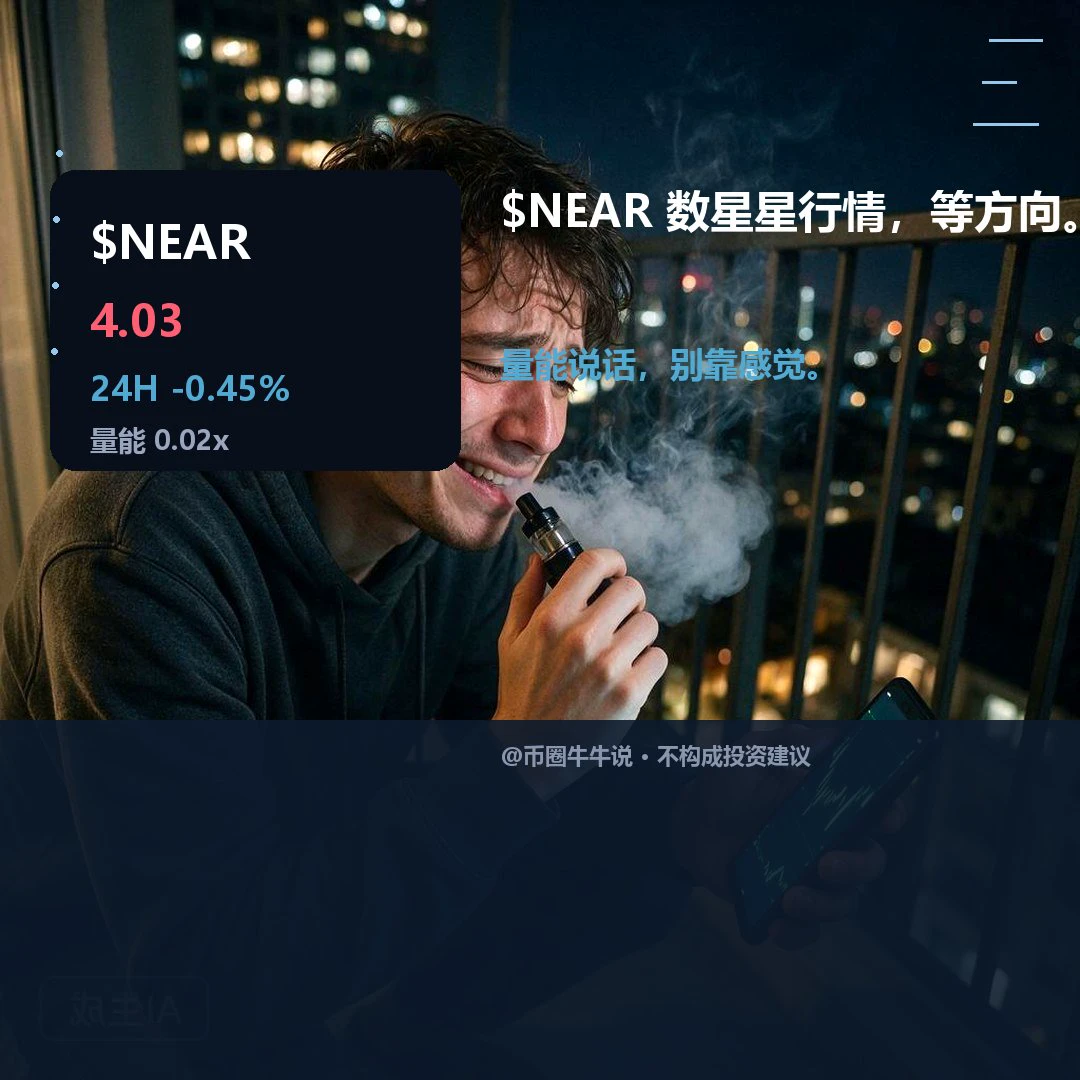
$NEAR Currently at 4.026, 24H -0.45% (3.965–4.273). 1H is relatively strong: RSI 55.81, with the current price above the 1H EMA20 at 4.0248; 4H is relatively weak: RSI 61.08, with the current price below the 4H EMA20 at 4.0271. The 1H volume ratio is 0.016, indicating very low participation. If the price holds above the 4.273 resistance level, watch for continuation; if it breaks below the 3.965 support level, it may weaken in the short term. In the next review, check whether 4.273 holds and whether the price can recover after losing 3.965. The two timeframes remain divergent, and short-term c
post-image
You wanna catch this move on $INJ .
Monthly chart.
Everything else is peanuts 🥜
That's why I say hourly charts in this time of the cycle is for kids.
And not only that you will catch the biggest move. You will also lower your stress for 90%.
Listen to your old LT 💚
INJ-1.67%
Got a gift from my wife: a Logitech K98M Plus, my second keyboard this year.
The catch is, I paid off another 10k on her credit card.
So does that mean I bought it or she did?😂
  • 6
  • 2
[New Streamer] Market Prediction
live-cover
LIVE1,848
#BTC重返8万
Fully automated quantitative trading, a little slower but steady.
BTC-0.67%
#OctoberNonfarmPayrollsInFocus
Private labor gauge gives upbeat cue before big payrolls.
ADP said on Nov 4 that US private employers added 86,000 jobs in October. That print matched September's revised 86,000 and topped Wall Street look for 69,000 to 75,000. One survey had 67K expected vs 90K prior. ADP data comes from anonymized payroll of about 25 million workers, produced with Stanford Digital Economy Lab. Private sector gain was led by services, while goods hiring stayed soft, a mix that points to low hire, low fire labor.
Focus now shifts to Bureau of Labor Statistics Employment Situatio
ADP+2.57%
XAU+0.38%
BTC-0.67%
  • 5
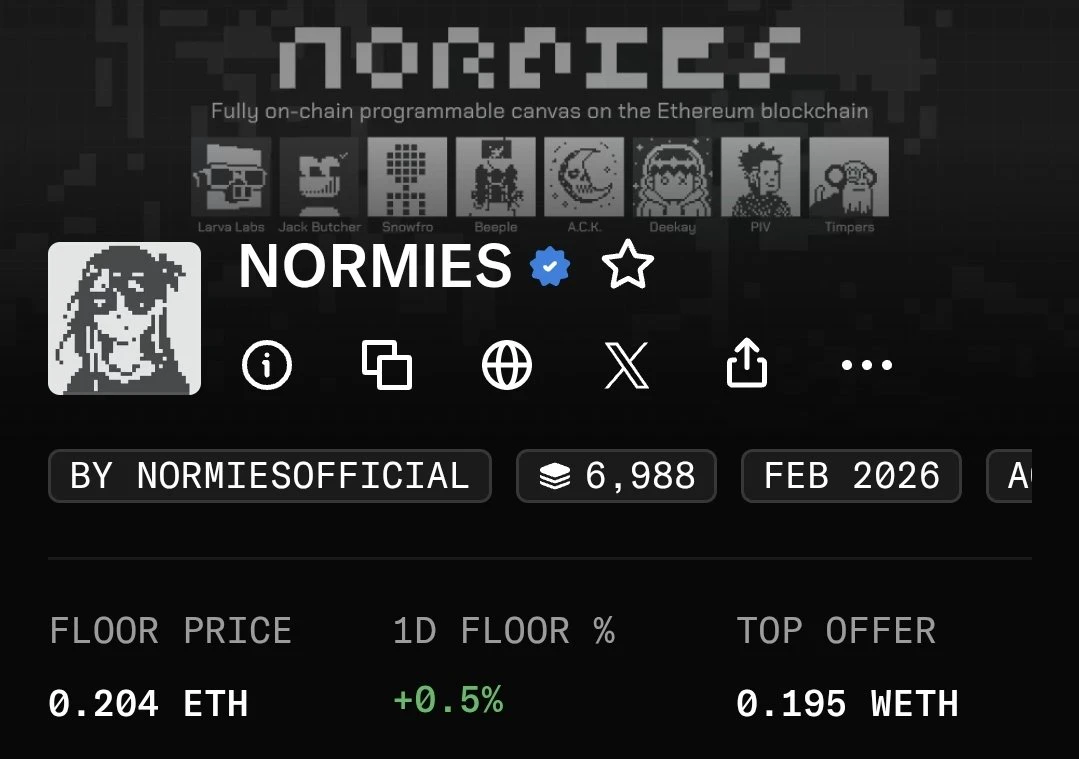
THIS is the most undervalued collection of them all.
Yet, I still don't own one.
Tell me I'm dumb in the comments 👇
post-image
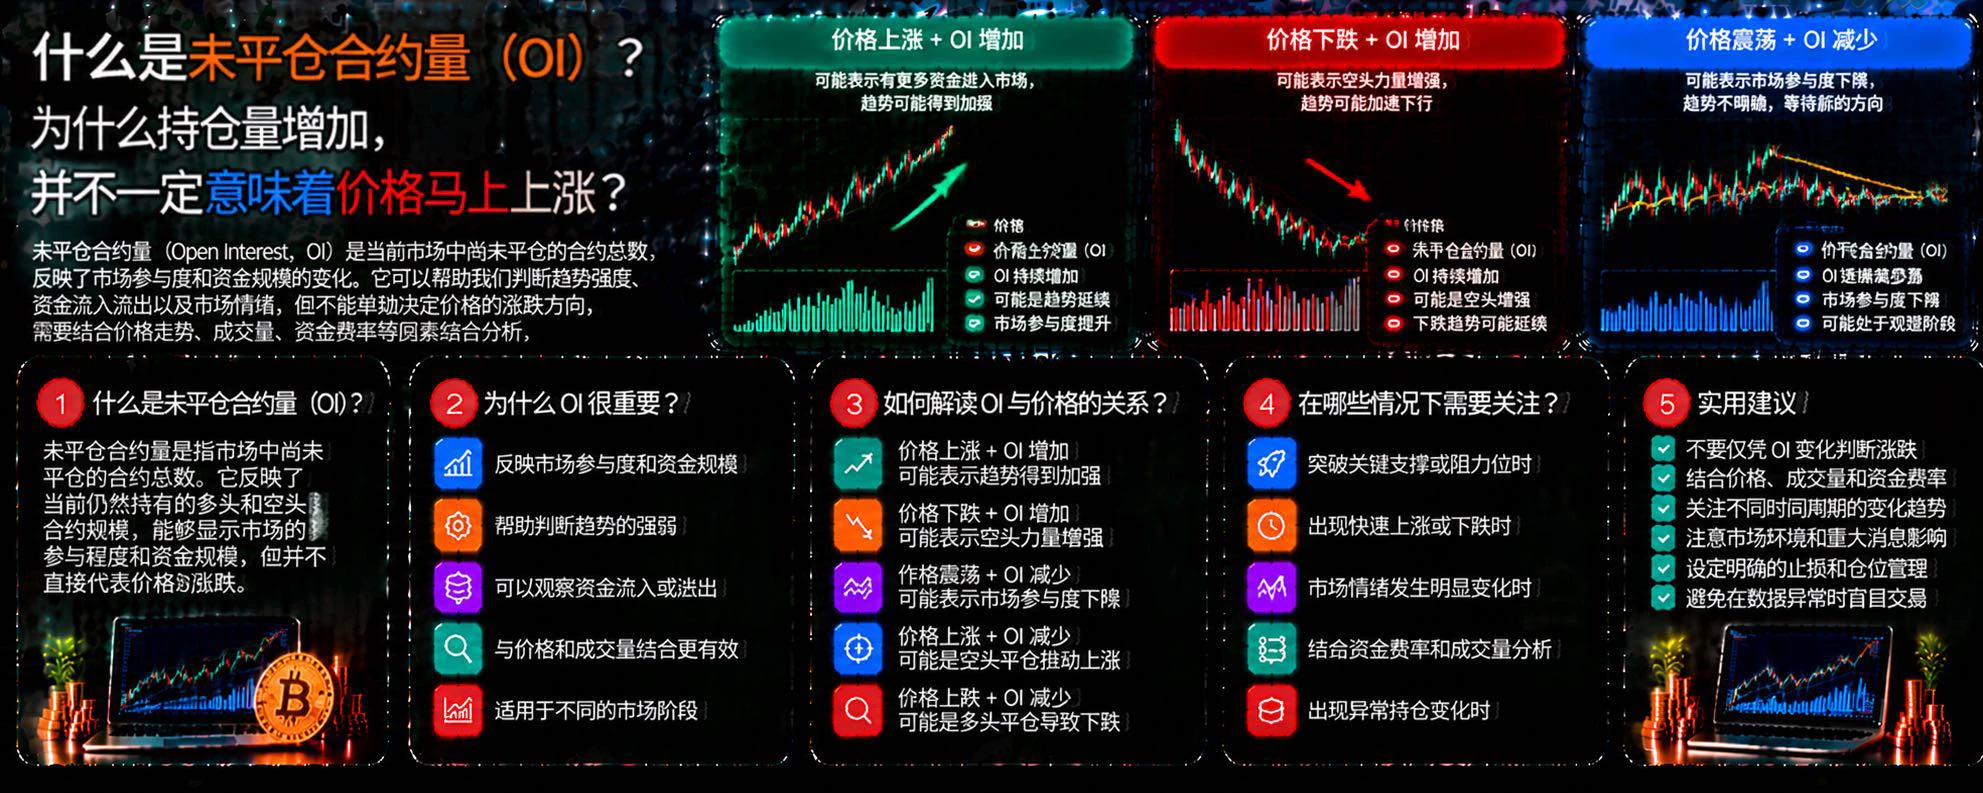
What Is Open Interest (OI)? Why Doesn’t an Increase in Open Interest Necessarily Mean Prices Will Rise Soon?
In crypto derivatives trading, many people see open interest continuing to increase and assume the market is about to rise. But open interest reflects the size of contracts that have not yet been closed, not simply the amount of buying capital. To correctly understand market movements, OI must be analyzed alongside price, trading volume, and funding rates.
First, what is OI?
Open Interest (OI) refers to the total number of contracts that remain open at a given point in time. OI may incr
post-image
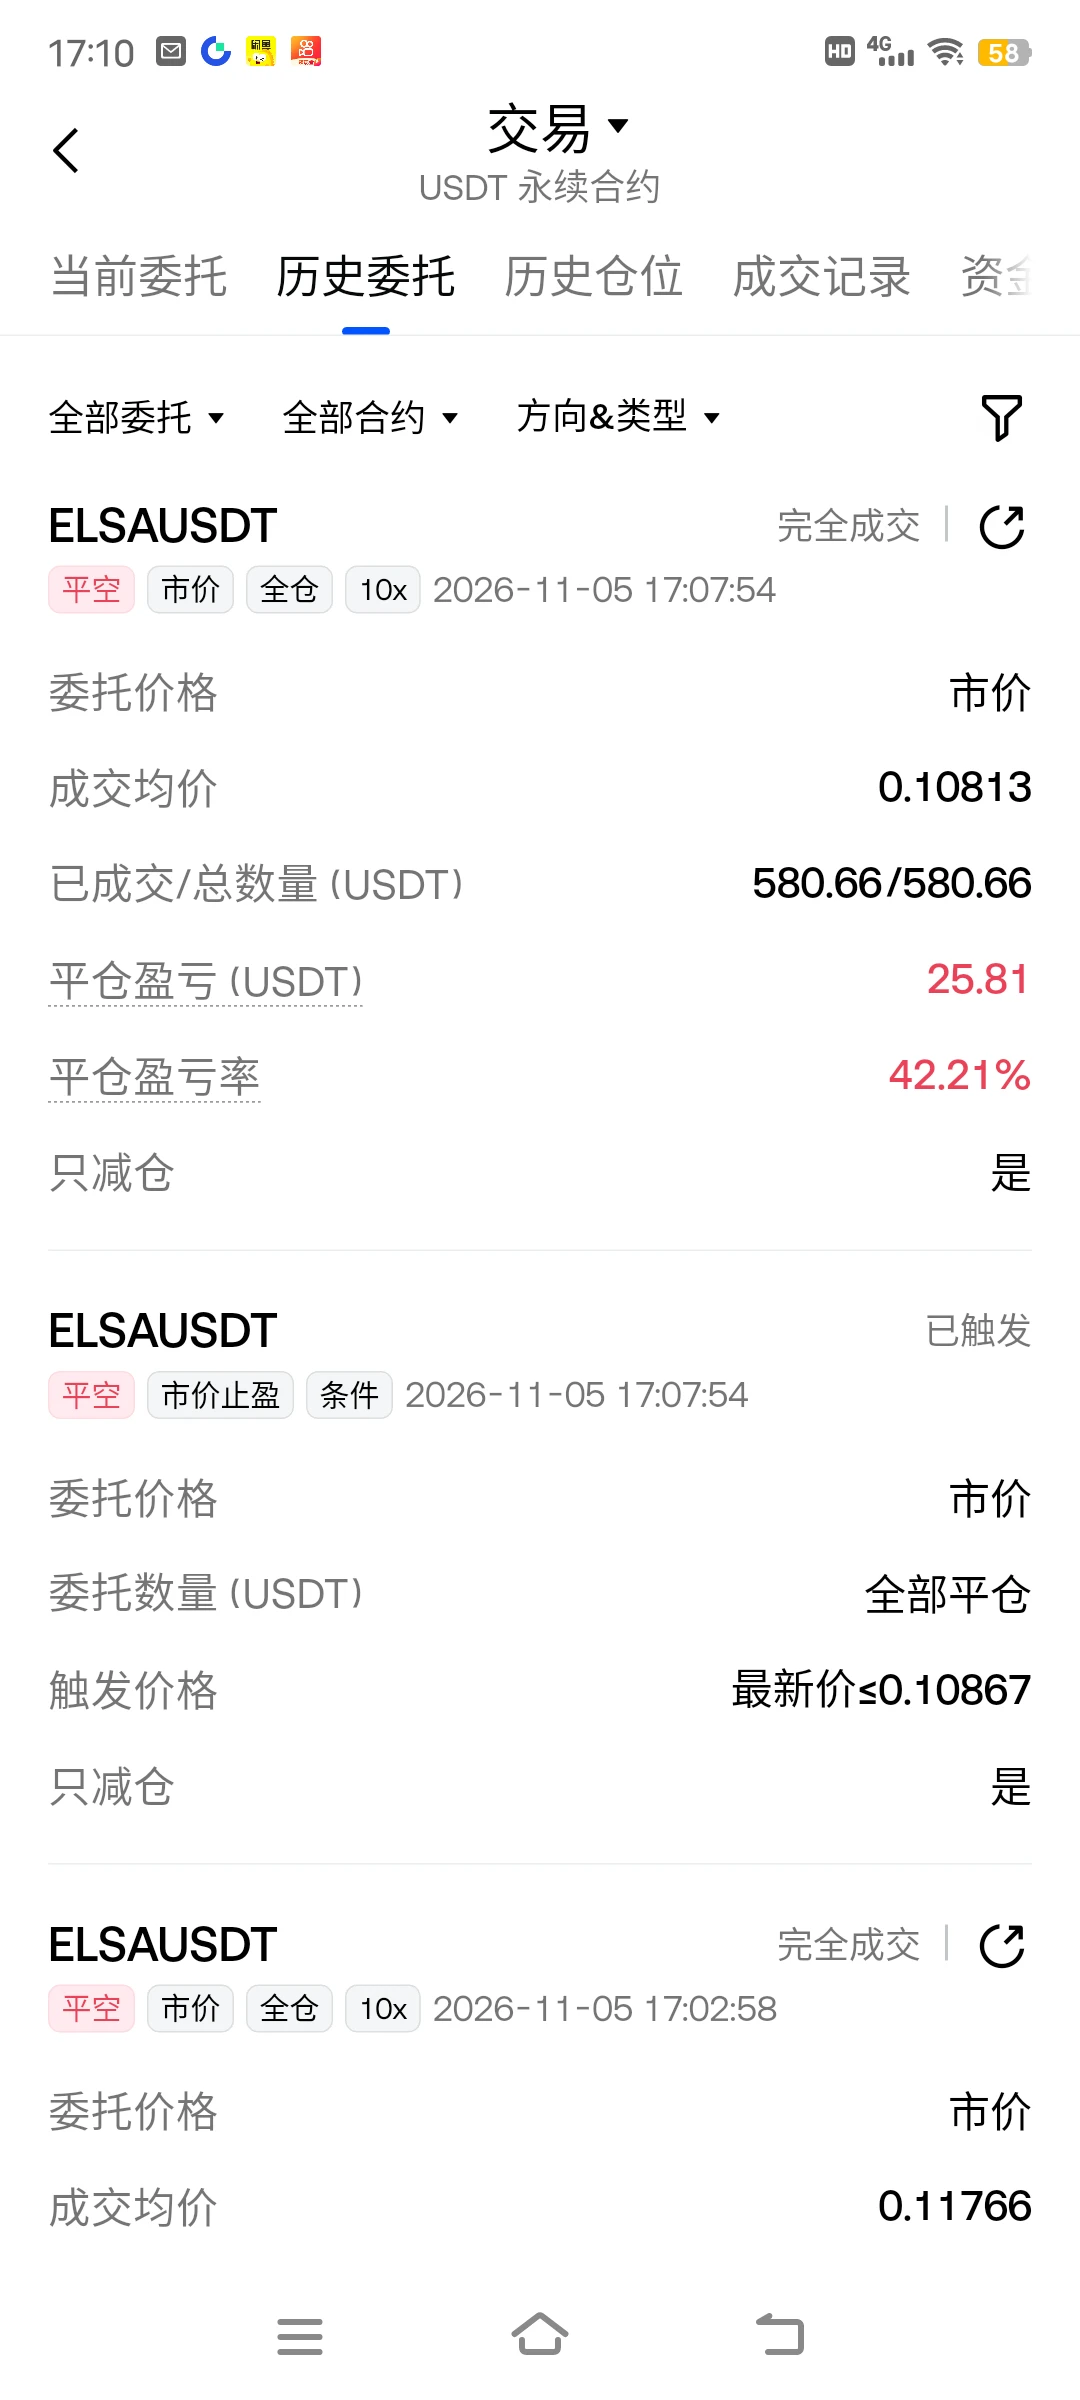
$ELSA That scared the hell out of me—I almost got liquidated. If it had been pushed up to 0.013, I would've been liquidated. Thanks, you damn market maker, for sparing me
post-image
ELSA+5.80%
  • 2
A choppy market is just free money—no exaggeration.
In a narrow 15-point range, others chase rallies and sell dips, getting hit both ways. We do just one thing: short the top and go long at the bottom.
Nothing fancy: identify the range boundaries accurately and execute when price reaches them. Don’t get greedy, chase, or hold on. In a range-bound market, the biggest mistake is chasing trades with a breakout mindset, while selling high and buying low is so simple that most people don’t believe it. $ETH ‌#Gate上线台股交易
ETH-1.23%
  • 2
Load More

Join 40 M users in our growing community

⚡️ Join 40 M users in the crypto craze discussion

💬 Engage with your favorite top creators

👍 See what interests you

Trending Topics

GateLaunchesPoSECProofOfSecurity

930 Views461 Discussing

Beyond Proof of Reserves, Gate has introduced PoSEC, a new Proof of Security framework focused on how user assets are stored and protected. By disclosing the distribution of assets across cold storage and hot wallets, users can directly understand Gate’s storage structure and risk coverage under extreme scenarios. Gate’s latest cold storage coverage ratio stands at 104.58%, meaning cold-storage assets alone are sufficient to cover all user assets. PoR verifies whether reserves are sufficient, while PoSEC shows how assets are stored and how risks are covered — together forming a more complete asset security framework. Share your results and experience! [👉 Learn more](https://gate.com/proof-of-security)

BTCBackAbove80K

58.53k Views41.31k Discussing

DemocratsWinBothChambers

21.04k Views467 Discussing

View More