




Share your thoughts
placeholder
Article
Very few people have dance with a coin from bottom to top with the market makers
Choose who U follow wisely
post-image
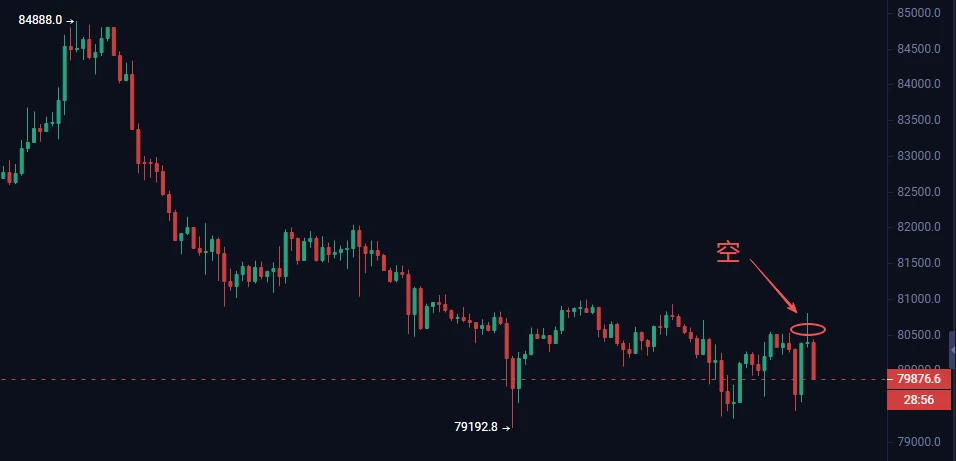
$BTC Signal】Long + 1H V-shaped reversal, 4H negative histogram contracting
$BTC 1H V-shaped reversal; after the long lower wick touched 79125, buying pressure pushed the price back above 79700. The current price of 79821 is holding above the EMA20/EMA50 convergence zone.
🎯Direction: Long
⚡Entry/limit order: 79657.737 - 79821.700
🛑Stop loss: 79023.483
🚀Target 1: 81019.026
🚀Target 2: 81617.688
🛡️Trade management: - Reduce the position by 50% upon reaching target 1 and move the stop loss up to breakeven. If the price falls back to the entry level, exit automatically to protect the principal
post-image
BTC+0.07%
ETH+0.60%
SOL+2.00%
A few days ago, I was still calculating whether I had enough money for instant noodles this month; this morning, I was already wondering whether to add a sausage.
The last thing I saw before bed was $BEAT edging a little above 0.1339. I rubbed my eyes and didn’t rush to chase a long position. Volume hadn’t followed through, and every push upward fell just short—this looked less like a breakout and more like a bull trap. I placed a short order around 0.1339, set my stop-loss, and went to sleep. When I opened the chart in the morning, the price had already fallen to 0.1253, and my account showed
post-image
BEAT+1.54%
BTC+0.07%
LAB-4.16%
It’s crazy to me that people still question whether institutions will need to hold XRP when the BIS is literally modeling XRP holdings required to support BILLIONS of transactions at scale.
Look at what they calculated.. (PDF image also attached)
198 XRP = 198 MILLION transactions
1,998 XRP = 2 BILLION transactions
19,998 XRP = 20 BILLION transactions
That final example represents approximately €52,000 worth of XRP providing the transaction fee capacity for 20 BILLION transactions, and the BIS literally defines T in its own calculation as “total XRP in both accounts”
..and remember, this is ON
post-image
XRP-0.50%
Everyone’s staring at ENA’s 4h chart—but the 15m RSI just whispered a secret that 90% of traders missed.

$ENA /USDT - SHORT

Trade Plan:
Entry: 0.17465 – 0.17637
SL: 0.18375
TP1: 0.16933
TP2: 0.16521
TP3: 0.15903

Why this setup?
- Price is pinned at 0.17551, but our MTF (4h) says SHORT with 55.4 conviction.
- Daily is *range*, not trend—so this is a scalp, not a story.
- 1h ATR (0.003434) is tight; the real juice is below: TP1 at 0.16933, TP2 at 0.16521.
- Why now? The 15m RSI (62) is hot while price stalls—classic bull trap fuel before a flush to the low 0.17s.

Debate:
If ENA sli
ENA+7.24%
$SUI broke out a few days ago, but I didn’t chase it directly and waited for a pullback confirmation before entering. The core logic at the time was that after breaking above a key level on strong volume, it failed to quickly fall back below it. Once that level was confirmed, there was an air pocket above. I entered a long via a limit order, and the market moved smoothly after entry without any major pullback.

I took partial profits at the first target during the rally, with roughly 70% of the position locked in at around +214.75%. I moved the protection level for the remaining orders above
post-image
SUI-1.17%
ADA-0.27%
DOGE-1.32%
Guys $ZEC Pumped to 1230$ From 780$ in 4 Days 🚀⚡️
Do You Think $BNB Can Pump Too From Here 750$ to 1200$+ in 4 Days????
Is it possible 🤷‍♂️🔶🤷‍♂️
{future}(ZECUSDT)
{future}(BNBUSDT)
ZEC+19.77%
BNB-3.38%
  • 1
🚀The sector is making a full-throttle push, with the bulls driving an explosive rally. $UAI After an extended period of bottoming at low levels, repeated volatility and shakeouts wore down many traders’ patience, causing them to dump their holdings early and miss the subsequent surge.
Order-book data shows that buying support in the bottom range has continued to strengthen, tokens have changed hands extensively, incremental capital has continued to enter, and bullish momentum has steadily built up. Opened a 50x leveraged long position at an average entry price of 0.38561, ignoring the shakeou
post-image
UAI+14.60%
ETH+0.63%
BTC+0.07%
( new streamer) market overview
live-cover
LIVE322
i just cooked a video i think you guys will love, had fun shooting it as well
but for now its time to goodnight
and the trenches have me feeling that way below
$BTR began coming under pressure and pulling back from around 0.05129. After entering, I watched BTR continue to grind lower without providing a decent rebound. I held the short for several hours. That kind of slow decline in the middle is the most trying, but I didn’t rush to act because key support below never appeared.

After falling to around BTR, consecutive lower wicks began appearing on the chart. As planned, I first closed 80% of the position and moved the protection level lower on the remainder. There’s no room for greed with this kind of move: lock in the profits first, and see whet
post-image
BTR-3.10%
ZEC+19.77%
BTC+0.07%
Nobody’s watching DASH while it quietly sets up a 12% trap—are you on the right side?

$DASH /USDT - SHORT

Trade Plan:
Entry: 69.25 – 70.71
SL: 76.94
TP1: 64.76
TP2: 61.28
TP3: 56.05

Why this setup?
- 4h bias is SHORT (55% conf), but 1D is *range*—so this isn’t a trend play, it’s a mean-reversion snipe.
- RSI 15m at 56 shows a dead-cat bounce into the 69.98–70.71 supply zone—perfect friction for a rejection.
- ATR 1h (2.90) means volatility is alive; the path of least resistance is down to TP1 (64.76) before the weekend liquidity hunt.
- Why now? Price is “Waiting” at entry—the cloc
DASH+5.67%
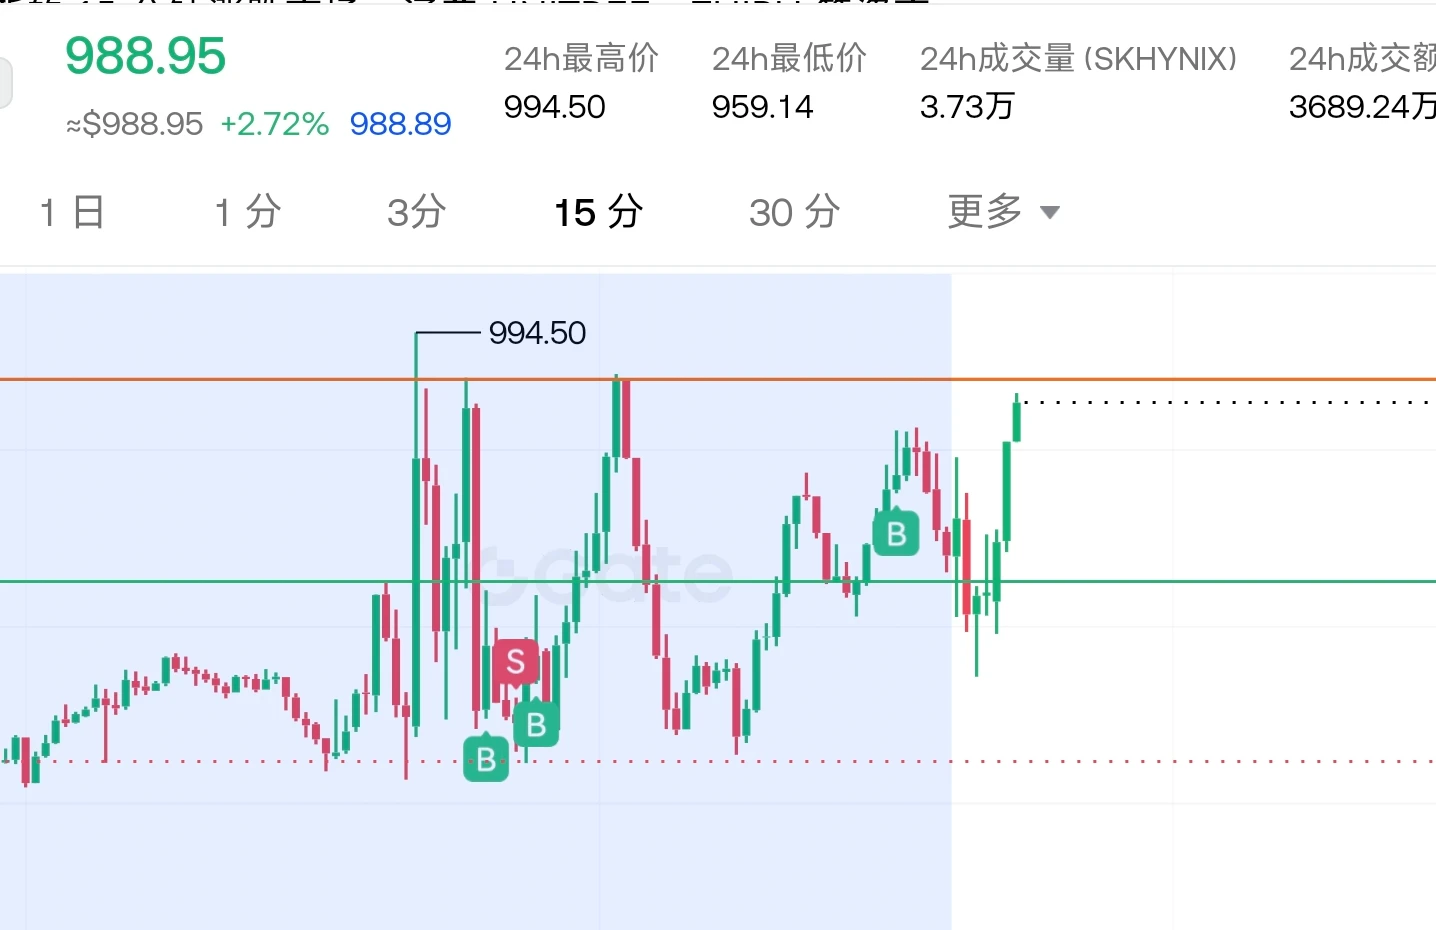
I did absolutely nothing—just went to the restroom, and when I came back, the candlestick chart had already done the work for me.
During the session’s bottoming phase, I watched $SKHYNIX for a long time. It held a sideways range at the bottom without breaking down, while funds were quietly entering. The volume looked unusual—yeah, it was the prelude to a pump. I opened a long directly around 1235.91, without the slightest hesitation.
When I checked the chart after lunch, the price had shot straight to 1285.22, and my account balance was jumping faster than my heartbeat. What a satisfying meal—
post-image
SKHYNIX+0.99%
BNB-3.38%
SNDK+0.93%
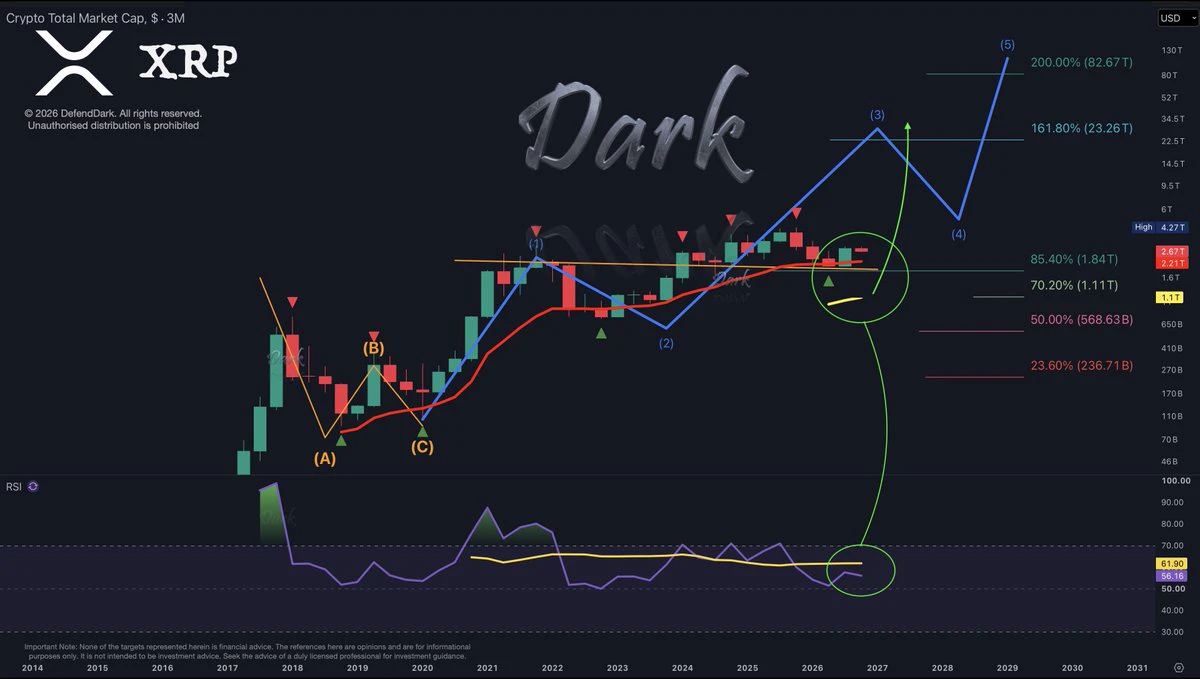
If total crypto marketcap closes above the green line that confirms what many are saying that we are indeed back in a crypto bull market. Probably takes a few attempts but a very pivotal point in the market.
post-image
I just took profit on a long position, so I’m reviewing it while the memory is still fresh. The market was moving sideways at the time, with the moving averages converging on the hourly chart, volatility narrowing steadily, and the chips clearly being compressed. I judged that the direction would most likely break upward, so I pre-positioned part of a long near the lower boundary of the range.

The move started somewhat later than I expected, with several false dips in between. However, none of the dips broke down the range structure, and the key levels were actually moving higher. This type
post-image
BNB-3.38%
DOGE-1.32%
I originally wanted to cut my losses as a sacrifice to the heavens, but the ritual failed and the meat cooked itself. 🔥 When the sell-off first hit in the early session, $TRX kept grinding around 0.36011, while buy orders below were sparse, like scattering bait with no fish coming. I only have one habit when watching the order book: seeing whether anyone catches the price on the way up. If support is insufficient, don't hesitate.

After entering, I didn't have to wait long before the market chose its direction. Now 0.33498 has fallen below 0.36011, with the position showing +495.35%. The tim
post-image
TRX+0.30%
SNDK+0.93%
BTC+0.07%
Everyone’s watching UNI’s 4H breakout, but the 95% confidence score is the quiet tell nobody sees yet.

$UNI /USDT - LONG

Trade Plan:
Entry: 7.114 – 7.192
SL: 6.778
TP1: 7.434
TP2: 7.621
TP3: 7.902

Why this setup?
- 1D trend is bullish, and price is holding above the 7.153 reference—this isn’t a random bounce.
- RSI 15m at 52.97 shows room to run before overheating, not exhaustion.
- ATR 1h at 0.156 gives clean volatility for a fast move toward TP1 7.434, then TP2 7.621.
- Why now? The setup is “Armed” with invalidation far below at 5.781—risk is defined, momentum is fresh.

Debate
UNI-0.94%
$1000 to $100,000 Crypto Trade Challenge Today
live-cover
LIVE1,598
MARSCOIN’s 4h signal just flipped SHORT at 0.18439—but the daily range says otherwise. Who’s lying?

$MARSCOIN /USDT - SHORT

Trade Plan:
Entry: N/A – N/A
SL: N/A
TP1: N/A
TP2: N/A
TP3: N/A

Why this setup?
- RSI (15m) at 43.28: No oversold bounce yet—momentum is still leaking downward.
- Daily trend is “range,” not downtrend—so this is a scalp, not a swing.
- Confidence 55.4 is lukewarm: The edge is timing, not conviction.
- Why now? Price is mid-range with weak buying pressure—shorts get paid when range-bound traders panic.

Debate:
Is 0.18439 the fake breakdown before a squeeze, o
MARSCOIN-20.68%
Load More

Join 40 M users in our growing community

⚡️ Join 40 M users in the crypto craze discussion

💬 Engage with your favorite top creators

👍 See what interests you

View More