Share your thoughts
placeholder
Article
I originally wanted to sell at a loss as a sacrifice to the heavens, but the ritual failed and the meat roasted itself. 🔥
During the repeated intraday swings, each push upward had less strength than the last, while trading volume kept shrinking. Every time it touched a key level, it was pushed back down. This kind of fake rebound is enough to fool beginners, but to experienced traders, it is an obvious signal. I opened a short in the direction of the key level, entered at 0.01387, set the stop-loss in advance, and left the rest to me and the market to grind out slowly.
The market is won by wa
post-image
ADA+0.27%
LAB-1.96%
No conviction, can’t hold—the profit on this move is paper-thin, but I love it to death🔥. I just finished lunch and checked the chart; $GIGGLE /GIGGLE was moving sideways, yet funds seemed to be quietly flowing in, so I went long and got in without waiting for the second K-line to confirm.

This bite of the move feels great. My cost is 37.85, now at 38.49, +81.48%. It’s not a huge gain, but I’m holding it steady. When going long, only realized profits are real.

I’ve put 75% in my pocket first, and moved the stop-loss on the remaining 20% to breakeven. Exit if it breaks down; if not, let it
post-image
GIGGLE+0.55%
SOL-1.10%
SNDK+2.09%
Why is everyone ignoring the bullish setup forming on HYPE right now?

$HYPE /USDT - LONG

Trade Plan:
Entry: 84.723 – 85.111
SL: 83.054
TP1: 86.314
TP2: 87.245
TP3: 88.642

Why this setup?
Why now? The daily trend is bullish, setting the macro stage for a continuation move. The 1h ATR of 0.776096 shows enough volatility to fuel a strong push, while the 15m RSI at 36.72 signals room to run before hitting overbought territory. The entry zone sits between 84.723 and 85.111, with the precise entry reference at 84.917, positioning us perfectly to catch the wave. The first target is 86.314, foll
HYPE-1.77%
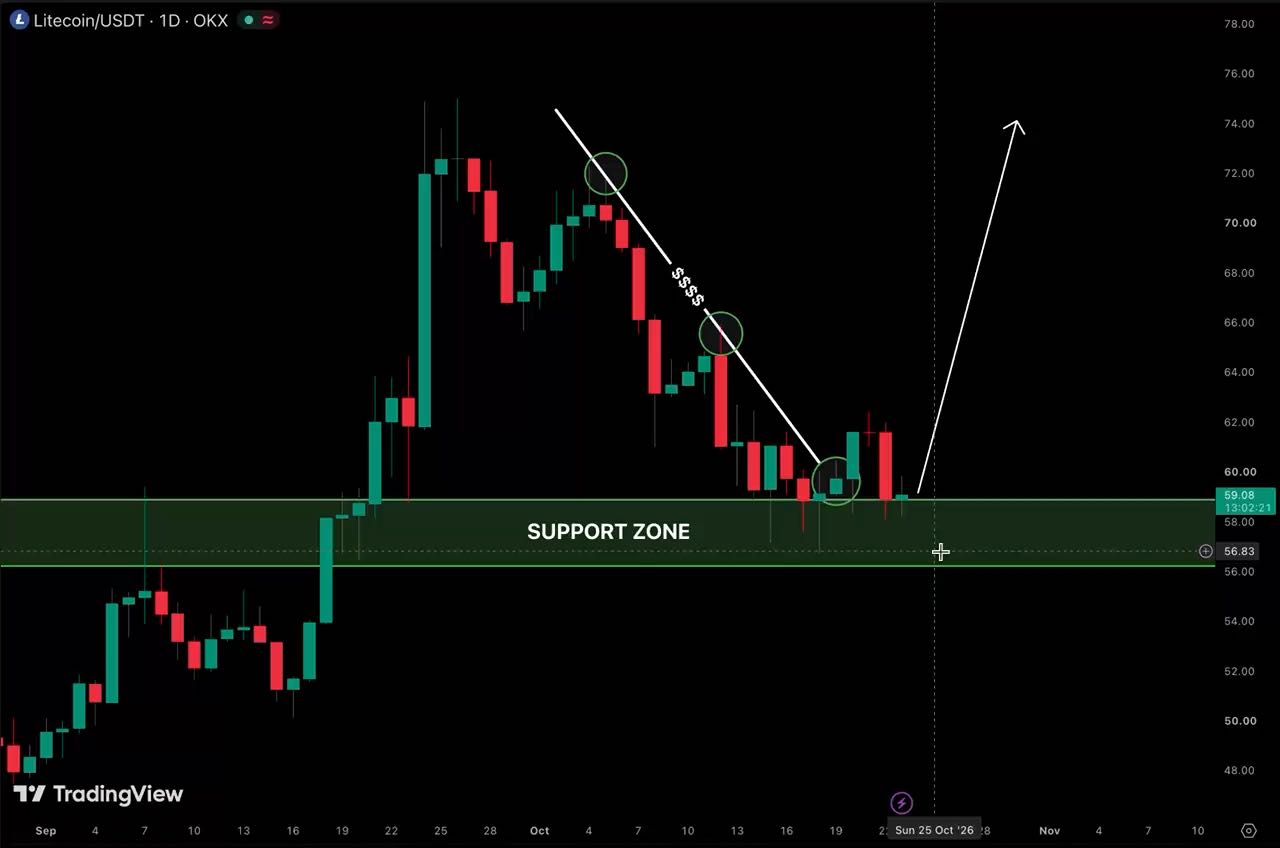
Smart money is quietly building a short position on SYMBOL while retail chases pumps.

$LTC /USDT - SHORT

Trade Plan:
Entry: 55.27 – 55.67
SL: 57.40
TP1: 54.02
TP2: 53.05
TP3: 51.61

Why this setup?
Why now? The daily trend is range-bound, which often precedes a directional breakdown, and the 1h ATR of 0.805067 confirms enough volatility to drive a move into our target zones. The 15m RSI sitting at 52.71 shows the asset is neither overbought nor oversold, leaving room for the downside to unfold. We are watching the 1h price of 55.48 as our reference point, with entries between 55.27 and 55
LTC+2.13%
#BTCDropsBelow80K BITCOIN DROPS BELOW $80K — THE MARKET IS WATCHING CLOSELY!
Bitcoin ($BTC ) has once again slipped below the $80,000 psychological level, putting traders and investors on alert. The $80K area has become an important battleground between bulls and bears, and losing this level can create additional short-term volatility across the crypto market.
📉 Why is $80K important?
The $80,000 level is not just a round number. It has become a major psychological zone where traders are closely watching price action. When Bitcoin trades above this area, bulls have a stronger argument that m
post-image
BTC-0.68%
The $SNDK long was a bit of a grind to hold, with one dip in between sweeping out quite a few short chasers and coming just a few points from my protective stop. I didn’t manually cut it at the time because the four-hour structure had not yet broken.
I entered based on a double bottom on the hourly chart. After the right-side breakout, it retested the prior-high neckline and held firm, so I went long after confirmation. The entry wasn’t particularly cheap, but the stop was very close—an attempt to use limited risk to capture a trend continuation.
After it rallied into the target zone, I manage
post-image
SNDK+2.09%
BTC-0.71%
ZEC-3.36%
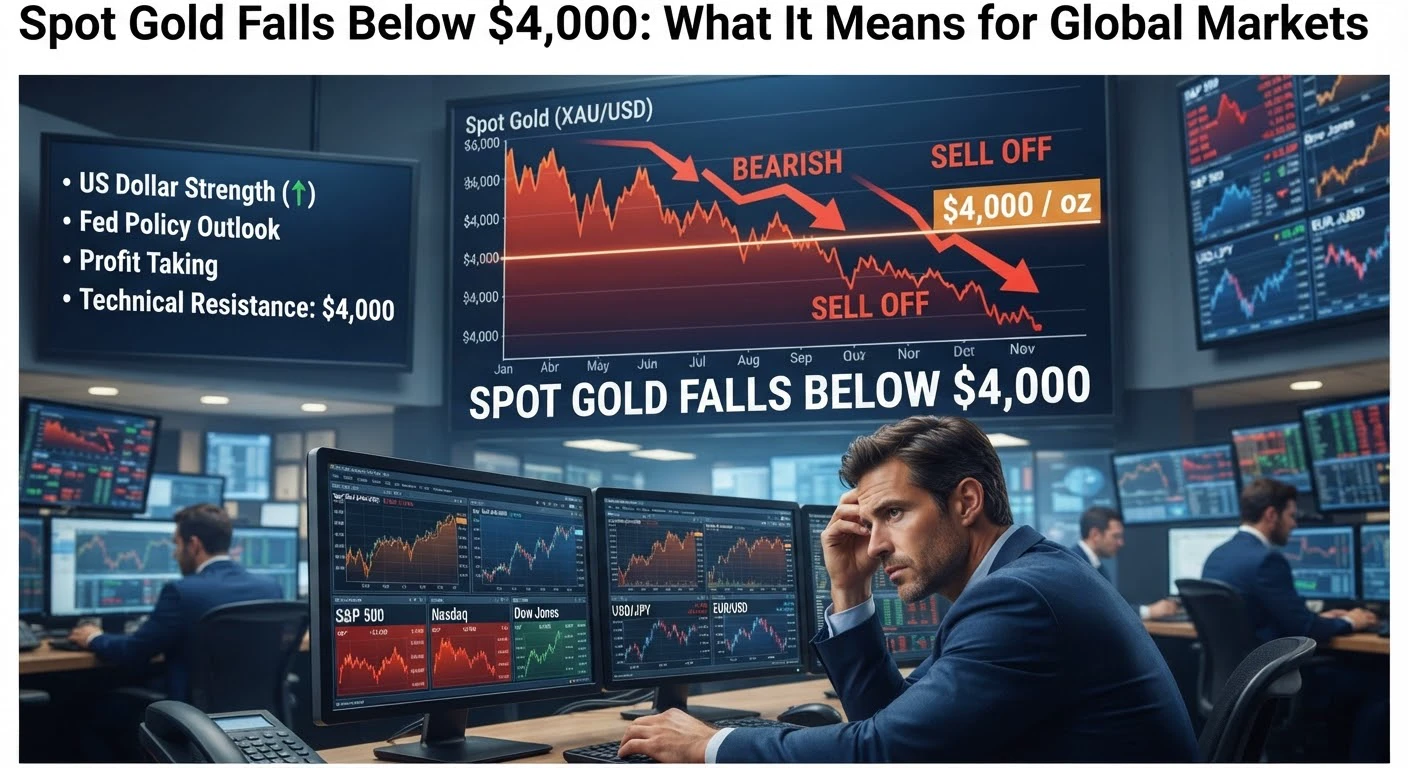
Don’t get off halfway. Trust Gold and give me one chance.
post-image
GLDX+0.95%
PAXG+0.57%
XAU+0.51%
This isn't a rebound—it's a lifeline for an account that was about to be cut off. A few days ago, the last thing I saw before bed was $FOLKS trading sideways at the bottom, dull enough to make anyone sleepy. But the volume was quietly changing—the buying pressure was strengthening. I said then that going long at this level was fine; only those bold enough to get on board get to eat the gains.

Just refreshed the page: the current price is 1.989, climbing all the way from 1.975, with +36.6% secured. Feels damn good—staying up late wasn't for nothing.

Let me quickly explain the move: Take 80
post-image
FOLKS0.00%
LAB-1.96%
DOGE+1.02%
I didn’t expect it to survive—it went straight to breakeven. The service was exceptional.

When it plunged intraday, I stared at the screen thinking: this trade might really be an expensive lesson. But then I noticed funds quietly entering and the pullback holding steady, so I felt it was still missing one final push. Today, it supplied that push itself.

$HUMA is currently at 0.02232, compared with my entry at 0.02133, bringing the paper gain to +118.5%. Those already on board should be waking up laughing—the profits feel great.

The prerequisite for compounding is staying alive; the short
post-image
HUMA+0.72%
BNB-0.74%
DOGE+1.02%
I originally just wanted to watch the show, but my account stepped onto center stage and put on a major performance. During the repeated intraday swings, $PUMP surged several times but fell just short each time, and volume failed to follow. The bull-trap signal was too strong, so I directly followed with a long position.

Entry price: 0.004391—I was betting on a weak rebound. It indeed moved without hesitation afterward, heading straight down. It is currently at 0.004487, with +152% secured. That really feels great. This is what it feels like to get the rhythm right: don’t fall in love with
post-image
PUMP+15.24%
XRP-0.29%
ADA+0.27%
JUST IN: Harmony says ONE deficit on six exchanges has fallen to 6.581 billion ONE as it works to resume deposits, withdrawals, and trading after the August incident; on-chain tracking and exchange cooperation underpin the recovery. $ONE
post-image
No big-picture thinking, can’t hold on—but this move’s profit is paper-thin, and I love it. When $JTO had just started getting dumped in the early session, I was still wondering whether it would continue grinding lower. Before I even had time to hesitate, the price was already tumbling.
The intraday action had actually given us signals: the rebound was weak, overhead resistance was clear, and each wave of selling was heavier than the last. This is the kind of market I know best, so I decisively opened a short near 0.5290 on the rebound, without the slightest hesitation.
Looking at it now, the
post-image
JTO-3.08%
SNDK+2.09%
ZEC-3.36%
$KAS I’m dying laughing—looks like everyone sold too early. Especially those few who were cursing every day before.
post-image
KAS+15.27%
new update 🥰🌹
live-cover
LIVE1,866
Why is everyone ignoring the obvious short setup forming right now?

$MU /USDT - SHORT

Trade Plan:
Entry: 1041.00 – 1043.04
SL: 1054.80
TP1: 1032.43
TP2: 1026.04
TP3: 1016.46

Why this setup?
Why now? The daily trend is range-bound, which often precedes a sharp directional move, and the 1h price is sitting at 1042.02 inside a tight entry zone between 1041.00 and 1043.04. The 15m RSI is at 73.15, showing momentum is overheated and ripe for a pullback, while the 1h ATR of 4.096836 confirms enough volatility to fuel a leg down. The first target is 1032.43, followed by 1026.04, but this entire
MU+2.01%
This move doesn’t even require me to think—the account is dancing on its own🤣.

With the screen glowing green, $SOL /SOL was lying on the ground, clearly consolidating at the bottom. I watched it three times and decisively went long. Everyone else was running, but I insisted on buying.

Fine, the market gave me the answer. Entered at 103.42, took 104.13, and walked away with +63.86% profit—staying bullish wasn’t in vain.

Take the first 75% off, and set protection for the remaining 20% at the entry price. Don’t let floating profits turn into floating losses overnight.

Being out of a posit
post-image
SOL-1.10%
DOGE+1.02%
ETH-0.12%
In the early session, the price pulled back to around 828.40 and stabilized, so I went long directly. The plan is simple: as long as the hourly candle body does not break the level, the upside target is the high-volume trading zone, with the stop-loss placed at the same time.

After entering, the price consolidated for a short while, with one wick in between, but I did not adjust the position. Once the hourly chart closed bullish again and pushed upward on increased volume, I took 70% off at the first target and moved the stop-loss on the remaining position directly above the breakeven level.
post-image
ADA+0.27%
SNDK+2.09%
BTC Bitcoin | Current price 79030

✅Short-term
Bullish-bearish dividing line: 79350

- Long: Hold above 79350 to go long, target 80200, stop-loss 78900

- Short: Rejected at 79350 to go short, target 78650, stop-loss 79780

✅Medium- to long-term
Support 77200, strong support 74900
Resistance 81800, strong resistance 83500

- Set up a long position near 77300 on a pullback, target 83000, stop-loss 76400

- If 83500 is not broken, set up a mid-term short on a rally to 83200


ETH Ethereum | Current price 2485.6

✅Short-term
Bullish-bearish dividing line: 2498

- Long: Hold above 2498
BTC-0.68%
ETH-0.05%
SOL-1.04%
BNB-0.72%
Why is everyone suddenly shorting WLD when the 1h price just hit 0.5041?

$WLD /USDT - SHORT

Trade Plan:
Entry: 0.5009 – 0.5069
SL: 0.5419
TP1: 0.4754
TP2: 0.4564
TP3: 0.4278

Why this setup?


Debate:
Are we hitting TP2 at 0.4564 or is the range about to break higher?

⚠️ Personal market analysis only. NFA — manage risk and DYOR.
Educational content, not investment advice or a recommendation to buy, sell, deposit, or withdraw any asset. No paid promotion or referral/affiliate links.
WLD+19.45%
Load More

Join 40 M users in our growing community

⚡️ Join 40 M users in the crypto craze discussion

💬 Engage with your favorite top creators

👍 See what interests you