Square
Following
Hot
News
Profile
Share your thoughts
placeholder
Article
#BTC大跌 #美股财报季 Starting today, use 100u to have Musk's bot automatically place orders for 15-minute trades.
BTC-0.67%
Wall Street just went onchain. Crypto holders might want to check the fine print.
DTCC launched tokenization infrastructure backed by a custody business holding $114T in securities.
Here's the awkward part. Banks can use DTCC's private blockchain without buying your favorite crypto token.
Bitcoin already seems to need Nasdaq's permission to rally. Now Wall Street might adopt blockchain without buying our bags.
Wall Street gets the technology. Who actually gets the token demand?
Which token can the banks NOT avoid?
BTC-0.67%
NDAQ+0.65%
Trenches
ZIG
Z
bade
b
ZIG
0x8c...1145
Market Cap
$.
Change
.
24h Vol
$.
Holders
.
uni
u
bade
b
uni
jM9r...pump
Market Cap
$.
Change
.
24h Vol
$.
Holders
.
Anakin
A
bade
b
Anakin
Exxz...pump
Market Cap
$.
Change
.
24h Vol
$.
Holders
.
IDOL
I
bade
b
IDOL
0x3b...ab07
Market Cap
$.
Change
.
24h Vol
$.
Holders
BTC
B
bade
b
BTC
C5xp...pump
Market Cap
$.
Change
.
24h Vol
$.
Holders
.
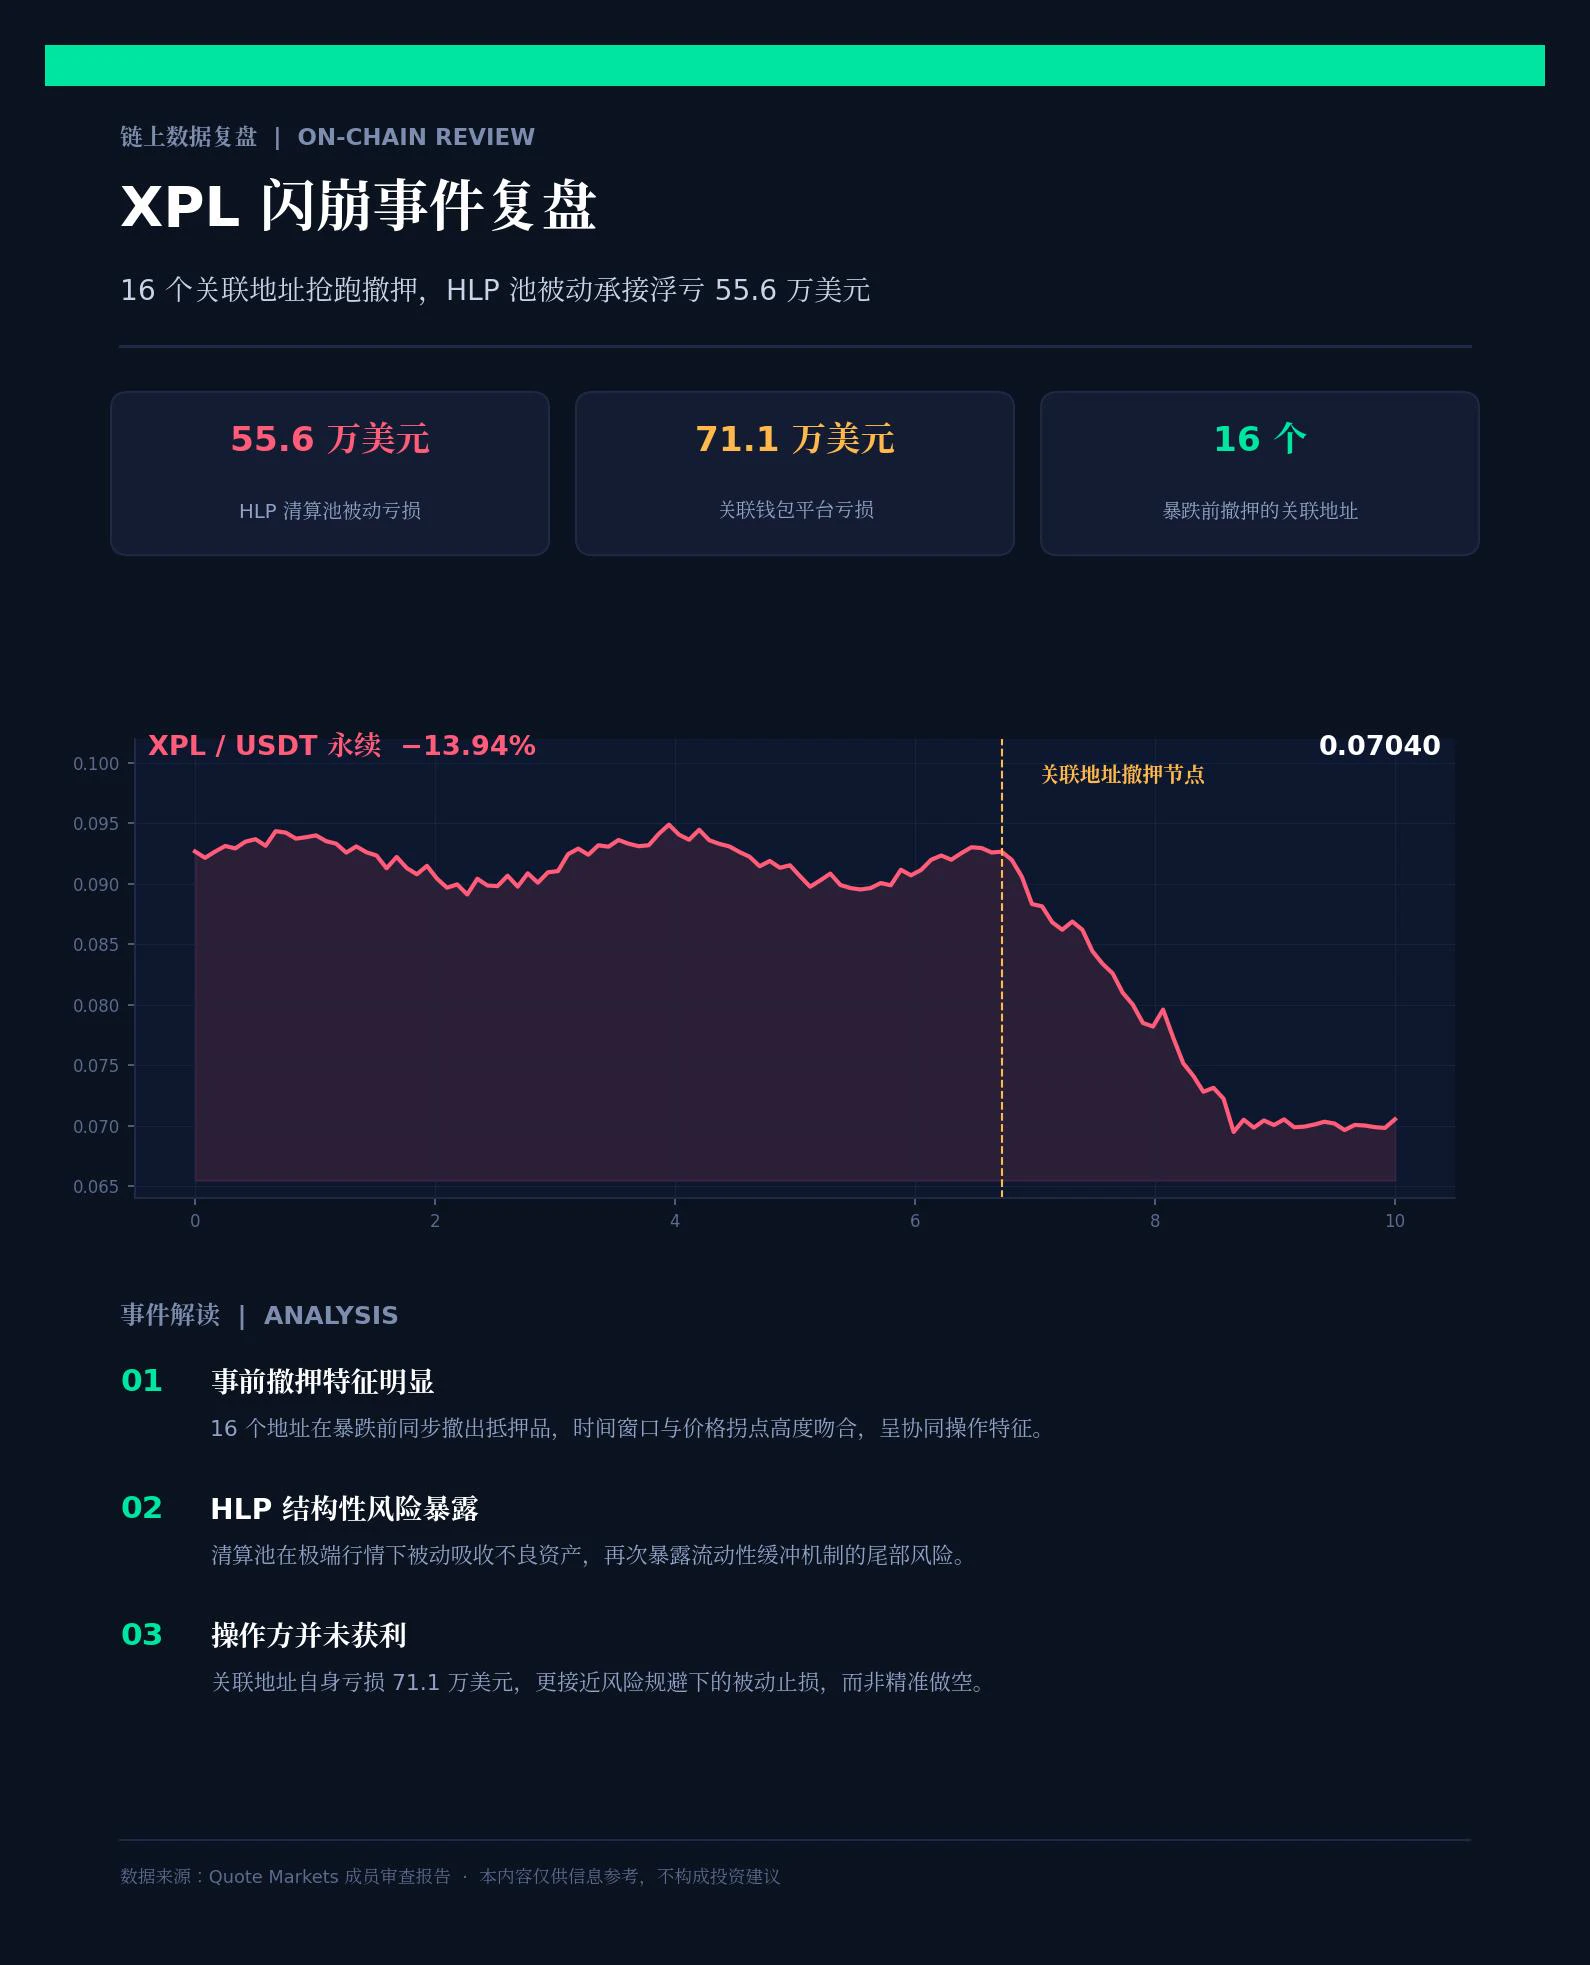
XPL flash crash postmortem: 16 linked addresses front-ran the event by withdrawing collateral, leaving the Hyperliquid HLP pool to passively absorb $556,000 in unrealized losses
An on-chain review report on the XPL crash published by a Quote Markets member lays out the core sequence: before the price collapsed, 16 linked wallet addresses collectively withdrew their XPL collateral. These preemptive moves directly triggered a chain reaction: Hyperliquid’s liquidation pool (HLP) was forced to take over the positions, ultimately recording losses of approximately $556,000.
Notably, the parties that
post-image
XPL-0.60%
HYPE+0.33%
Is this rebound finally real, or just another fakeout? $HYPE $HYPE has touched those moving averages again, and the battle between bulls and bears has become quite intense. Keep watching to see whether buyers can truly hold this level, or whether the price will slide all the way back down again.
Take-profit: 91.714 Stop-loss: 84.646 Hot coins: $ETH : Current price 2,275.03 - 24-hour change: +0.91%$IDOL : Current price 0.024862 - 24-hour change: +45.10%
post-image
HYPE+0.24%
IDOL-6.71%
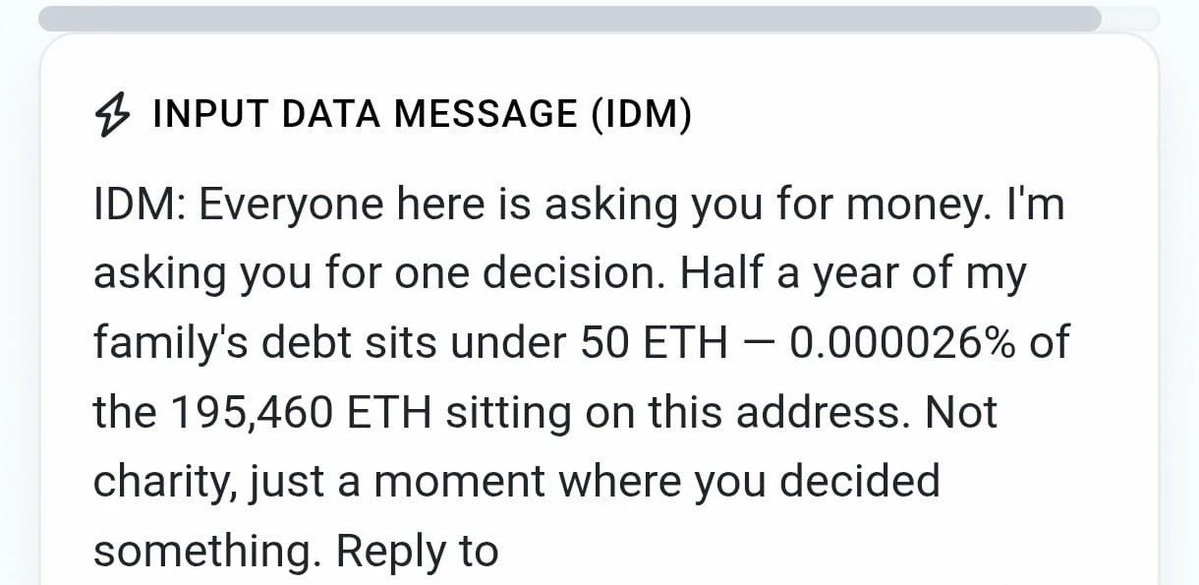
There are still 190k $ETH in the hacker’s ETH address, untouched.
Lots of people are sending on-chain messages to the hacker’s address, mostly begging for handouts… Can they really beg their way into getting anything? 😂
Let’s take a look at these two:
One said ↓
“Dear brother! You’re in a very dangerous situation. Good luck! If you could donate just a little ETH, it could help me start my life over. I’m very poor right now, and I have many dreams! I will pray to Almighty God for your safety!”
The other said ↓
“Everyone here is asking you for money. All I’m asking is that you make a decision.
post-image
ETH-1.26%
morning market update
live-cover
LIVE1,871
What is Grokbot freaking out about?
Used up 30% of my quota in two days without doing anything???
post-image
What is the risk-reward ratio? Why can a trade have long-term value even if its win rate is low, as long as risk is managed properly?
In cryptocurrency trading, many people focus too much on win rate, believing that they need to make frequent correct calls to make money. But what really affects long-term trading results is not just the win rate, but also the amounts gained and lost on each trade. The risk-reward ratio is an important tool that helps traders assess whether a trade is worth taking.
First, what is the risk-reward ratio?
The risk-reward ratio typically compares a trade’s potential
post-image
You’re all giving it a try,
so I’ll give it a shot too and see if it can spark a boost in my traffic.
If that doesn’t work, I really won’t know what to do.
post-image
Can NFTs be poisoned too?
A few unfamiliar NFTs suddenly appeared in my wallet. I don’t remember taking part in these projects, and the thing is, I can’t sell them—every time I try, I get an error
  • 3
  • 1
$XPL This -13.57% bearish candle has all the hallmarks of a heavy shakeout by market makers. Look at the data: the 24h low of 0.0690 was a perfect wick below 0.07 to sweep stop-losses, and the 146.4M in trading volume shows that all the panic selling was absorbed. Meanwhile, the drop from the 0.0862 high to the current price of 0.0706 was almost a half-price-style retracement—a classic pattern of a sharp dump after a pump to shake out chasers, followed by accumulation at lower levels. Old K in my group was watching the 0.069 level last week.
Trading plan: Start with a small long position at 0.
XPL-0.60%
  • 8
[New Streamer] Market Prediction
live-cover
LIVE1,803
  • 1
Nov. 2 Daytime Trading Strategy: Negotiation Deadlock, Neither Side Yielding, Withdrawal Run, Grid Low-Long
Overnight, ETH fell from a high of 2278 to a low of 2247, a 31-point spread. After 7 a.m., it climbed back to around 2278 due to the news of a BTCPay security alert (the latest news on the morning of the 2nd).
Shorts may be wary of the “withdrawal run” logic: a “wave of withdrawals” means spot assets are being taken off exchanges and hoarded, leaving less supply, so “BTC and other assets may rise in price due to the run.”
So, after 7 a.m., shorts closed positions en masse. “Short coverin
ETH-1.26%
BTC-0.67%
What Is Trading Signal Confluence? Why Doesn’t It Guarantee a Successful Trade Even When Multiple Indicators Issue Similar Signals?
In cryptocurrency trading, traders often use moving averages, RSI, MACD, trading volume, and support and resistance analysis at the same time. When multiple signals point in the same direction, many people assume the probability of a successful trade must be higher. But having more signals does not mean there is sufficient evidence, nor does it mean the market outcome is certain.
First, what is trading signal confluence?
Trading signal confluence means that differ
post-image
What Is Trading Signal Confluence? Why Doesn’t Multiple Indicators Giving Similar Signals Mean a Trade Is Guaranteed to Succeed?
In cryptocurrency trading, traders often use moving averages, RSI, MACD, trading volume, and support and resistance analysis at the same time. When multiple signals point in the same direction, many people assume the probability of a successful trade must be higher. But having more signals does not mean there is sufficient evidence, nor does it mean the market outcome is already certain.
First, what is trading signal confluence?
Trading signal confluence refers to di
post-image
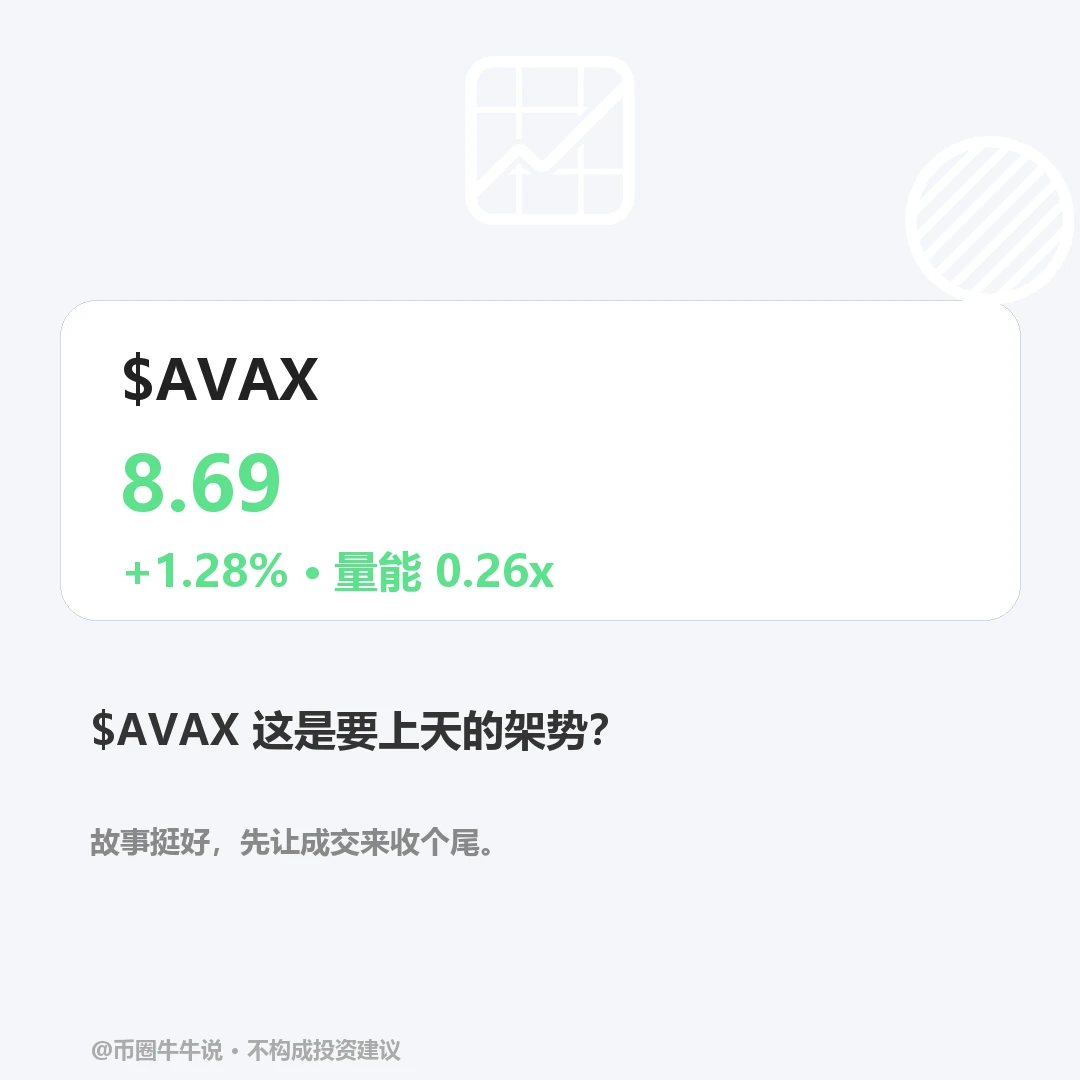
Divergence: $AVAX is currently at 8.687, weak on the 1-hour chart but strong on the 4-hour chart, with trading volume at only 25.8% of average. How should this contradiction be interpreted?
The 1-hour RSI has fallen to 34.4, indicating continued short-term selling pressure, while the 4-hour timeframe is signaling strength. This kind of conflict between timeframes often means the direction is still unconfirmed. Without volume confirmation, any short-term rebound or pullback could be a fake move.
If the price can move above 9.06 and hold there, the bullish outlook would be worth reassessing; if
post-image
AVAX-0.10%
$UAI A wick can liquidate you, but it can't take profit.
post-image
UAI-7.58%
Load More

Join 40 M users in our growing community

⚡️ Join 40 M users in the crypto craze discussion

💬 Engage with your favorite top creators

👍 See what interests you

Trending Topics

BTC大跌

553.59k Views39.96k Discussing

$BTC briefly fell below $77,000 and remains under pressure around the $77K zone, with its 24-hour decline still above 4%. With risk appetite weakening and Fed uncertainty rising, where is the next key support after losing $80K?

IntelBeatsEarningsButStockPlunges

52.9k Views1.1k Discussing

StrategySTRCNears100ParValue

61.75k Views4.23k Discussing

View More