


Share your thoughts
placeholder
Article
After closing 70% of the position, the hardest part is not continuing to hold, but not immediately opening another trade. Before entering this $LTC long, the market had been ranging for quite some time. I gave up trying to guess the direction in advance and only followed after the price genuinely broke out of the range. The entry was not particularly early, but the structure was clear, making it easier to hold with confidence.

There was one pullback while holding the trade, which happened to test the protective level I had set. I was already prepared to be stopped out, but the price recovere
post-image
LTC+5.79%
ADA+4.75%
XRP+1.35%
Everyone’s watching Bitcoin—but the quiet killer on 4h just flashed a 77% short signal.

LTC/USDT - SHORT

Trade Plan:
Entry: 54.32 – 54.62
SL: 56.31
TP1: 53.09
TP2: 52.17
TP3: 50.78

Why this setup?
- LTC/USDT is stalling at 54.47 with a daily range—no momentum to break higher.
- ATR (0.59) is tight, but RSI 15m at 50.91 shows zero buying pressure—just dead air before the drop.
- Why now? The 1D trend is range-bound, and price is rejecting the upper band. TP1 at 53.09 is a 2.5% scalp; TP3 at 50.78 is the real prize if 51.35 support cracks.
- The clock is ticking: this setup waits for
BTC+0.42%
LTC+5.98%
The hand that set the stop-loss a few days ago trembled slightly; this morning, I realized that overprotective gesture had been unnecessary. The final $DOT rebound before bed reached around 1.193. It looked strong, but the more it pushed, the more hollow it felt—the volume failed to keep up, and it clearly could not hold. The short position was already open, so I placed the stop-loss outside the key level and went to sleep, thinking I would accept it if I got stopped out. When I woke up, the price had not tested higher; instead, it slid to 0.922, delivering a paper return of +1611.81%. Staying
post-image
DOT+3.23%
ETH+2.00%
SNDK+0.91%
Million Challenge Day 16
The weekend market completely replicated last week
This week’s goal is to hold above 80,000 and push toward 82,000-84,000
Preparing to buy back Bitcoin and Ethereum
For altcoins, look for those showing breakout trends or that have already broken out
Don’t look for those at low levels—the market has been brewing for so long, so let the dead money die
post-image
BTC+0.42%
ETH+2.01%
Good morning, review
OP is performing quite well today. Although it hasn't risen as much as arb, hold on to your position
Let's take another look at Nvidia when the market opens tomorrow
Stay the course
OP+11.03%
ARB+46.18%
NVDA+0.87%
Everyone’s staring at SOL’s 104 handle, but the 4h chart is whispering a trap most traders refuse to hear.

$SOL /USDT - SHORT

Trade Plan:
Entry: 103.91 – 104.25
SL: 105.72
TP1: 102.85
TP2: 102.03
TP3: 100.79

Why this setup?
- RSI on the 15m is already at 64.95—overbought before we even break higher.
- 1D trend is range, not reversal: that means 104.08 is the ceiling, not the launchpad.
- ATR on 1h (0.68) is thin—when volatility squeezes, shorts snap first.
- Why now? We’re waiting at entry with TP1 at 102.85 and a hard invalidation at 102.50. If that cracks, the bull case dies.

D
SOL+2.14%
An Analysis of BTC Short-Term Price Trends from Dow Theory, Chan Theory, Elliott Wave Theory, Volume-Price Relationships, Order Flow, and Price Action (Strategy Recommendations)
Comprehensive Assessment
Dow Theory confirms that the primary trend remains strongly bullish, but the pullback on September 4 and the extremely low-volume consolidation on September 5–6 indicate that 82,000–82,260 is extremely strong short-term resistance, and the market has entered the “eve of a major shift.”
Chan Theory shows that the downward stroke from 82,262 had very strong momentum (-6,014), followed by a modera
BTC+0.42%
You are not worthy of your ambitions, and you have let the suffering you endured go to waste.
$ESPORTS , hurry up and go to zero—delist it.
post-image
ESPORTS-2.93%
#GateEventContractTradeSharingChallenge #BTC
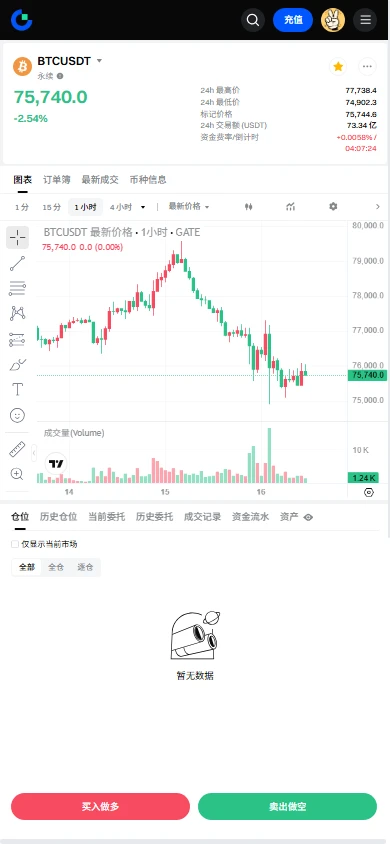
Bitcoin is currently around $79,940, and in my view this is one of the most important decision zones of the entire recent move. BTC has already demonstrated that buyers are willing to defend the $77,000–$78,000 region, but the market is now facing a completely different challenge: can Bitcoin convert the $80,000 psychological level into genuine support while the U.S. macro environment is becoming more complicated? My view is cautiously bullish above the major support zones, but I would not call this a confirmed breakout yet. The market needs confir
BTC MARKET UPDATE
live-cover
LIVE1,009
Safari can watch any webpage for a restock or price drop and ping you when it happens.
Open the page, tap the menu in the address bar, then Notify Me. Type what you want watched (back in stock, price under $100), pick hourly or daily, and close the tab.
Would you let Safari shop-watch for you?
Everyone’s watching $HOME /USDT pump—but the 1D trend says we’re early to a rug pull.

$HOME /USDT - SHORT

Trade Plan:
Entry: 0.00614 – 0.00616
SL: 0.00625
TP1: 0.00607
TP2: 0.00602
TP3: 0.00594

Why this setup?
- 4H structure screams SHORT with 95% confidence, yet the 15m RSI at 61.64 is the trap’s bait.
- Entry zone 0.00615 sits under the 0.00616 invalidation—one wick above kills the thesis.
- Why now? The bearish daily trend + ATR (1h) of 0.000043 means volatility is compressed—breakouts fake out first.

Debate:
Is 0.00607 your TP1 exit, or are you holding for the 0.00594 flush?

HOME+1.49%
Nobody’s watching PEPE’s quiet 4H reversal—but the data just whispered a nasty secret.

PEPE/USDT - SHORT

Trade Plan:
Entry: 0 – 0
SL: 0
TP1: 0
TP2: 0
TP3: 0

Why this setup?
- 1D trend is *range*, not bullish—so every spike is a short seller’s gift.
- RSI on 15m sits at 56.9, stalling before overbought—momentum is faking strength.
- Confidence 55 on SHORT means the edge is thin but real; entry is still “Waiting,” so we’re early, not late.
- Why now? Because range tops punish late longs—and this setup is 0.5% from a trap.

Debate:
If PEPE rejects this level, do you fade the breakout
PEPE+4.27%
Take profit or significantly reduce the position around 2495–97 (you can try a small short at 2497–95, with a stop-loss at 2510)
post-image
$Urmom made it for us
post-image
Gate Futures newly listed: $GIGGLEMAX
🔹 Trading pair: $GIGGLEMAX / USDT
🔹 Trading time: Now open
🔹 Supports 1 - 10x leverage, trading bots, and copy trading. GIGGLEMAX is a Meme token on the BSC chain. Its image is the little rabbit mascot of Giggle Academy (named Max).
Trade $GIGGLEMAX: https://www.gate.com/zh/futures/USDT/GIGGLEMAX_USDT
More details: https://www.gate.com/zh/announcements/article/101568
GIGGLEMAX+5.15%
  • 1
  • 1
$SOL sol has caused so many retail short sellers to be liquidated, clearing out their positions to test the waters. Play small for fun, play big...
SOL+2.07%
Everyone’s chasing gold, but XAUT just flashed a quiet sell signal nobody’s talking about.

$XAUT /USDT - SHORT

Trade Plan:
Entry: 4426.6 – 4428.8
SL: 4436.5
TP1: 4421.1
TP2: 4416.7
TP3: 4410.2

Why this setup?
- 4H bias is SHORT with 55.4% confidence—not a screaming trade, but a tactical fade.
- Price pinned at 4427.7, right on the entry ref, with RSI (15m) at 56.3—no overbought fuel left for bulls.
- ATR (1h) = 4.38 means tight stops; the range-bound 1D trend favors scalping the drop to TP1 (4421.1) and TP2 (4416.7) before the next squeeze.
- Why now? We’re waiting at the edge—stat
XAUT-0.02%
Load More

Join 40 M users in our growing community

⚡️ Join 40 M users in the crypto craze discussion

💬 Engage with your favorite top creators

👍 See what interests you

View More