Square
Following
Hot
News
Profile
Share your thoughts
placeholder
Article
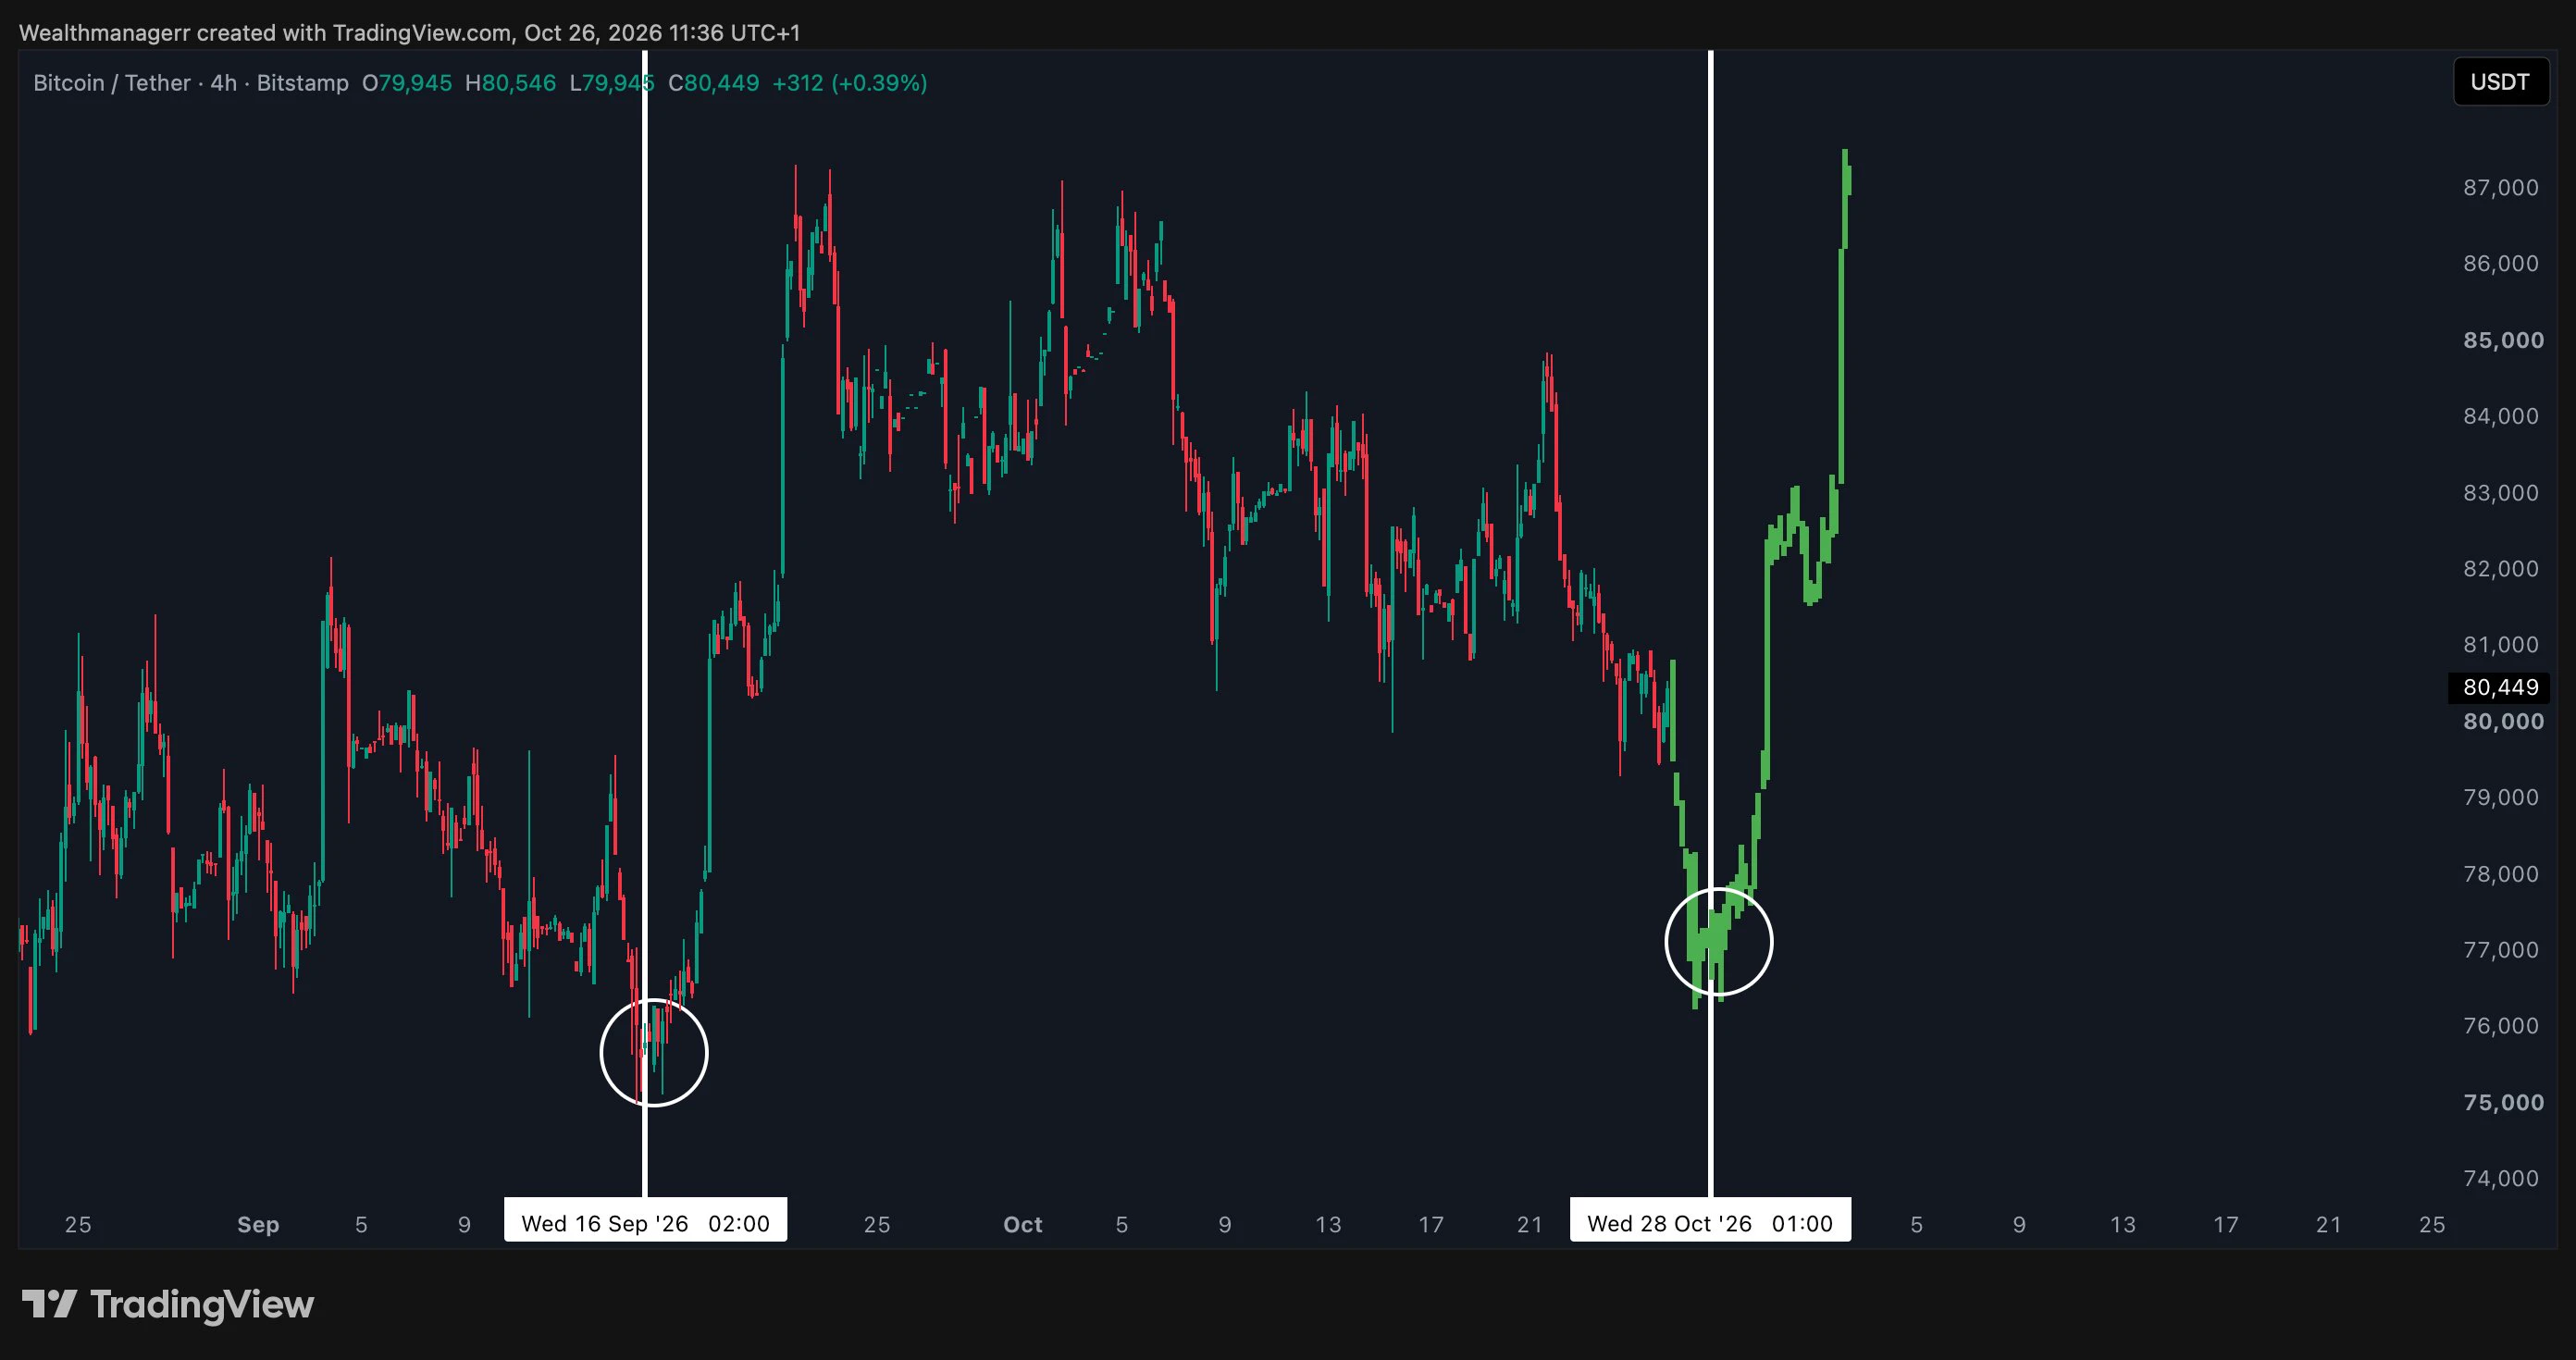
The people shouting “breakdown” panicked first—the person on my list didn’t move, saying just one thing: this week must not close below 83000.
CryptoPunk made it very clear: 83000 can be tested repeatedly, and even briefly broken in the short term, but a weekly close below it is another matter—the next stop is the 50-week moving average, currently around 77100.
This is what I look for when choosing people—he doesn’t bet on direction, holding 83000 above and placing orders at 74000 below; when it reaches either level, he goes all in.
Do you think this week will close above or below 83000? Say i
post-image
BTC-0.75%
ETH Watch from a Jerk
The jerk hasn't mentioned Ethereum in a long time.
Cryptocurrencies fell again today. Let's see what the jerk's next move should be. As we can see in the chart, yesterday's decline has pushed ETH's price back into the range of the large bullish candle created on 8.21. In the short term, we should look for rebounds near several midlines. Of course, we also need to be mindful of the possibility of a market breakdown and a direct plunge, in which case the price could crash to around 1900.
In the short term, let's look at rebound levels such as 2370 $ETH
post-image
ETH-3.09%
$BTC The crypto market has once again seen a billion-dollar-scale wipeout!
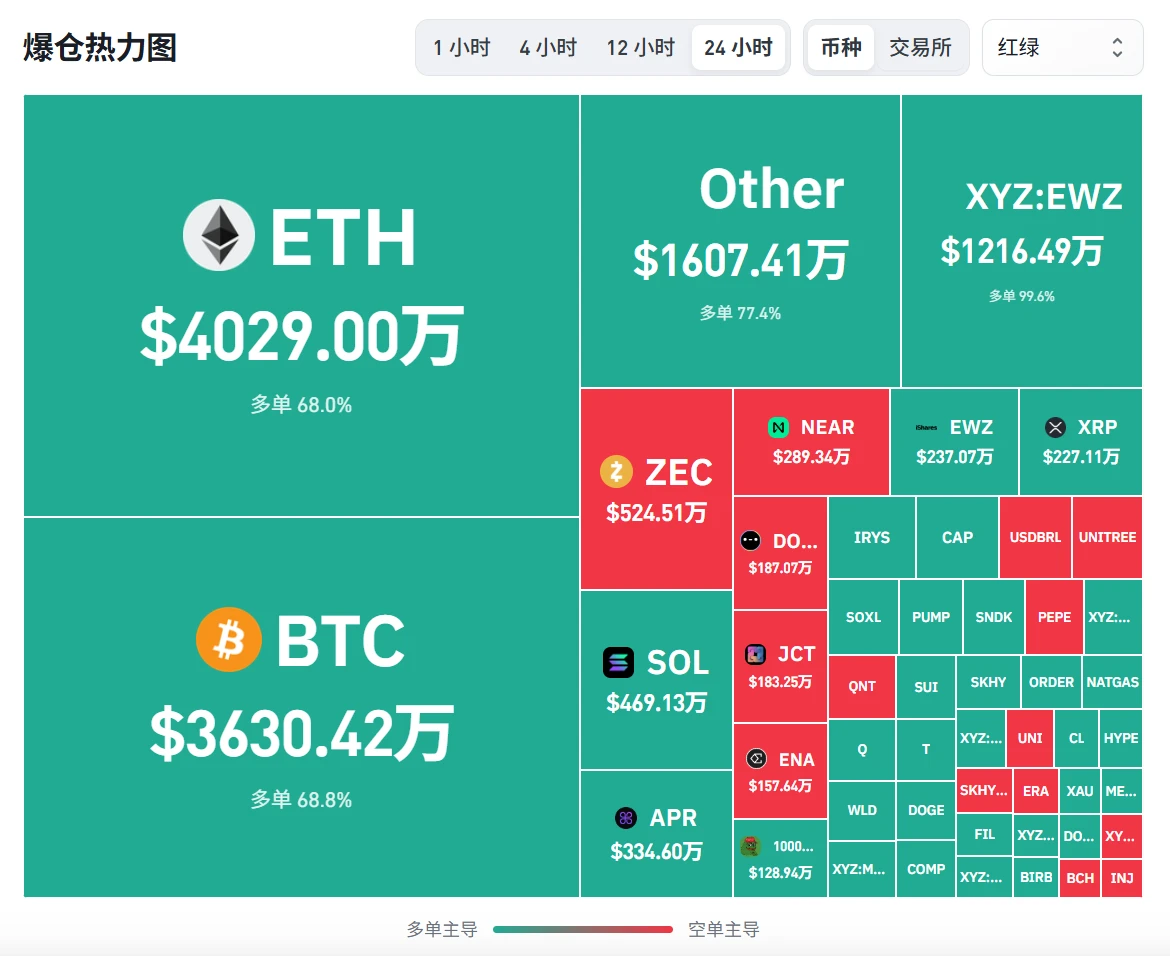
Total liquidations over 24 hours surpassed $1 billion. Highly leveraged long and short positions were swept away one after another! It has been almost exactly one year since last year's epic liquidation. Will history repeat itself, or is the market preparing for a reversal? Over the past 24 hours, total liquidations across the crypto market have exceeded $1 billion. BTC led the decline, putting broad pressure on major coins, while a large number of highly leveraged positions were forced out amid sharp volatility. Even m
post-image
ZEC-6.72%
#浇朋友 #蓝v互关
The current employment environment~
I found a job in Chengdu with a monthly salary of 6000
Working hours are from 9 a.m. to 9 p.m. (with a three-hour break in between)—alternating one- and two-day weekends
The company provides afternoon tea, snacks, tea, coffee, and... every day
Most importantly, they provide cigarettes!!!
post-image
EIGEN held support after a sharp drop and shakeout, and is gearing up for a relief rally! Go long on this move on $EIGE .
Entry: 0.2177 - 0.2211Take-profit range: 0.2290 - 0.237Stop-loss: 0.2105Please be cautious: The countertrend rebound may be affected by the continuation of the dominant 1-hour downtrend. Don't go all-in, guys. Set your position size according to your own account situation. The long strategy is as follows. 👇👇👇 is also watching $SO and $JCT .
post-image
JCT+54.71%
For long positions, consider taking full profit at higher levels. Ethereum’s structure looks off; I’ll update the risk controls later.
ETH-3.05%
10.9$BTC Silk Road
Market Analysis
After falling to a low of 80393.56, the market stabilized and rebounded, forming a bottom-recovery structure. The current price is above the middle Bollinger Band, while the Bollinger Bands are gradually narrowing; the MACD DIF has crossed above DEA, forming a golden cross, and the red bars continue to expand, with bullish momentum gradually being released. The short-term trend is showing a strong bias amid volatility, with resistance at 82776.01 and support at 80393.
Strategy (Long)
✅Long rationale: The price has completed a bottoming process, with suppor
post-image
BTC-0.75%
☀️ GM. Buckle up. 🎢
Markets can shift fast. Is your trading plan ready?
📌 Today's topic: What's your safety belt in a volatile market?
🛡️ How are you managing your positions?
👀 What risk signals are you watching?
📝 Any recent trades worth reviewing?
Chasing opportunities matters. Managing risk matters just as much.
Share your strategy or trade recap on Gate Square. Quality posts may get featured and receive extra exposure.
👇 Share your take:
https://www.gate.com/post
post-image
  • 7
  • 3
BTC and Ethereum market surges predictions
live-cover
LIVE2,151
$LYN Whale addresses continue accumulating, and holding concentration hits a new high! Retail FOMO sentiment is heating up—how far can this move go?#Gate.io 🔥 #每周来晒
10.9 BTC Market Analysis
Long: around 80000-80600, stop-loss at 79300, targets 82500/83500.
BTC is currently at 81920. It hit a low of 80359 last night and has now bounced back above 81900, rebounding 1500 points. 80359 has held for now. After plunging over 6000 points from 86643, the first decent rebound has only appeared here.
This decline was too smooth, with little resistance along the way, indicating that leverage was driving the move downward. The rebound is now underway, but its strength is not particularly strong. 82489 above is the EMA resistance level; only a break above it would cou
post-image
BTC-0.75%
A few days ago, the hand that set the stop-loss trembled slightly; this morning, I realized that was unnecessary filial piety. A few days ago, I looked at $ZCAT before bed. The pullback held firm and buying pressure strengthened, so my long-entry idea was simple: hold as long as it doesn’t break; leave if it does.
The repeated intraday swings were the real test. Many people got shaken out, but I didn’t move because the structure was still intact, and so was the momentum. It was truly sluggish at first, but the breakout feels great.
Entered at 0.03917, reached 0.0485, and +242.24% in gains secu
post-image
ZCAT-3.42%
LAB-1.34%
BNB-4.01%
Multi-Market Trading Challenge Phase 4: Advance Across Four Tracks and Earn Up to 95 USDT https://www.gate.com/campaigns/6436?ref=VLARBF1YAG&ref_type=132&utm_cmp=2I73WcnM
post-image
  • 1
This cycle, the market’s main focus is whether the 80,000 level can be broken. The market sees some possibility of breaking below 80,000, but the probability of continuing lower to 78,000 or 76,000 is significantly reduced.
Once extreme market conditions trigger a sharp decline, the risk-reward at lower levels becomes highly attractive; overall expectations are that there is a short-term risk of testing 80,000, but the market does not anticipate a sustained one-way plunge, with range-bound trading remaining the primary strategy.
post-image
A technical analysis and a potential trade plan of $SPCX ‌
Chart Analysis
1. The 1-Hour Chart (Macro View )
· Trend: The overall trend on the 1H chart is bearish. The price recently suffered a sharp drop from ~170.57 down to a low of 155.69.
· Current State: The price is currently in a corrective bounce (retracement) after that steep drop. It is trading around 160.16.
· Moving Averages: The price is currently testing the MA5 (159.82) and MA10 (158.91) and has pushed above them, but it remains below the MA30 (160.63), which acts as immediate dynamic resistance.
· MACD: The MACD histogram is be
SPCX-4.18%
BTc market
live-cover
LIVE1,095
Yesterday’s sharp dump in BTC and ETH probably left quite a few people tossing and turning at night.
You had planned to hold on and wait for a rebound, but the drop came much harder than expected.
BTC briefly fell to the 80,000 level, while ETH also reached the 2,400 level.
With positions stuck in the middle, it was hard to know what to do; the more you watched the charts, the more anxious you became.
$BTC $ETH
Many people are puzzled: with so many bearish factors piling up this round, why did BTC fall so little?
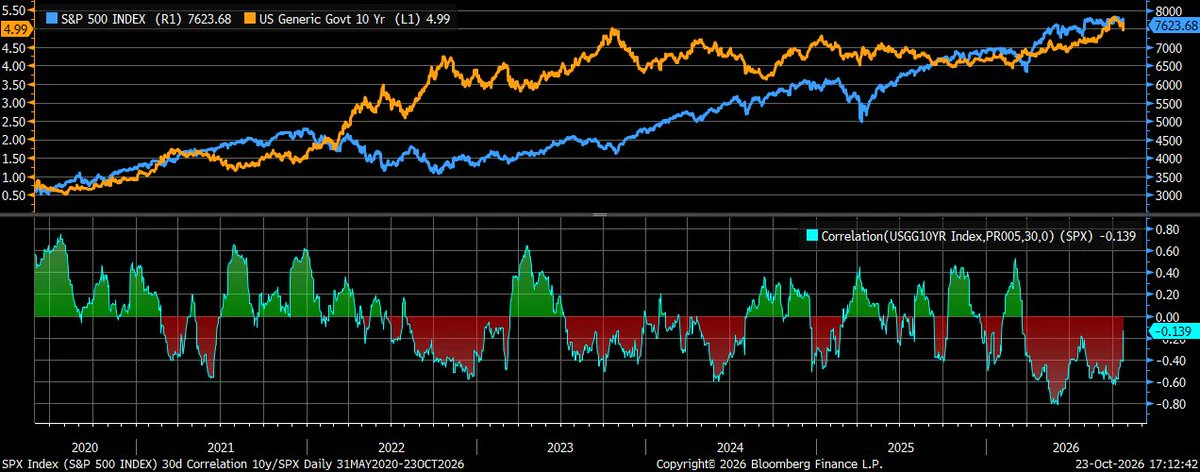
The root cause is that macro-level pressure is fully stretched: 10-year U.S. Tre
post-image
BTC-0.75%
ETH-3.09%
I only wanted to mooch a breakfast, but the market ended up trapping me for half a year. A few days ago, I stayed up before dawn watching $AKE surge to the highs. Volume failed to follow, and every push higher fell just short. I called it bullish at the time, but with clear resistance overhead—don't chase.

The market is waited out, and profits are held onto.

Shorting from 0.0284075 all the way down to 0.0270009, +117.87% says it all. That was a satisfying bite of profit. Those already in the trade should be waking up smiling. It was truly sluggish earlier, but the result is truly sweet. T
post-image
AKE-0.71%
ZEC-6.68%
LAB-1.34%
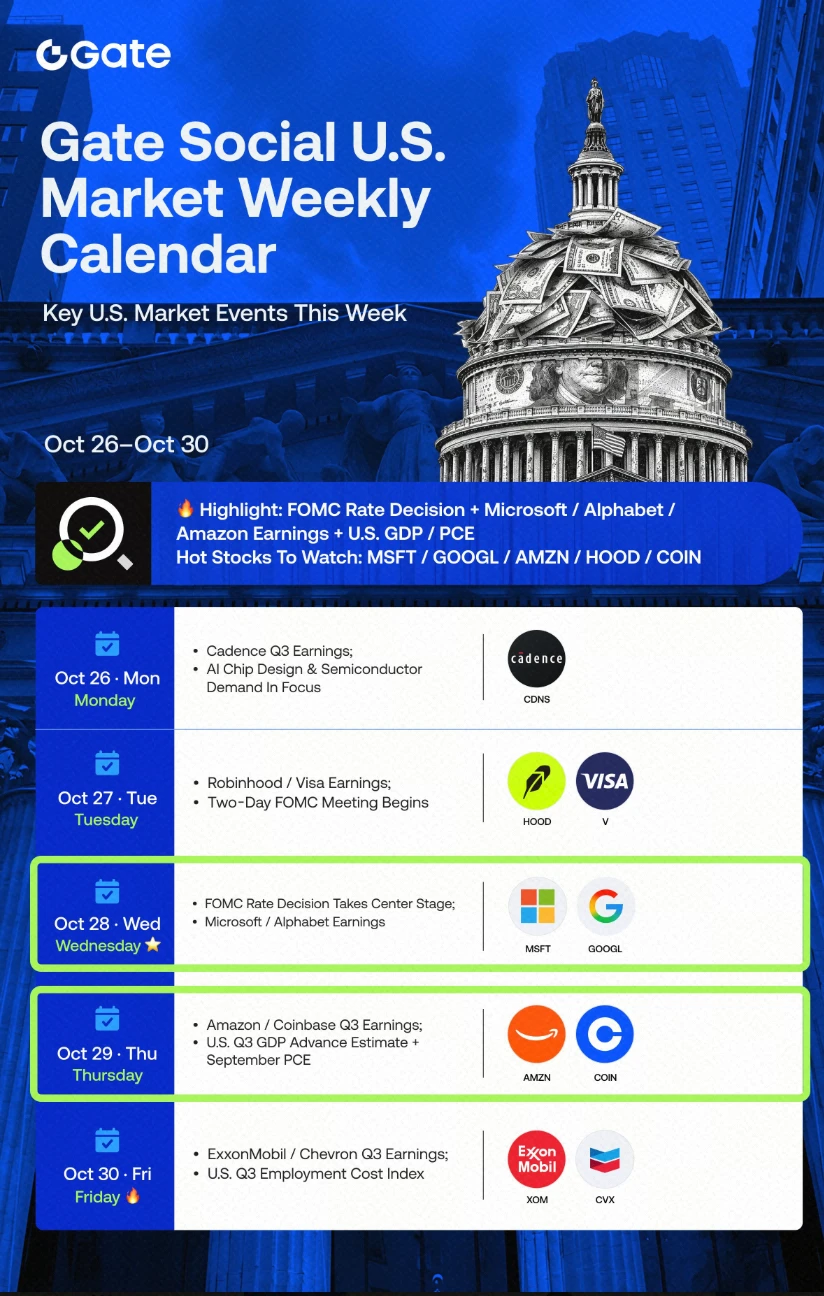
$HOOD Based on the 4-hour (4H) technical chart for Robinhood (HOOD) shown in the image, here are the key support levels where the stock has the potential to bounce:
1. Nearest Support Level (102.01)
Price Level: 102.01 
Analysis: Indicated by the yellow horizontal line, this level represents a previous swing low. With the current price around 107.04, 102.01 serves as the first line of defense if the current pullback continues. 
2. Major Ascending Trendline Support (Green Line)
Price Level: Approximately 100.00 – 102.00 
Analysis: The green upward trendline intersecting near the 102.01 s
post-image
HOOD-2.29%
Load More

Join 40 M users in our growing community

⚡️ Join 40 M users in the crypto craze discussion

💬 Engage with your favorite top creators

👍 See what interests you

Trending Topics

Gate Money Officially Launches

3.49k Views12.91k Discussing

Gate officially launches Gate Money, a global integrated financial services app that brings digital assets, fiat, stocks, ETFs, gold, bank accounts, and payments into one Gate App. Users can manage assets, invest, send and receive funds, convert currencies, and make payments — all from a single account. Which use case are you most excited about? [👉 Learn more](https://www.gate.com/announcements/article/102094)

BTC Pulls Back to 81000

25.4k Views35.65k Discussing

AIStocksFallALABDropsOver9%

24.57k Views543 Discussing

View More