Share your thoughts
placeholder
Article
#日股地产电力半导体板块走强 Japanese stocks are showing an interesting split after the latest BOJ decision.
The Nikkei 225 closed at 65,018.95, up 1.38%, after the Bank of Japan raised its policy rate by 25 basis points to 1.25%, the highest level in 31 years. What makes this move interesting is that the market reaction was not uniformly defensive. The yen weakened beyond 157 per dollar, while Japanese equities moved higher. The BOJ decision was also divided 7–2, which helped the market interpret the move as less aggressive than a straightforward tightening signal.
Looking underneath the index, three group
post-image
JPN225+0.23%
USDJPY+0.58%
#JapanRealEstatePowerChipStocksRise
Japan’s equity market is seeing renewed attention across two distinct areas: real estate and semiconductor-related companies. Recent land-price data showed Japanese land prices increased 1.5% in the year through July 1, marking the fifth consecutive annual increase. Prices across the Tokyo, Osaka and Nagoya metropolitan areas rose 4.4% on average.
The property-market trend has also been reflected in listed real-estate companies. Recent market reporting showed gains across several major Japanese developers following the land-price data, with investors monito
The market doesn’t explain itself; it just moves. Your job is simply not to make reckless moves.

When it plunged intraday, $BEAT selling was strong, volume was also low, and the overhead pressure was crushing. After I turned bullish, I warned: resistance at the highs—don’t chase shorts; wait for a rebound.

From 0.4692 to 0.0863, +1606.41%—a huge profit secured. The earlier wait was worth it. Feels really great; time to treat myself to a good meal.

The prerequisite for compounding is staying alive; the shortcut to getting rich overnight is often going to zero.
Have a strategy before the
post-image
BEAT+0.46%
ADA-1.04%
DOGE-1.87%
US and China are having trade talks in New York before Xi visits the US.
post-image
SOL Technical Outlook: Solana Reclaims $110 as Recovery Structure Strengthens
SOL is currently trading around $110.1, holding above the $106–$109 region after the recent recovery from the $92–$100 support area.
The broader structure has improved, with price reclaiming the $100 area and moving back toward the major $111–$114 resistance zone. A sustained move through this area would put the higher Fibonacci levels back into focus.
📈 EMA Structure
20 EMA: $102.68
50 EMA: $95.19
100 EMA: $89.54
200 EMA: $92.61
SOL is currently trading well above the 20 EMA at $102.68.
The recovery above the 50 EM
SOL-0.82%
  • 1
$AVA LONG SETUP | 1H
Directional setup aligned with the current bullish bias.Entry zone: 0.2372–0.239Stop loss: 0.2341Targets: TP1 0.2531 (3.75R) / TP2 0.275 (9.22R) / TP3 0.324 (21.47R)Scale out: 50% / 30% / 20%Considerations: price is away from the planned entry and may require a retest; estimated EV is -0.07R, below the active threshold.Status: Watchlist only — wait for confirmation before considering the setup.
post-image
AVA+8.51%
$ENA ENA is very strong. It is expected to touch $0.25 soon! Buy high, sell low! Set up a long.
Entry: 0.21 - 0.22Take profit: 0.225 - 0.235 - 0.25 - 0.27 - 0.3Stop loss: 0.198
post-image
ENA+5.17%
$ETH
Another profitable week concluding.
Next week is simple, and all eyes on #Ethereum
Successful retest will see us head to $3000+
Failed retest will see us sweep prior lows before $3000
post-image
ETH-0.13%
$SAGA The long setup looks ready; then make money with professormike...!!! It will bring us $SUI
in profits. Entry 0.03650 & 0.03700, stop-loss 0.03255, take-profit 0.04000–0.04500–0.04979, long $SAGA 👇SOLJumpsAbout10%
post-image
SAGA+56.25%
SUI+1.01%
$SAGA Signal】1H breakout continuation, buying pressure continues to lift the price
$SAGA 1H RSI 86.31, order book depth ratio 0.65, with sparse sell orders above. The 4H MACD histogram continues to expand, while the Bollinger upper band at 0.0352 remains above the current price.
The bulls' offensive momentum remains intact, with 9.1 billion in volume building progressively and both the 1H/4H timeframes moving upward in sync.
🎯Direction: Long
⚡Entry/limit orders: 0.0364403 - 0.0365500
🛑Stop-loss: 0.0347225
🚀Target 1: 0.0392912
🚀Target 2: 0.0406619
🛡️Trade management:
- Execution strategy:
post-image
SAGA+55.78%
MARKET OVERVIEW
live-cover
LIVE62
$BTC has nearly 2x more liquidations below than above
$4,200,000,000 in short liquidations above
$8,000,000,000 in long liquidations below
#BTCRetakes80K #GateSquareMidAutumnReunion #ShareWeekly
post-image
BTC-0.33%
  • 5
$CELR Signal】1H pullback support + negative funding rate squeeze, 4H bullish structure remains intact
$CELR Funding rate -0.8501%, short holding costs continue to bleed. 4H MACD histogram at 0.0001, red bars narrowing but remaining above the zero line; 1H MACD histogram at -0.0001, red bars expanding. 1H RSI 47.36, 4H RSI 69.13. Order book depth imbalance -7.21%, buy/sell ratio 0.87.
The 0.003457 low was quickly reclaimed, with dense bids below 0.00355. The 24-hour range compressed from 0.00523 to 0.003457, while volume declined to 1.43 billion.
🎯Direction: Long
⚡Entry/Limit orders: 0.003580
post-image
CELR+20.50%
BTC-0.32%
ETH-0.13%
SOL-0.82%
Why is everyone ignoring the obvious short setup on SYMBOL right now?

$NEAR /USDT - SHORT

Trade Plan:
Entry: 4.0300 – 4.0982
SL: 4.4900
TP1: 3.7447
TP2: 3.5317
TP3: 3.2123

Why this setup?
Why now? The daily trend is bullish, yet the 1h price sits at 4.0641 inside a narrow entry zone between 4.0300 and 4.0982, signaling exhaustion. The 15m RSI at 60.87 shows neither overbought nor oversold, implying the next move could be explosive in either direction. The 1h ATR of 0.136506 confirms enough volatility to reach TP1 at 3.7447 and extend toward TP2 at 3.5317 if momentum shifts. With confiden
NEAR+15.83%
🌕
🚀
🔥
🔥
🔥
☁️🔥☁️
☁️☁️ #Altseason2026 ☁️☁️
☁️☁️☁️ #NEXT #1000x ☁️☁️☁️
Which #Crypto coin should I Invest in #___ 👇
post-image
Financial News, Crypto Market Updates, Real-World Strategies
live-cover
LIVE1,061
  • 1
buy 🔥🔥🔛🔛👇🏼👇🏼
post-image
CryptoSelf
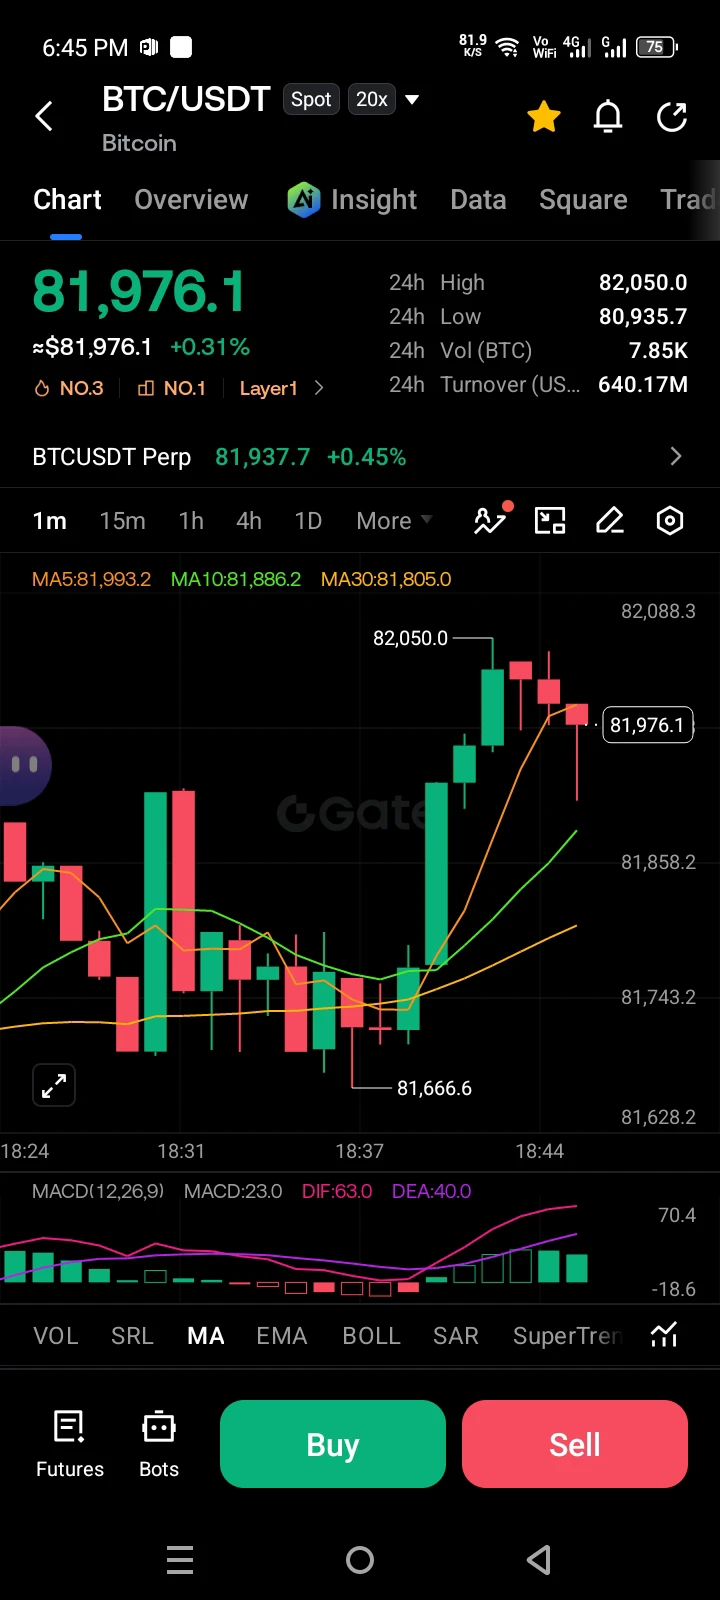
☀️ GM! Ding—BTC has reached the 81K level. 🛗
$80K Regaining its footing, will the market continue upward?
👇 What level do you see as the next stop?
🔥 Today's recommended topic: #BTC重回80K
Go to Gate Square to post and share your take:
📈 Continue breaking out, or trade sideways at the highs?
🎯 What level do you see as the next target?
💡 Which signals are worth watching closely?
Quality insights may receive featured recommendations + Square traffic support
💬 Go to Gate Square to post:
https://www.gate.com/post.
Dear traders, $SEI shows strong buying pressure after reclaiming the $0.050 area with a strong 4H candle.
A long-term position has been initiated near the current area, with the next target pointing toward the $0.055 area. Entry: $0.0508–$0.0515TP1: $0.0525TP2: $0.0540TP3: $0.0555Stop-loss: $0.0490$ZE
AKE.
post-image
SEI+3.95%
AKE-1.00%
Alright, let’s see what’s cooking on $SHIB 🧐
Looking at the $SHIB 1H chart, my short.term bias is currently bullish, and that view is also supported by the daily structure.
However, there’s an important caveat: this still looks like a counter-trend bounce inside a bearish weekly structure, while BTC is also showing sell-side pressure. So I’m not interested in blindly chasing the move.
For me, the cleaner setup would be a liquidity sweep followed by confirmation on the lower timeframe.
The area I’m watching first is 0.00000551–0.00000557. If price can reclaim and hold above that zone with imp
SHIB-1.47%
  • 4
  • 2
$MINA MINA/USDT (4h) Testing a Cup and Handle Breakout
MINA/USDT is forming a large cup and handle pattern on the 4H chart, with price completing the rounded recovery from the $0.078–$0.080 area and forming a smaller pullback on the right side as the handle.
Price is now testing the neckline resistance around $0.118–$0.120. A confirmed breakout and hold above this level could validate the bullish continuation structure and open the way toward the $0.165–$0.168 measured target area.
A rejection from the neckline would keep the pattern unconfirmed and could lead to another pullback into the hand
post-image
MINA+9.41%
Load More

Join 40 M users in our growing community

⚡️ Join 40 M users in the crypto craze discussion

💬 Engage with your favorite top creators

👍 See what interests you

Trending Topics

MSTRTopsNasdaq100

74.29k Views3.04k Discussing

Strategy (MSTR) has gained about 48% over the past month, making it the best-performing stock in the Nasdaq 100, while Bitcoin rose roughly 12% over the same period. The company holds 845,050 BTC with a cumulative cost basis of about $63.73B. MSTR is not a pure Bitcoin proxy — its price swings can be more extreme. Can this rally last?

Gate Tops 24H Net Inflows Among Exchanges

26.53k Views3.69k Discussing

BTCRetakes80K

57.39k Views60.73k Discussing

View More