Share your thoughts
placeholder
Article
A few days ago, I was still calculating whether I had enough money for instant noodles this month; this morning, I was already wondering whether to add sausage.

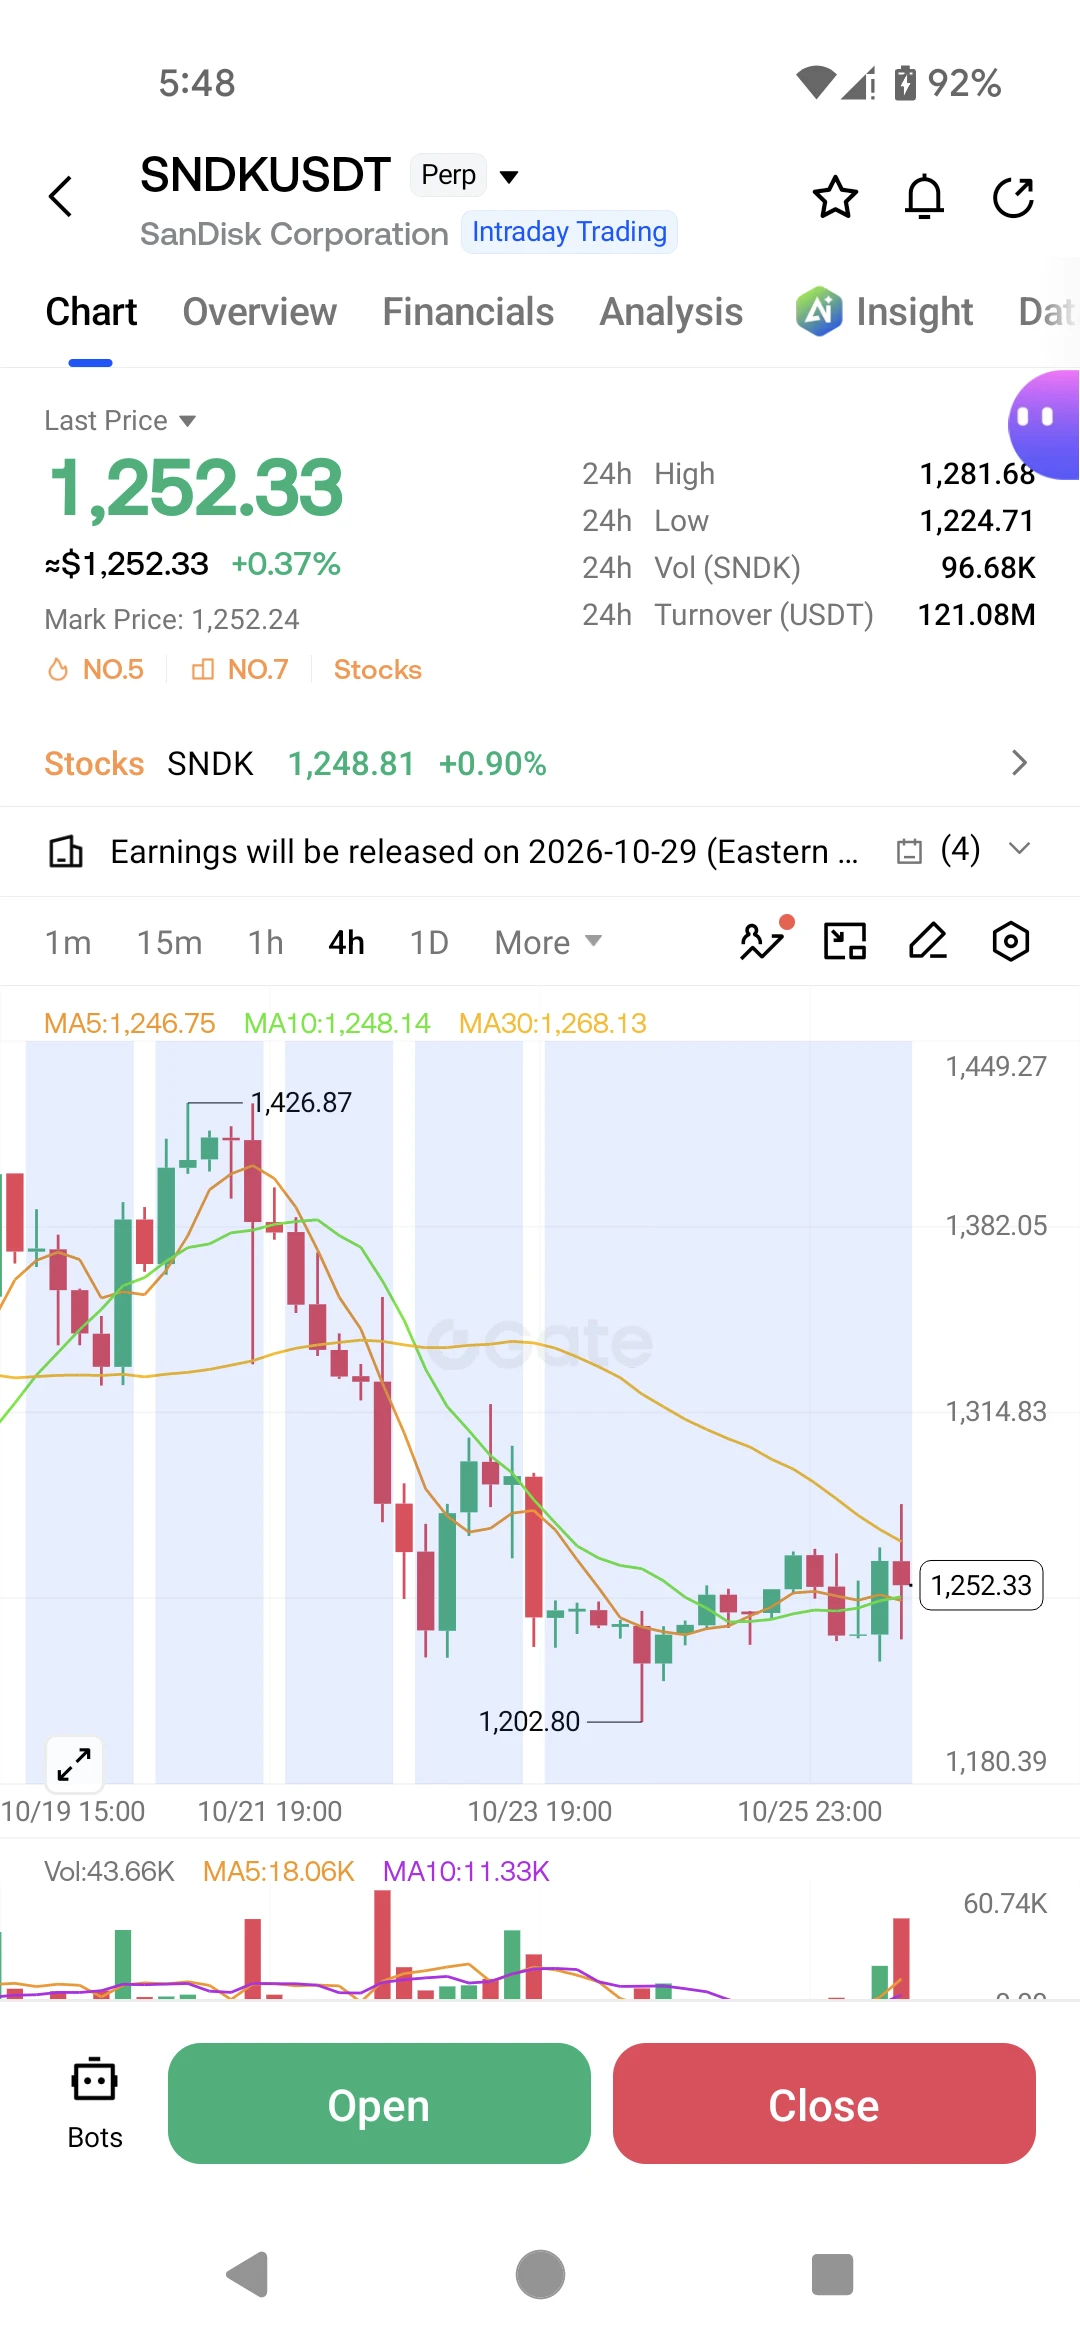
A few days ago, $MU pulled back to 946.09. Many people ran at the sight of the green bars, but buying clearly strengthened at that level, so I saw it as an opportunity and went long. I had just one thought at the time: don’t mess around—hold on first.

When I opened the chart again today, the price had already climbed to 973.84, securing +208.56%. Looking back at the whole trade, there’s just one takeaway: assets that hold firm aft
post-image
MU-1.42%
ADA+3.62%
ETH+3.22%
$BTC Signal】1H volume exhaustion + 4H bearish alignment
$BTC The 1H is climbing in a narrow range, with volume of only 233 in the past hour. Price is holding just above the 1H EMA20 at 77312, while the 4H EMA20 at 77638 has yet to be reclaimed.
The 4H Bollinger middle band at 77681 is suppressing price, while the lower band at 76192 remains open. The 1H MACD histogram is positive at 15.04 and expanding, confirming a volume-price divergence. The bid-ask ratio is 0.63, with depth imbalance tilted by 4.54%. Buy orders are pushing the price higher, but limit orders are thin, and signs of distribu
post-image
BTC+0.47%
$ETH FI Up 23% in a day, ETHFI surged from 0.61 to 0.769, with trading volume exploding to $107 million. This kind of volume couldn’t have come from retail investors; it clearly shows funds scrambling to build positions. There wasn’t any major macro news today, but the Nasdaq edged down last night, U.S. Treasury yields are still holding above 4.3%, and Bitcoin is moving sideways around $96,000—ETHFI’s ability to rally so sharply against the trend can only be explained one way: market funds are looking for high-beta catch-up plays, and the LSD sector has rotated into it. The low at 0.61 precisel
ETHFI+26.09%
NAS100+0.86%
BTC+0.52%
ETH+3.35%
$PI From one hand to another without banks, without borders, without intermediaries. Purely onchain.
On September 15, U.S. time, several major events will take place simultaneously.
Soon, purple will sweep across the world.
PI+1.19%
#AugustCoreCPIBeatsExpectations
NVDA/USDT Analysis: A Short-Term Rebound Setup with a Heavy Macro Backdrop
The daily chart for NVDA/USDT shows a sharp pullback to a key support zone after a rejection from the recent high. While the immediate technical picture is oversold, the setup is heavily influenced by two major events on the macro calendar next week: the FOMC meeting and the CLARITY Act vote.
📊 Current Market Snapshot
· Price: ~$219.4
· 24h Range: $218.4 (Low) – $222.2 (High)
🛡️ Long Setup (Risky but Technically Justified)
The price is testing the lower boundary of the recent consolida
NVDA-0.11%
  • 3
I wasn’t even expecting to break even, but it took me straight into profit. This service is seriously on point. $ZEC This haul is enough for me to add several dishes.

While everyone else was running, I kept my eyes on ZEC and held on. It moved sideways at the bottom without breaking down, with buying support consistently holding up. The moment it stabilized after the pullback, I told you it was time to go long.

Now the data speaks for itself: entered at 857.01, currently at 1149.11, with a +2420.8% return. All the suffering beforehand was worth it.

Take profits when it’s time: sell 80% f
post-image
ZEC+4.97%
BNB+3.43%
XRP+3.46%
🚨 ETH 1H: Bulls Defend $2,431 as Price Pushes Back Toward $2,600
$ETH is showing renewed strength on the 1-hour chart, currently trading around $2,537.77 after bouncing from the key $2,431.56 support area. The recent price action shows strong recovery momentum, although volatility remains elevated after a sharp spike and rejection near the upper range.
🟢 Support Levels:
$2,431.56 — Key immediate support and important breakout/retest zone
$2,400–$2,360 — Major lower support area based on previous swing lows
$2,362.07
$2,360.77
🔴 Resistance Levels:
$2,544.57 — Immediate local resistance
$2,5
post-image
ETH+3.22%
You want $C long zone. I deliver
Simply add spot here for a relaxed journey. Low leverage to add a bit of spice to the journey.
post-image
$UNI Signal】1H holds firmly above both moving averages, 4H momentum continues
$UNI The 1H MACD histogram is contracting, while the 4H histogram is expanding in tandem. The current price of 6.346 is hugging the 1H Bollinger upper band at 6.4310, with the EMA20 and EMA50 overlapping around 6.21 below. The order book depth ratio is 0.99, and the funding rate is 0.0050%, making long leverage costs extremely low. The 4H buy_sell_ratio has slipped to 0.46, and short-term selling pressure needs time to be absorbed.
🎯Direction: Long
⚡Entry/Limit Order: 6.32696 - 6.34600
🛑Stop-loss: 6.28254
🚀Target
post-image
UNI+8.59%
BTC+0.52%
ETH+3.35%
SOL+2.98%
I know you haven’t dared to make a move these past few days—not because you’re bearish, but because you’re worried about that event next week.
The interest-rate market has pushed the rate-hike probability to 86%, and almost everyone is waiting for that thunderclap on Wednesday. But when Shuqin’s position rebounded yesterday, she had her followers take profit on all their longs, then opened a small short.
She has just one rule: sell and take a small short near resistance, and admit defeat only if it breaks through; buy the dip at support, and get out if it breaks down. She entered SOL (Solana)
post-image
SOL+2.98%
BTC+0.52%
Michael Saylor will always say, “Just buy Bitcoin.”
But the weekly chart currently shows hidden bearish divergence, the Perfect Storm Index™ is in extreme-risk territory, and Elliott Wave suggests another decline may be needed to complete the cycle.
Long-term conviction should not mean ignoring short-term risk.
post-image
BTC+0.52%
Will today's green turn red? Good luck.
post-image
Everyone is buying the dip, but ADA is about to prove them wrong

$ADA /USDT - SHORT

Trade Plan:
Entry: 0.2079 – 0.2091
SL: 0.2139
TP1: 0.2044
TP2: 0.2017
TP3: 0.1976

Why this setup?
Why now? The daily trend is range-bound, which means the price is coiling for a directional break, and the 1h ATR of 0.002269 shows volatility is ready to expand. The 15m RSI at 54.4 is neutral, suggesting the recent dip to the 1h price of 0.2085 is a pause, not a reversal. The entry zone between 0.2079 and 0.2091 aligns perfectly with the short bias, targeting TP1 at 0.2044 and a deeper move to TP2 at 0.2017
ADA+3.62%
#GateTop4MainstreamCEX
Gate’s Rise to the Global Top 4: More Than Just Trading Volume
Gate’s position as the 4th-largest mainstream centralized crypto exchange globally in August 2026 is, in my opinion, more than a ranking headline. It reflects how rapidly the exchange has been expanding across spot trading, derivatives, Real-World Assets, yield products, and TradFi-related infrastructure.
With approximately $40 billion in spot trading volume and an impressive $285 billion in futures trading volume during August, Gate is demonstrating strong activity across both traditional crypto markets and
RWA+2.88%
BTC+0.52%
  • 4
  • 3
The final chance to escape? Bitcoin was poised for a rebound but got firmly pushed back down! Is the situation starting to deteriorate?
1. First, BTC. Next week is going to be really scary. The market previously expected the Fed not to raise rates next week. But according to the latest interest-rate market data, the probability of a rate hike next week is as high as 86%! So here’s the question: Is a black swan really about to appear next week?
2. There is a potential turn of events! After all, this data only reflects market expectations; the actual result still depends on Warsh. Warsh was just
BTC+0.52%
SOL+2.98%
CRYPTO MARKET LATEST UPDATE
live-cover
LIVE1,480
$1000 to $100,000 Crypto Trade Challenge Today
live-cover
LIVE525
Everyone watching the daily range is missing a quiet short setup forming right now.

$ADA /USDT - SHORT

Trade Plan:
Entry: 0.2085 – 0.2097
SL: 0.2145
TP1: 0.2050
TP2: 0.2023
TP3: 0.1982

Why this setup?
Why now? The 1h price is sitting at 0.2091, which is the exact entry_ref and the upper boundary of the entry zone between 0.2085 and 0.2097, giving us a precise trigger. The daily trend is range, meaning the asset is coiling and a directional break is overdue, and the bias favors short. The 15m RSI at 60.33 shows the bounce is losing steam without yet being overbought, so momentum is quietl
post-image
ADA+3.62%
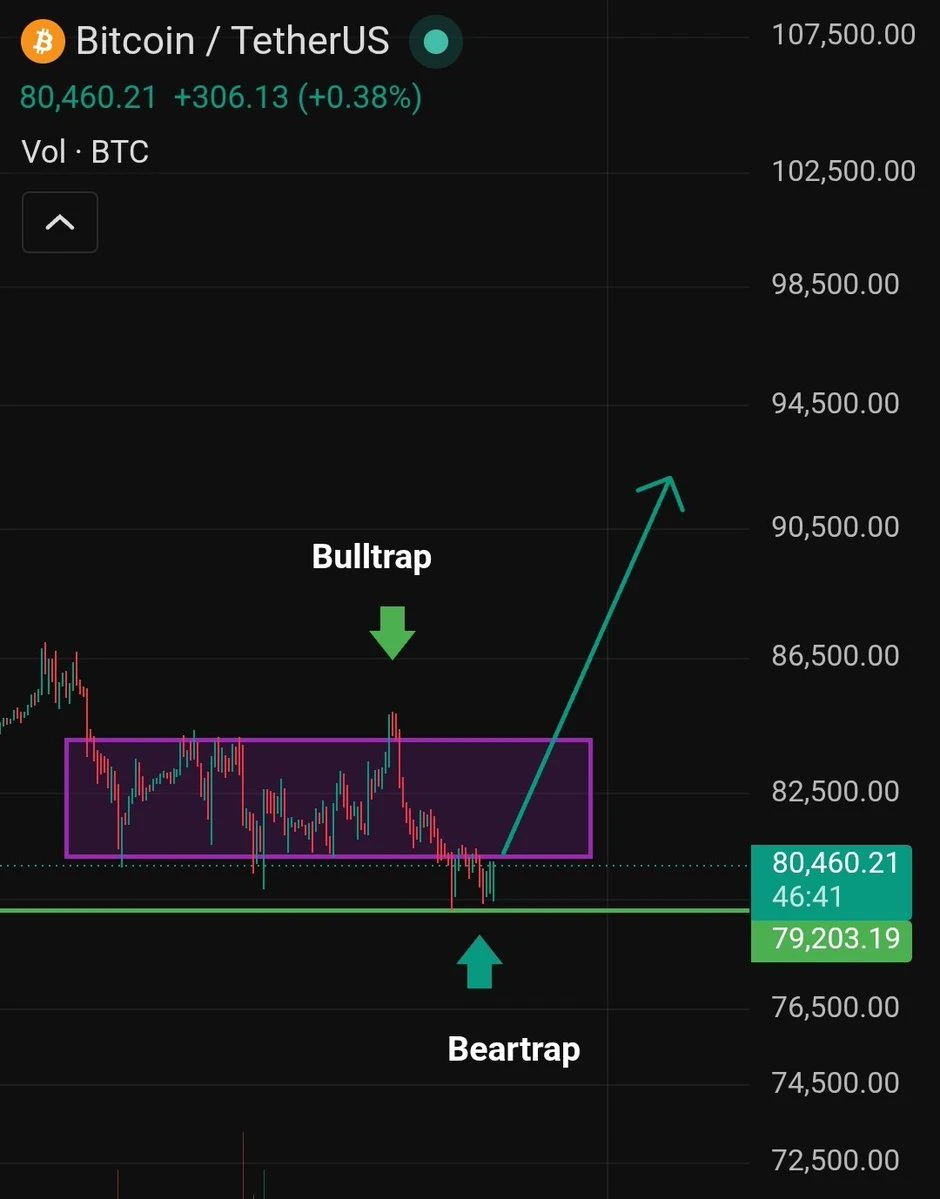
The voices in the market are always diverse!
Analysts believe that bitcoin:native rebounding to $80,000 does not mean anything; the trend is still headed toward $30,000 before finally making a run at $180,000.
For me, I have already entered the dollar-cost averaging range where I am most skilled and steadfast.
Since the ultimate direction is upward, strive to keep no positions in mind so that you can stick to your own strategy!
post-image
BTC+0.52%
#AugustCoreCPIBeatsExpectations
The latest U.S. inflation data has given the market another reason to stay alert.
August core CPI, which excludes food and energy prices, increased 0.3% month over month, beating the 0.2% increase economists had expected. On a yearly basis, core CPI rose 2.4%, easing from 2.5% in July.
At first glance, the annual number looks encouraging because core inflation continued to cool. But the monthly figure tells a different story.
A 0.3% monthly increase instead of the expected 0.2% shows that underlying price pressure remains stronger than markets were hoping for.
post-image
BTC+0.52%
GAS+3.01%
Load More

Join 40 M users in our growing community

⚡️ Join 40 M users in the crypto craze discussion

💬 Engage with your favorite top creators

👍 See what interests you