Square
Following
Hot
News
Notifications
Profile
Share your thoughts
placeholder
Article
$IDOL This rally looks like luck, but it was really an opportunity that had been lying in wait for a long time. The name is clever, and the price action delivered too, hitting 0.048 with pinpoint accuracy, like a tailor-made starting point. It surged +50.13%, leaving little time for anyone to hesitate.
$IDOL The contract tag is still there; the story has only just begun.
Risk warning: The above reflects personal views only and does not constitute investment advice. The crypto market is highly volatile, so please be sure to manage risk.
post-image
IDOL-6.71%
She doesn't know that I'm down 6 figures this month
post-image
Trenches
IDOL
I
bade
b
IDOL
0x3b...ab07
Market Cap
$.
Change
.
24h Vol
$.
Holders
.
PIEVERSE
P
bade
b
PIEVERSE
0x0e...25a9
Market Cap
$.
Change
.
24h Vol
$.
Holders
.
FIONA
F
bade
b
FIONA
B34n...pump
Market Cap
$.
Change
.
24h Vol
$.
Holders
.
Singularity
S
bade
b
Singularity
7R4M...pump
Market Cap
$.
Change
.
24h Vol
$
Holders
.
CLAUDIA
C
bade
b
CLAUDIA
2j5S...W2ZM
Market Cap
$.
Change
.
24h Vol
$.
Holders
.
#BTCBreaksBelow60K
Bitcoin Reclaims $60,000, But the Bigger Recovery Is Still Unconfirmed

Bitcoin is attempting to stabilize after one of its most aggressive recent selloffs. Following a sharp decline toward $55,150, BTC has recovered above $60,000 and is currently trading around $60,400. The rebound is encouraging, but it does not yet establish that the broader bearish trend has ended.

The market is showing two competing forces. Buyers are stepping in after the recent breakdown, while macroeconomic uncertainty, institutional outflows, and elevated liquidation activity continue to create pr
post-image
BTC-0.65%
  • 3
  • 1
At 5 a.m., this street healed me.
post-image
#NvidiaDropsNearly14Percent
NVIDIA's $115.8 Billion Earnings Beat Could Not Stop the Selloff: What Is Wall Street Really Pricing In?

NVIDIA has delivered another historic quarter, but its stock has entered a completely different battle. The company is generating extraordinary revenue, expanding its AI infrastructure business and preparing its next generation of computing platforms. Yet investors are selling aggressively, exposing a growing disconnect between corporate performance and financial-market expectations.

The latest trading session on November 20 brought a particularly sharp warnin
NVDA-13.84%
  • 2
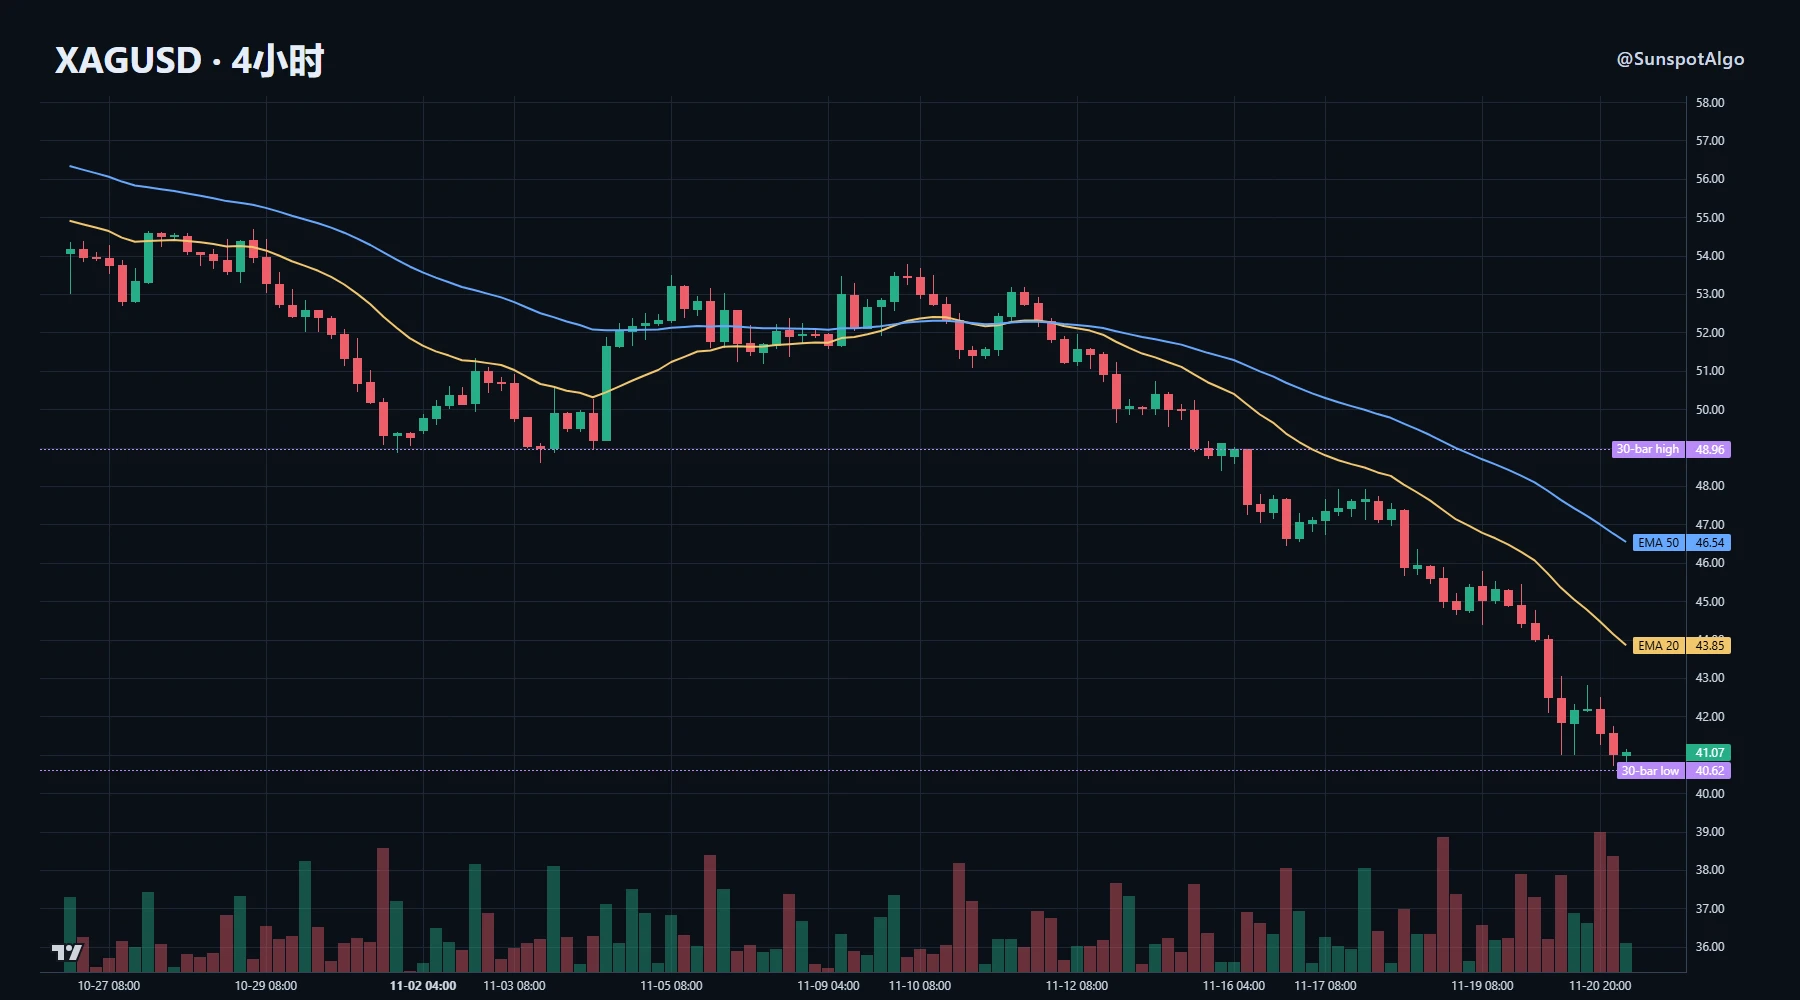
The rhythm of this silver sell-off is more noteworthy than its magnitude.

A roughly 16% drop over 5 days pushed silver to the bottom of its 30-day range at 40.9, while gold fell less than 10% over the same period. The chart’s rhythm has three notable details: the 4H 20-period moving average is at 43.9, while price is at 41.1, a deviation of over 6%; the volume ratio is 1.76, clearly indicating elevated volume; and ATR is at the 92nd percentile of the past 60 candles. The long lower wick around 40.6 was a classic stop-loss sweep: after breaking below that level, price failed to reclaim it, and
post-image
XAG+0.47%
XAU+0.38%
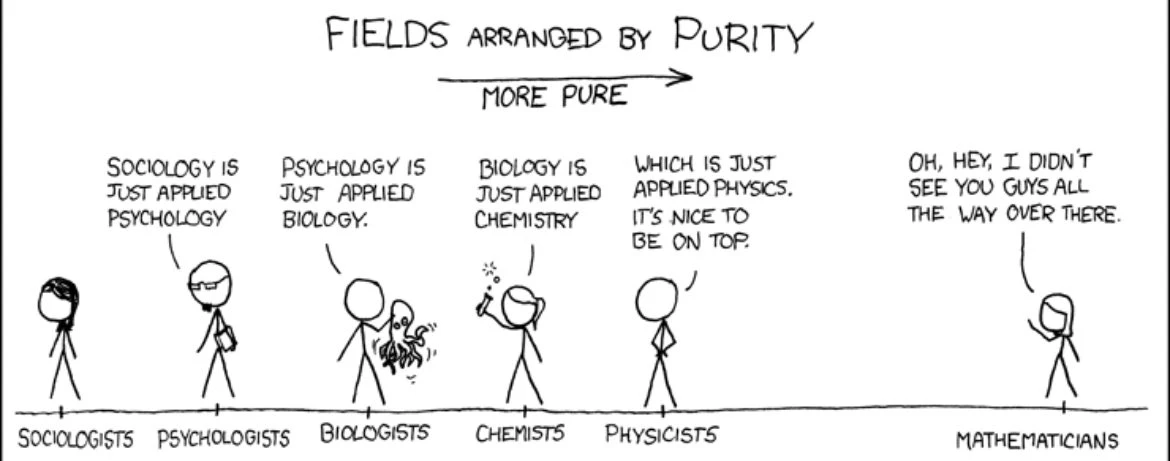
Mathematicians getting dropped a peg or two😂😂😂
post-image
XRP Technical Outlook: Bearish Pressure Continues as Price Tests $0.93 Support

XRP is trading around $0.9364 after another strong bearish move on the daily chart. Price has broken below the previous support structure and is trading beneath all four major EMAs. Sellers remain in control, while the $0.8619 area is now an important support zone to watch.

EMA Structure

XRP is trading below all major moving averages, confirming a bearish market structure.

- 20 EMA: $1.0502
- 50 EMA: $1.1777
- 100 EMA: $1.2374
- 200 EMA: $1.3108

The 20 EMA remains below the 50, 100, and 200 EMAs. This alignment
XRP-1.12%
BTW | Long 🟢 | Bullish | 15-minute 24-hour: +9.07% | Volume: 69.7M USDT Long rationale: Price is above EMA200; EMA20/50/200 are aligned bullishly; RSI14 is 71.3; MACD histogram is positive; ADX14 is 20.4; volume is 1.27 times the 20-candle average; trend pullback/continuation. Entry: 0.7219 Stop-loss: 0.667084 Take-profit 1: 0.79042 | Take-profit 2: 0.831532 | Take-profit 3: 0.886348 Entry levels are for reference only; do not chase the price. The strategy is invalidated if the stop-loss level is reached. Technical analysis only; not investment advice. $BTW
post-image
BTW-7.42%
🔹 BTC falls below 58,000 USDT, down 7.75 in 24 hours
live-cover
LIVE85
NVDA-13.84%
TSLA-7.56%
SPCX-7.38%
MU-13.88%
SNDK-15.99%
After weeks of a quiet, gradual erosion, the price of gold appears to have suddenly plunged off a cliff. A look at the charts reveals that the price has retreated to the $3,500 level, marking a weekly decline of approximately 9%—its worst performance in 34 weeks. Moreover, this drop is merely the latest chapter in a massive, roughly 37% meltdown that gold has experienced since reaching a historic peak of over $5,500 in January.

So, why has this "safe haven"—a place we typically turn to during times of chaos—let us down now? The answer lies in a much larger and more ruthless struggle currently
GVZ+2.87%
XAUT+0.30%
PAXG+0.37%
XAU+0.38%
XAUUSD-2.40%
  • 11
  • 3
Open a short position on $SUI . Trade setup: Entry 0.6459 - 0.6491, targets 0.6160 and 0.591, stop loss 0.6686. SUI failed to reclaim local moving-average resistance; price is expected to quickly move lower and retest support below. Note: A strong 1-hour rebound trend could invalidate this short if price reclaims 0.6500. Don't go all in, bro. Position size should suit your own account.
post-image
SUI-1.05%
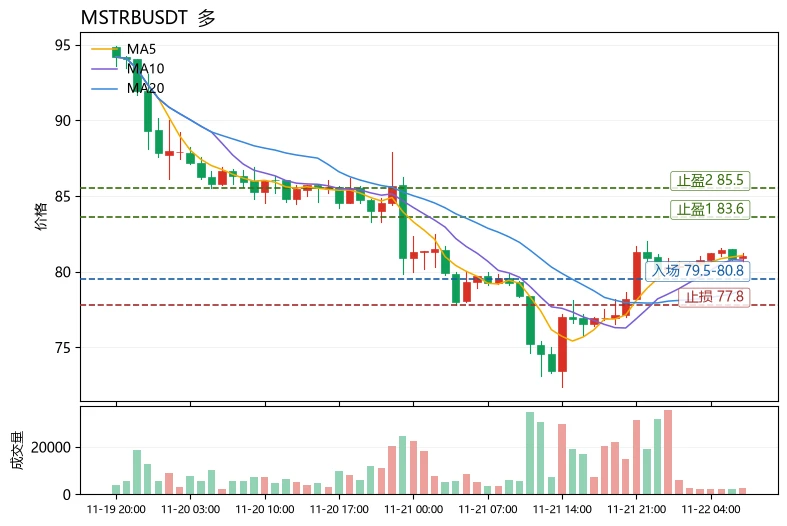
The most unusual detail in today’s market is that the Fear and Greed Index has plunged to 12, deep in the extreme fear zone, while MSTBUSDT bucked the trend and closed up 2.06%. MA5 (81.072) also held firmly above MA20 (78.83), and the MACD histogram remained bullish at +0.5023—a clear divergence between market panic and price structure. Among similarly active assets, $ENSO USDT$ENSOUSDT led with a 13.38% gain, but its MACD histogram showed a bearish signal at -0.001279, while its funding rate of -0.6305% indicates crowded longs and elevated risk of chasing the rally;
$PEPEUSDT fell 2.01% over
post-image
pepeusdt
pepeusdtUncle Pepe
Pump.Fun
MC:$2.33KHolders:1
0%
ENSO-3.03%
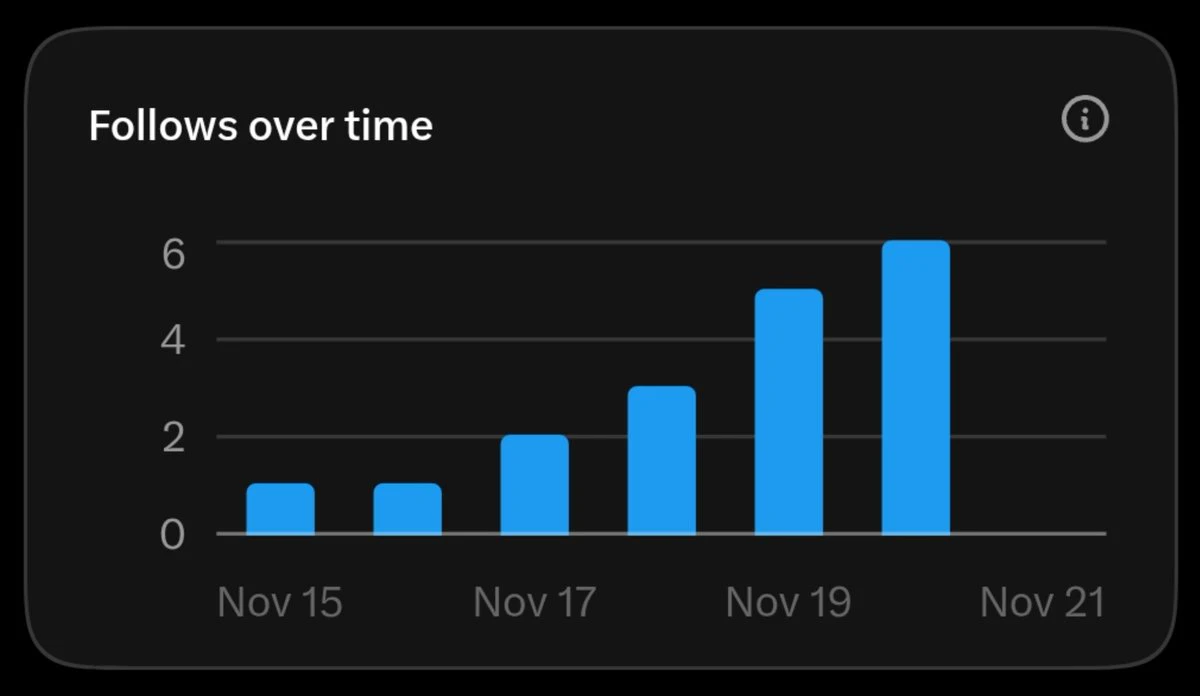
healthier than the xpl chart
post-image
XPL-0.60%
Russia is finally moving past years of indecision regarding cryptocurrencies by introducing concrete regulations. Under the new decision, domestic exchanges will be permitted to facilitate cryptocurrency transactions starting November 22, operating within a framework approved by the Central Bank. This represents more than just a regulatory update; it is a turning point that enables Russian investors to conduct transactions under the oversight of their own country, rather than relying on foreign platforms.

To begin operations, exchanges must first have their procedures approved by the Central
post-image
BTC-0.67%
GT-2.41%
ETH-1.26%
SOL-0.77%
WAVES-3.63%
Strategy stated that all 850,849 BTC in its treasury are unencumbered, meaning none are pledged as collateral for loans as Bitcoin slid toward $55,000 amid heavy market selling.
The 850,849 BTC was acquired at an average price of $75,452 (approximately $64.20 billion total cost), per Strategy's mid-November 2026 SEC filing disclosures.
MSTR shares have also faced pressure alongside Bitcoin and spot ETF outflows, with many analysts pointing to dilution from at-the-market equity issuance used to fund preferred stock (STRC) repurchases and dividends.
‍#ShareWeekly #BTC #BTCBreaksBelow60K
post-image
BTC-0.67%
MSTR-9.49%
STRC-0.90%
$DOGE Is Stronger Short-Term but Weak on the 4-Hour Chart—Which Will Turn First?
$DOGE is currently at 0.05517, up 1.174% over 24 hours, with an intraday range of 0.05077‑0.05569. The 1-hour chart looks relatively strong, with the price above EMA20 at 0.05475052. RSI14 is 78.74, nearing overbought territory, but the volume ratio is only 0.2, far below average, indicating limited participation from short-term buyers. A volume ratio of 0.2 means that trading volume over the past hour was only one-fifth of its recent average, making it difficult for buying pressure to persist. The 4-hour chart re
post-image
DOGE-0.22%
$VVV I’ve noticed that many coins not listed on the spot market are holding up well. Nearly all the spot-listed coins that rallied a lot this round have fallen more than 60%. This one isn’t listed on the spot market and is only down a little over 30% from its high.
post-image
VVV+0.37%
🔹 Fear Grips Global Markets as Wall Street Approaches a Critical Point
live-cover
LIVE2,357
BTC-0.67%
Load More

Join 40 M users in our growing community

⚡️ Join 40 M users in the crypto craze discussion

💬 Engage with your favorite top creators

👍 See what interests you

Trending Topics

BTCBreaksBelow60K

2.1M Views30K Discussing

BTC fell below $60,000 on November 20 for the first time since July, alongside a tech stock selloff and broader pressure on risk assets. Will $60K become resistance, or can BTC quickly reclaim it? What price or volume signals would convince you that selling pressure is easing?

GateDirectIPOPhase3ANTAllocates92100Shares

797.2K Views4.9K Discussing

NvidiaDropsNearly14Percent

333.9K Views7.6K Discussing

View More