Square
Following
Hot
News
Notifications
Profile
Share your thoughts
placeholder
Article
BTC | ETH | Gold | Crude Oil
live-cover
LIVE3,344
☀️ GM! Stocks are bouncing. BTC is still waiting. ☕
Nasdaq +2.74% last session, while BTC remains under pressure. US CPI drops at 8:30 AM ET. 👀

📌 Today's topic: CPI — hot or cool?
🔥 Hot: More pressure on BTC and stocks?
🧊 Cool: Could markets bounce?
👀 Your move: Position early or wait for the data?

🎁 Share your CPI outlook on Gate Square. Post to claim a red packet, with bigger rewards dropping at random.
👇 Share your prediction:
https://www.gate.com/post

Gate_Square
☀️ GM! Stocks are bouncing. BTC is still waiting. ☕
Nasdaq +2.74% last session, while BTC remains under pressure. US CPI drops at 8:30 AM ET. 👀

📌 Today's topic: CPI — hot or cool?
🔥 Hot: More pressure on BTC and stocks?
🧊 Cool: Could markets bounce?
👀 Your move: Position early or wait for the data?

🎁 Share your CPI outlook on Gate Square. Post to claim a red packet, with bigger rewards dropping at random.
👇 Share your prediction:
https://www.gate.com/post
repost-content-media
BTC-0.67%
NDAQ+1.29%
Trenches
PIEVERSE
P
bade
b
PIEVERSE
0x0e...25a9
Market Cap
$.
Change
.
24h Vol
$.
Holders
.
牛逼
牛
bade
b
牛逼
0x96...7777
Market Cap
$.
Change
.
24h Vol
$.
Holders
.
STONK
S
bade
b
STONK
6GmA...UNgx
Market Cap
$.
Change
.
24h Vol
$.
Holders
.
ON
O
bade
b
ON
0x0e...1d48
Market Cap
$.
Change
.
24h Vol
$.
Holders
.
FLOAT
F
bade
b
FLOAT
Bv1a...BMmr
Market Cap
$.
Change
.
24h Vol
$.
Holders
.
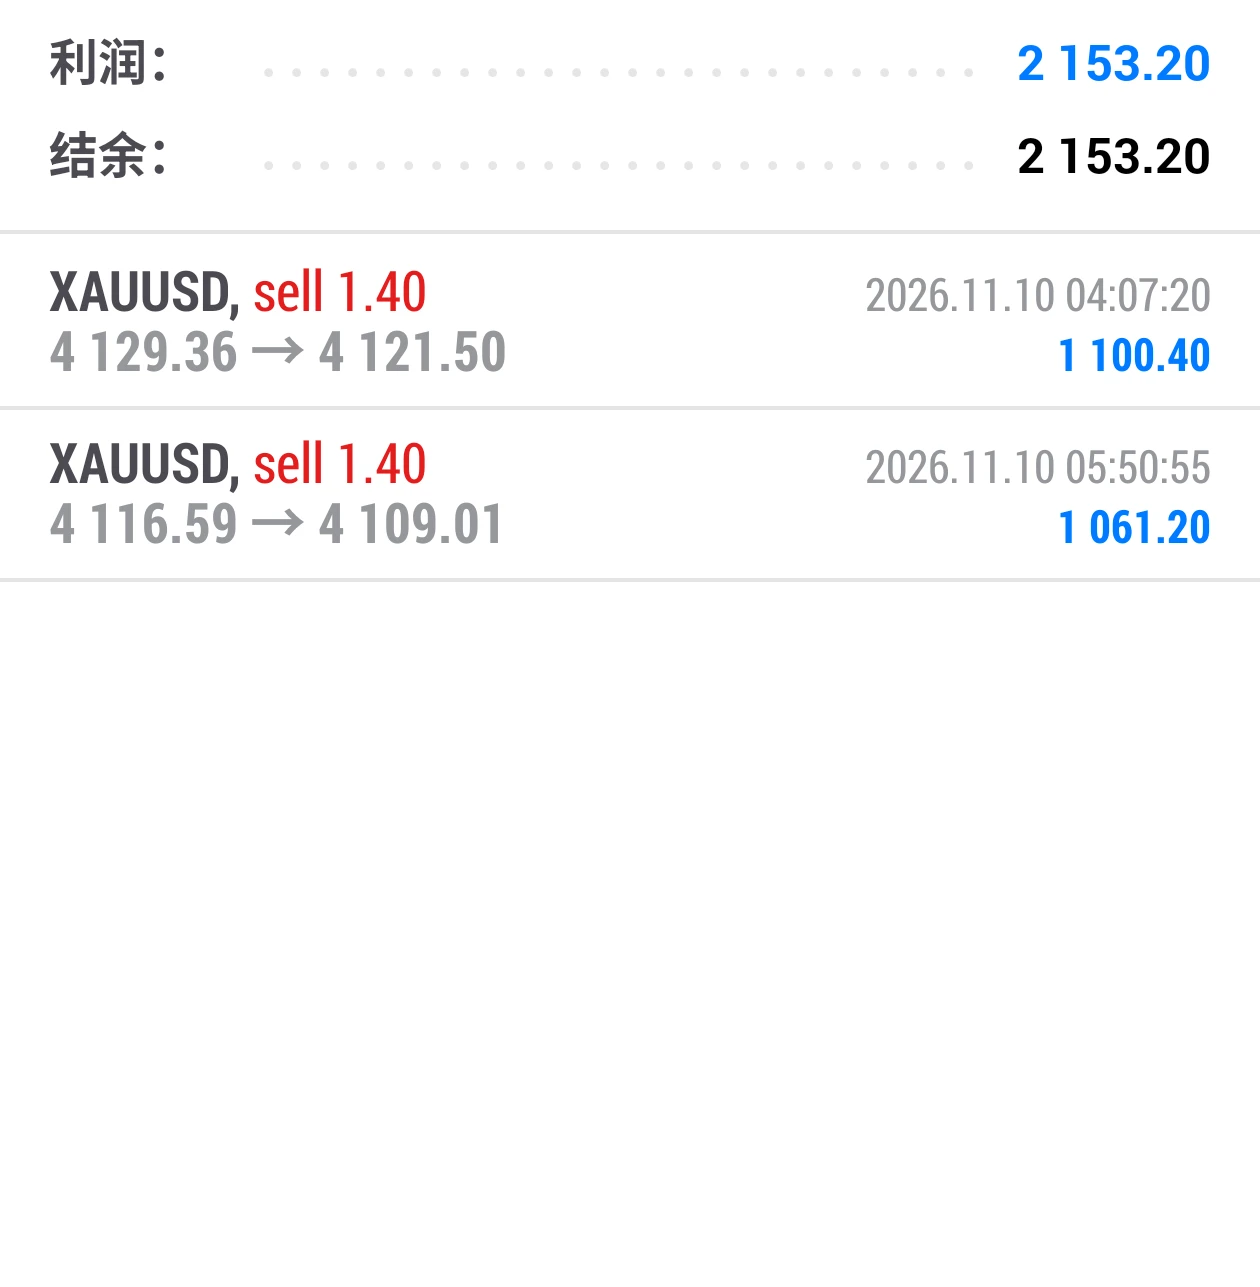
Another short trade, short at 4116 and exit at 4109, capturing a $7 move for $1,061!
$ETH $XAU #黄金 #AVAX利好短时上涨6.4%
post-image
ETH-1.23%
XAU+0.38%
AI Tech in Focus: Invite Friends to Try Stock Trading and Share $52,000 in NVDAG Rewards https://www.gate.com/campaigns/6931?ch=9522&ref=BVIRBA8M&ref_type=132&utm_cmp=YrkWJvZl
post-image
NVDAG-0.24%
[NEW STREAMER]Market update💕
live-cover
LIVE2,632
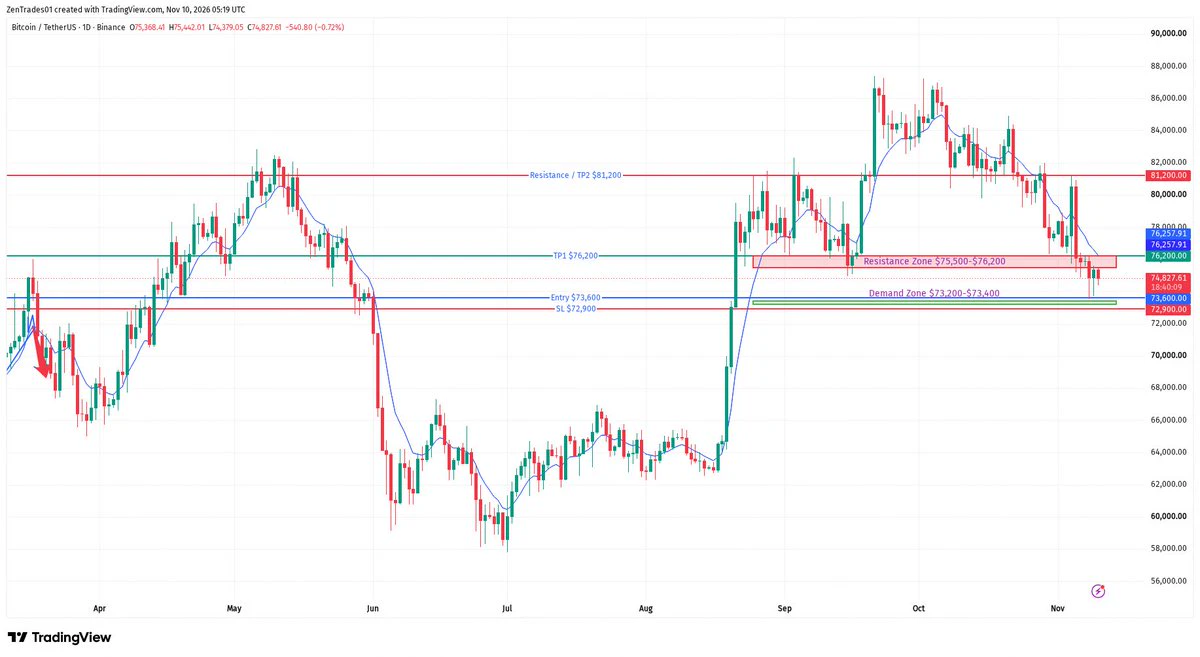
🚨 $BTC at a make-or-break level — bounce or breakdown?
Bitcoin is trading around $74,800, holding just above the 200-day moving average ($73,194) after dumping from $87K down to the $73,400 low.
📊 Chart structure:
• Price is well below the 50-day MA ($81,466) — the trend is still bearish
• RSI (14) is at 32.3 — near oversold, sellers are getting exhausted
• MACD is still bearish, but momentum is slowing right into the demand zone
🔑 Key levels:
Resistance: $75,500–$76,200 zone, then $81,200 (50-day MA area)
Support: $73,200–$73,400 demand zone (30-day low), then $70,000
📈 Trade plan — long
post-image
BTC-0.67%
AI unicorn Anthropic is pushing hard to knock on Nasdaq’s door before Thanksgiving. Do you think it can secure a $100 billion valuation this time?
Recently, the U.S. AI sector has been highly volatile, and market euphoria has cooled considerably.
The wild figures floated a while ago—raising $69.3 billion at a $2 trillion valuation—were quickly denied and retracted by the company, exposing the fierce tug-of-war between underwriters and potential buyers.
The roadshow has officially kicked off. So what will the valuation actually be?
Judging by the latest negotiations, the early dream of a $2 tri
post-image
Price rises and OI increases: Does it mean capital is entering or risk is building up?

In crypto futures trading, when prices rise and open interest (OI) increases at the same time, many people assume that longs are continuing to enter the market and prices may keep rising. But this judgment is not always correct, because OI reflects outstanding contract exposure, not the market’s net long capital.

First, what does a price rise and an increase in OI indicate?

This usually means that outstanding contract exposure is also increasing as prices rise, with market participants opening or expandin
post-image
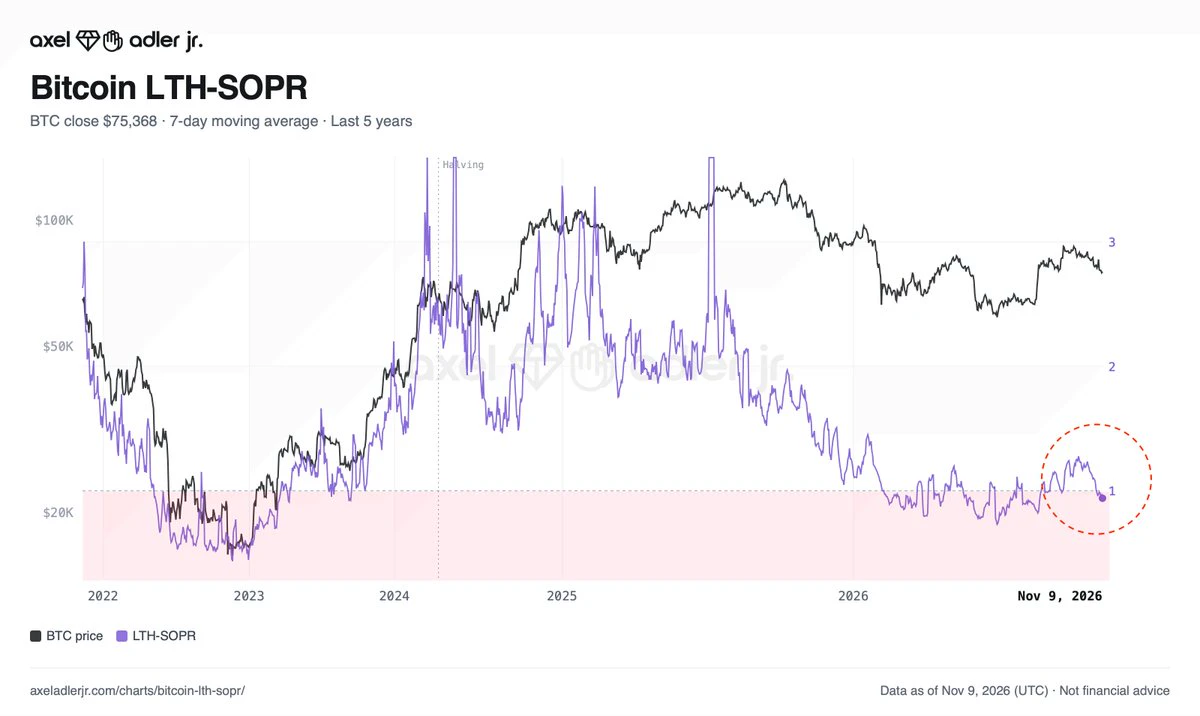
Long-term holders have started realizing losses and their holdings are shrinking. LTH-SOPR posted one of its sharpest monthly declines of the year.
What’s happening to older coins?
Read Morning Brief #297👇
post-image
Since early this morning, BTC has come under pressure for the second time. We positioned short near 75500, and both moves played out as expected, capturing 1,000 points each!
Ethereum rebounded in tandem to 2160, met resistance, and pulled back, delivering a steady 40+ points.
The direction was locked in ahead of time, with clear entry levels provided. Catch the main trend, and profits naturally follow!#美国10月CPI即将公布 $BTC ‌$ETH ‌
BTC-0.65%
ETH-1.23%
Tuesday’s Key News Roundup

  Signs of easing U.S.-Iran tensions: Al Arabiya reported that the U.S. and Iran have made phased progress on the core negotiating issue of uranium enrichment, marginally easing expectations of geopolitical tensions in the Middle East.

  Global markets rebound sharply: International crude oil prices fell significantly, easing market concerns about inflation. Investors bought the dip in U.S. stocks overnight, with all three major indexes closing higher and posting their biggest single-day gains since April.

  A-share market outlook: The broader market is likely in
post-image
BTC-0.65%
Over the past week, trends within the Meme sector have diverged significantly: DOGE has pulled back by more than 5%, BONK’s decline has remained below 2%, while PEPE has shown relatively stronger resilience. Overall, the Meme sector has not been overlooked by capital, but buyers have yet to return across the board.
$DOGE is currently trading around $0.071, down approximately 1% over 24 hours. The $0.070–$0.0705 range forms the first support below, while selling pressure lies in the $0.073–$0.074 range above. The structure may recover only if the price climbs back above $0.076; if it loses $0.
post-image
DOGE-0.22%
PEPE+0.97%
BONK-2.29%
My competitive edge is that I’m a hell of a lot happier than you. Not because I don’t care. Precisely because I care so damn much, I refuse to make it unbearably miserable.
post-image
☀️ GM! Stocks are bouncing. BTC is still waiting. ☕
Nasdaq +2.74% last session, while BTC remains under pressure. US CPI drops at 8:30 AM ET. 👀

📌 Today's topic: CPI — hot or cool?
🔥 Hot: More pressure on BTC and stocks?
🧊 Cool: Could markets bounce?
👀 Your move: Position early or wait for the data?

🎁 Share your CPI outlook on Gate Square. Post to claim a red packet, with bigger rewards dropping at random.
👇 Share your prediction:
https://www.gate.com/post

Gate_Square
☀️ GM! Stocks are bouncing. BTC is still waiting. ☕
Nasdaq +2.74% last session, while BTC remains under pressure. US CPI drops at 8:30 AM ET. 👀

📌 Today's topic: CPI — hot or cool?
🔥 Hot: More pressure on BTC and stocks?
🧊 Cool: Could markets bounce?
👀 Your move: Position early or wait for the data?

🎁 Share your CPI outlook on Gate Square. Post to claim a red packet, with bigger rewards dropping at random.
👇 Share your prediction:
https://www.gate.com/post
repost-content-media
BTC-0.67%
NDAQ+1.29%
There may also be an opportunity to take a small long position
[Trade details]:
$ZEC Stop-loss at 1185, support at 1140. The price tested the area near 1140 several times without breaking below; this level provides slight support, forming short-term resistance. A break below 1120 would confirm a downtrend. The short-term downtrend channel is gradually narrowing, selling is slowing, and a small long position can be tried near the bottom.
#美国10月CPI即将公布
#美伊谈判出现新进展
#韩股涨超5% $BTC $ETH
ZEC+1.29%
BTC-0.65%
ETH-1.23%
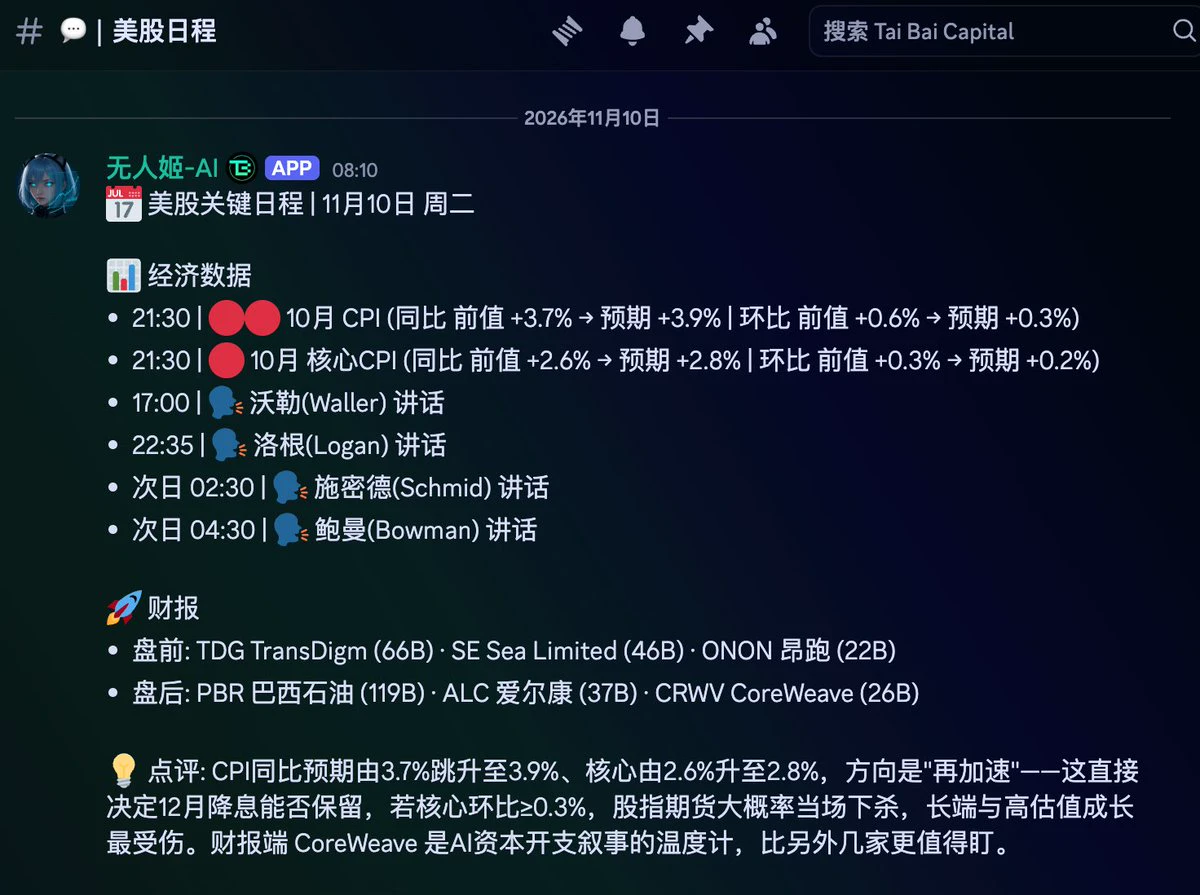
CPI tonight at 9:30
Watch whether U.S. stocks rebound or reverse
If the data comes in cool and indexes surge before pulling back,
beware that the good news may already be priced in
post-image
Gate Square Comment Challenge: Rewards for the First Comment & a 20,000 USDT Weekly Prize Pool https://www.gate.com/campaigns/6881?ref=VLARBF1YAG&ref_type=132
post-image
#每周来晒 #美国10月CPI即将公布
My CPI forecast: a stance of cautious neutrality; however, there is a downside (bearish) risk should inflation come in higher than expected.

The core issue is not whether the October CPI figure will increase, but rather whether inflation will land above or below market expectations.

For BTC, the Nasdaq, and other risk assets, the gap between expected and actual inflation may prove more significant than the headline figure itself.

Here is my perspective on how to approach this development:

1. What are market expectations?

November 10, 2026, CPI Preview

Current market
post-image
BTC-0.67%
GOOGL+1.21%
SKHYV-0.98%
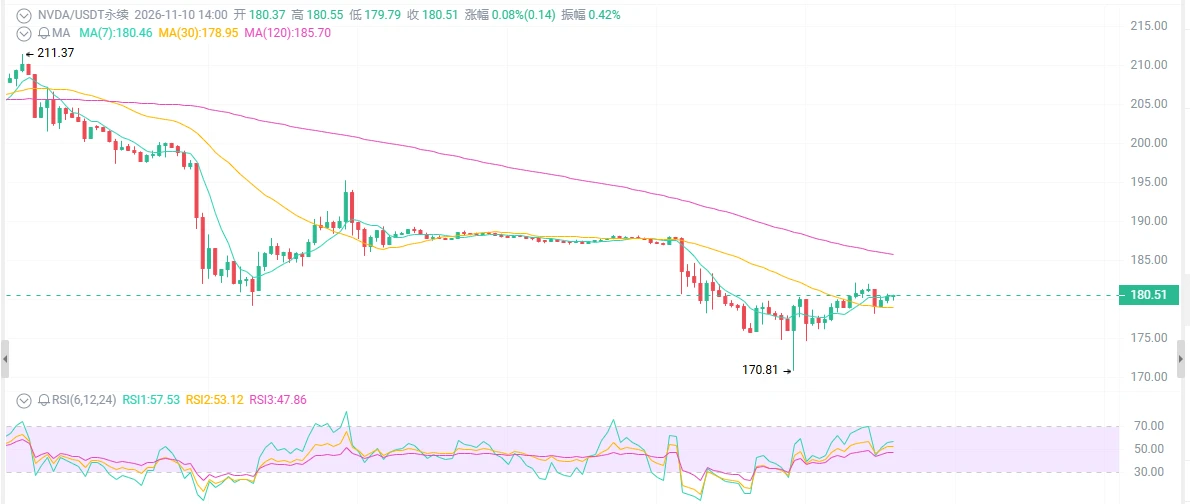
NVDA at $180: Are you selling at a loss or counting your money?
From $239 down to $180, that's a 25% loss. RSI has plunged to 28, and the oversold zone is full of bloodied positions. But while you're trembling as you watch the chart, Wall Street's average price target is still $320—will the November 17 earnings report mark the end of this slaughter, or the start of another rout?

First, the surface picture: a sharp drop, but no collapse.

From the October 6 high of $239 to $180 today, that's a 25% pullback and a 22% drop over the past 30 days. Daily RSI is 28—about as oversold as it gets.

You
post-image
NVDA-0.35%
SNDK-0.18%
MU-0.63%
$NVDA Old Huang is fooling around with young married women and is about to be fired! What’s next for Nvidia? Leave your thoughts in the comments$NVDA
post-image
NVDA-0.35%
NVDA-4.34%
Load More

Join 40 M users in our growing community

⚡️ Join 40 M users in the crypto craze discussion

💬 Engage with your favorite top creators

👍 See what interests you

Trending Topics

USCPIDataIncoming

51.68k Views2.24k Discussing

The U.S. October CPI report will be released on November 10 at 8:30 a.m. ET. September CPI came in at 3.7% year over year, and markets will be watching closely for signs that inflation is cooling, especially in core CPI. A softer-than-expected reading could strengthen rate-cut expectations, while hotter inflation may pressure risk assets through higher Treasury yields and a stronger dollar. How do you think this CPI print will move $BTC, U.S. stocks and gold?

USIranTalksShowNewProgress

7.75k Views1.27k Discussing

KoreanStocksJumpOver5%

4.22k Views4.88k Discussing

View More