Square
Following
Hot
News
Notifications
Profile
Share your thoughts
placeholder
Article
Sure enough, fishing is the ultimate test of patience.
I’ve had my line in the water for over an hour, and haven’t caught a single fish, but I’m still taking my time and waiting.
Sometimes I think fishing and trading are pretty similar.
What truly tests you is never how long you have to wait, but whether you can stay calm and avoid changing your pace when there’s still no result after all that time.
Patience is a skill in itself. 🎣
post-image
I know someone wants to see this in their wallet
post-image
Trenches
ZIG
Z
bade
b
ZIG
0x8c...1145
Market Cap
$.
Change
.
24h Vol
$.
Holders
.
STONK
S
bade
b
STONK
6GmA...UNgx
Market Cap
$
Change
.
24h Vol
$.
Holders
.
IDOL
I
bade
b
IDOL
0x3b...ab07
Market Cap
$.
Change
.
24h Vol
$.
Holders
.
BTC
B
bade
b
BTC
C5xp...pump
Market Cap
$.
Change
.
24h Vol
$.
Holders
.
FLOAT
F
bade
b
FLOAT
Bv1a...BMmr
Market Cap
$.
Change
.
24h Vol
$.
Holders
.
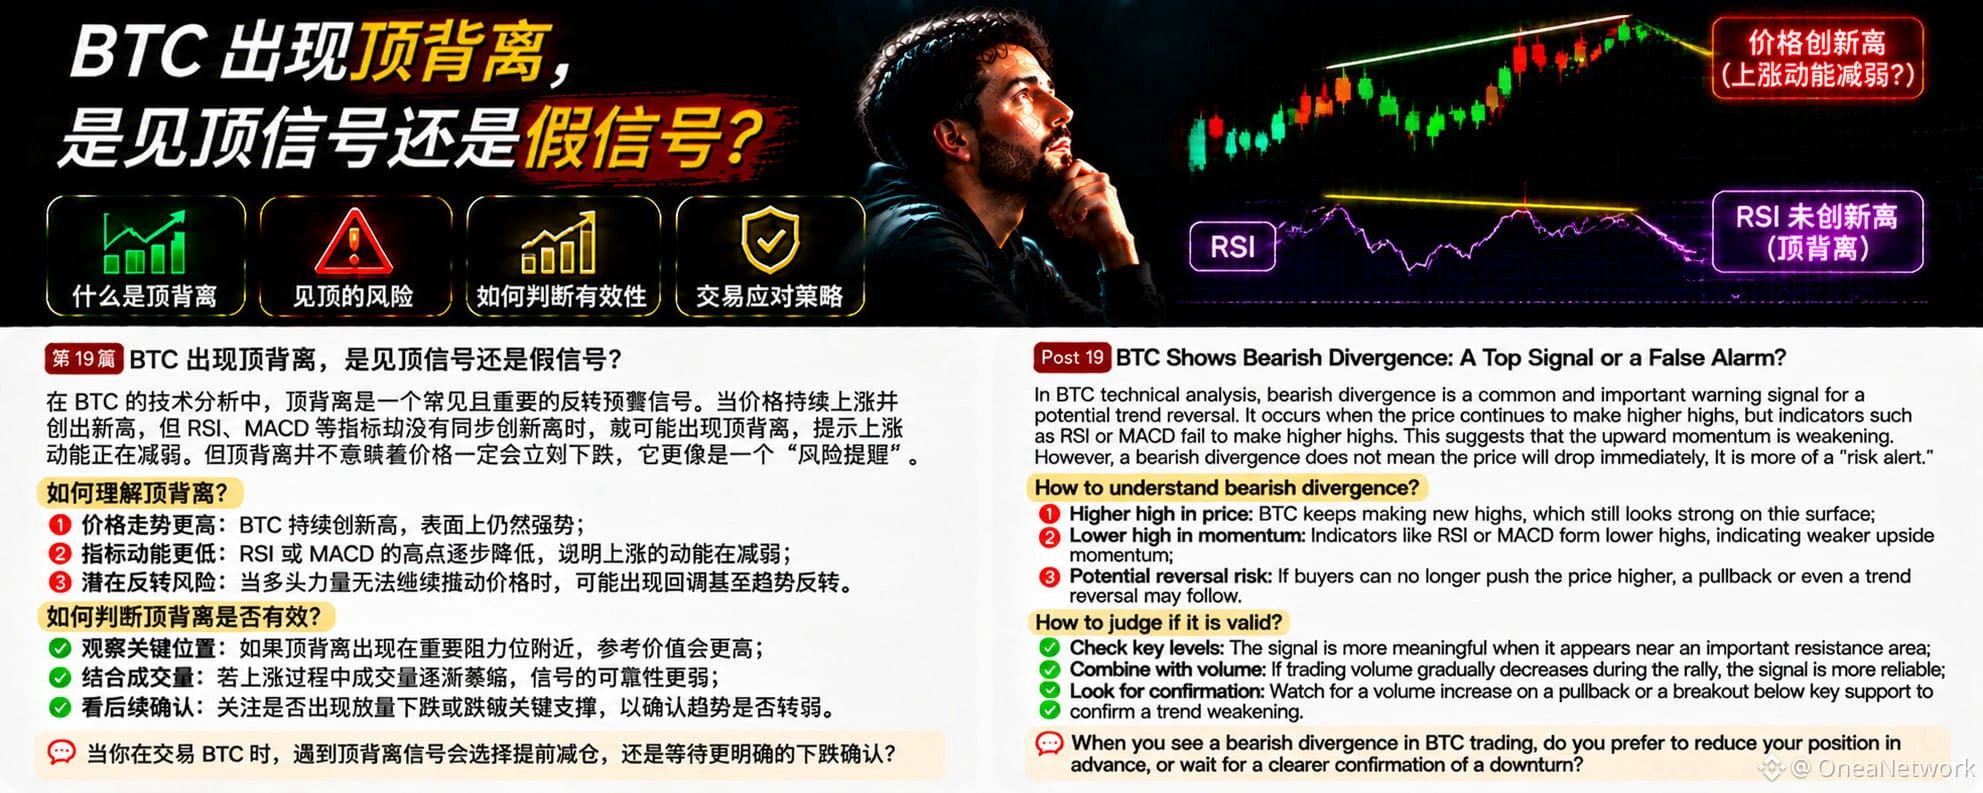
In BTC technical analysis, bearish divergence is a risk warning signal worth watching. Many traders see prices continually making new highs and assume the uptrend remains strong. But if prices continue to rise while indicators such as RSI or MACD fail to make new highs, bearish divergence may occur.
What is bearish divergence?
Simply put, it is when the price makes a higher high, but the technical indicator forms a lower high. This suggests that although the price is still rising, the momentum driving the rise may be weakening.
Why is bearish divergence worth watching?
First, upward momentum m
post-image
BTC-0.67%
Support and resistance levels are among the most fundamental and practical concepts in technical analysis. Many traders study candlesticks and indicators every day, yet overlook an important question: at which price levels are buying and selling pressure likely to shift?
First, a support level is an area where buying pressure may increase as the price falls. When the price approaches this level, some buyers may start entering the market, slowing the decline. But a support level does not mean the price definitely won’t break below it.
Next, a resistance level is an area where selling pressure m
BTC-0.67%
Two-Week Market Review: Through Rotating Gains and Losses, an Unassuming Approach Goes the Distance

  The two-week market period has come to a close. BTC completed two full cycles of gains and losses, while ETH followed in lockstep throughout. Volatility narrowed, and the pace remained highly synchronized, just as the old saying goes: “Tides rise and fall according to their own rhythms; clouds gather and disperse in their own time.”

  The first week began with wide swings around the 80k level, as daytime rebounds alternated with nighttime pullbacks and bulls and bears repeatedly whipsawed th
BTC-0.65%
ETH-1.23%
Our merits before God arise from His initiative and our free cooperation.
“The merit of man before God in the Christian life arises from the fact that God has freely chosen to associate man with the work of his grace. The fatherly action of God is first on his own initiative, and then follows man’s free acting through his collaboration…”
CCC 2008
post-image
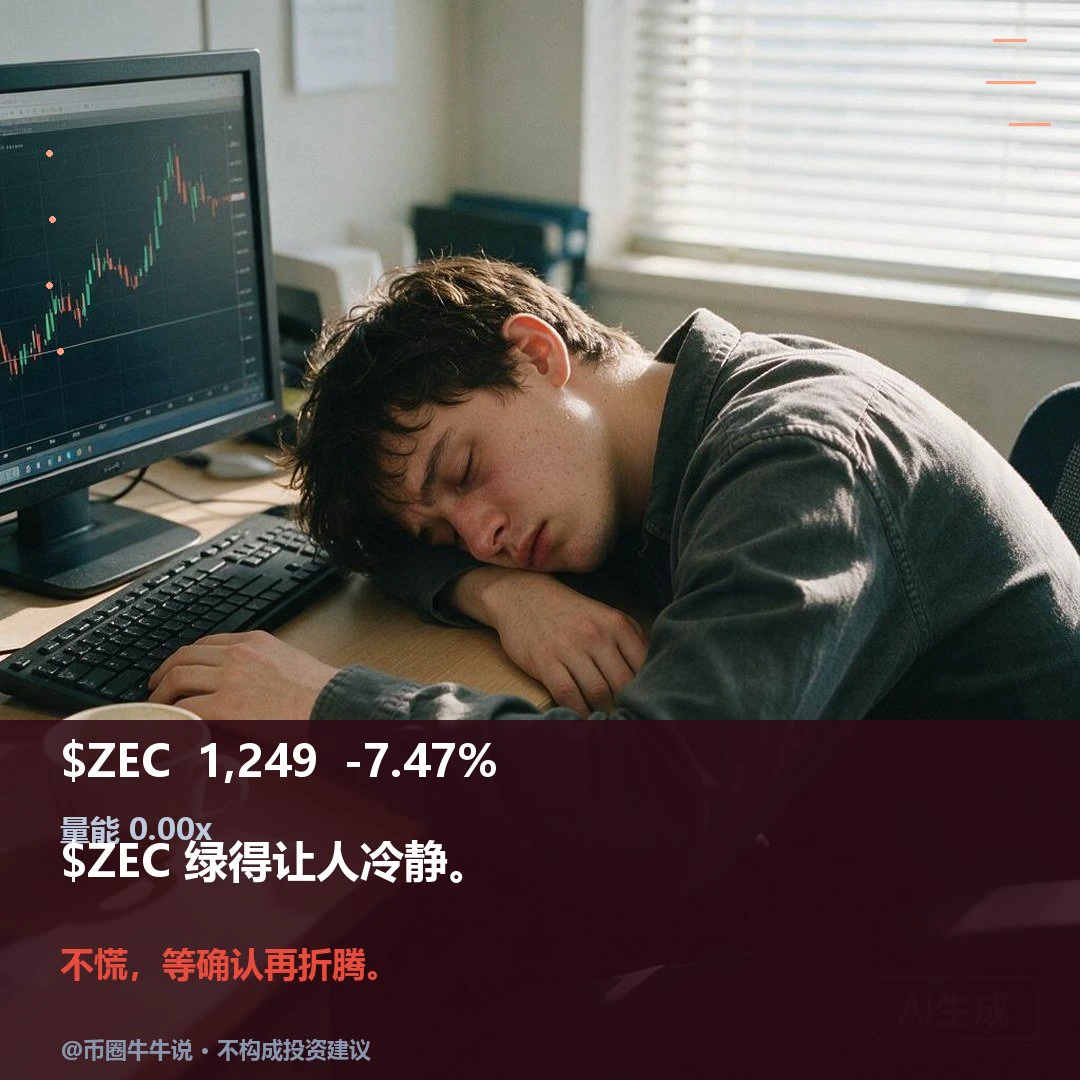
$ZEC Current price: 1249.21, 24H -7.47% (1236.65–1364.08). 1H is weak: RSI 29.56, price below EMA20 at 1271.78, volume ratio 0.00; 4H is weak: RSI 50.12, price below EMA20 at 1281.00, support at 1183.38/resistance at 1387.89. To move higher, price needs to hold above the 1350.85 resistance level; a break below the 1236.65 support level would signal further weakness. Review whether price holds above 1350.85 and recovers after losing 1236.65; volume is only 0.00x. The setup is invalid without volume or a recovery. Market volatility is high; for observation only.
post-image
ZEC+1.16%
#Ahr999EntersBottomBuyingZone
Bitcoin is attracting renewed attention from long-term investors as the AHR999 indicator enters its historically recognized bottom-buying zone. This development is particularly interesting because it comes during a period of uncertainty across the cryptocurrency market, when investors are carefully evaluating Bitcoin's valuation, market sentiment, and potential direction.

The AHR999 indicator is designed to help investors understand whether Bitcoin is relatively expensive or undervalued compared with historical valuation models. When the indicator moves into its
BTC-0.67%
  • 1
In the early hours of November 8, Yu Zheng posted a video late at night addressing Li Na: “Forgive Xu Fei.” In the caption, he said he was “shipping them like crazy” while watching “After We Meet Again.” When a netizen asked whether he had really sent it to Li Na, Yu Zheng replied, “She saw it and replied.” The topic shot straight to No. 1 on the entertainment charts, with its popularity exceeding 1.33 million.
The feud between the two dates back to Super Girl in 2006. Li Na said she had only told her friend Xu Fei about her plan to terminate her contract, but the news reached the company, and
post-image
Finally back in the Magic City
It’s so cold in the Magic City too
It’s gloomy out 🌧️
I just want to snuggle under the covers this weekend~
Any besties still snuggled up in bed too? 😈
post-image
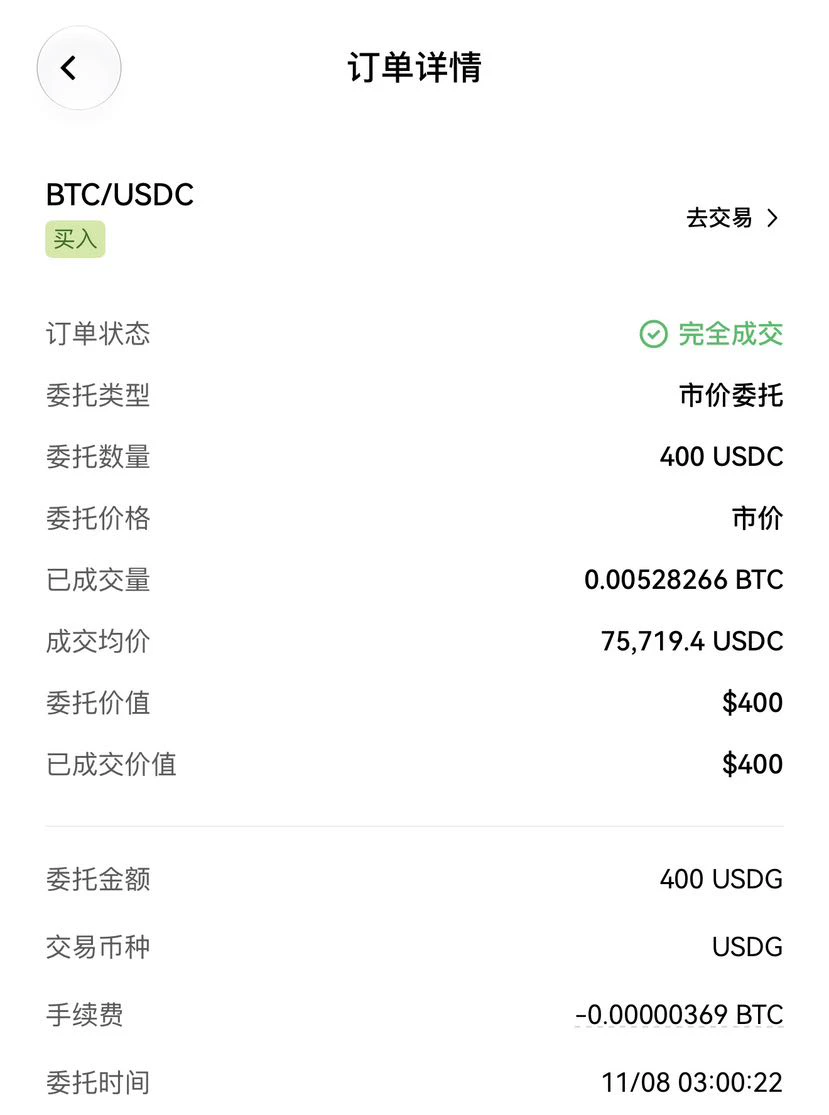
30-Year BTC DCA Experiment | Day 405 Live Check-In (1.75 BTC Achieved!) ⏳📈

I saw some very interesting data in the news this morning:
Wall Street spot ETFs saw cumulative net outflows of $1.28 billion this week (BlackRock alone saw over $400 million leave in a single day), the largest outflow since the $60,000 buying opportunity at the end of June this year. Foreign media are all asking: “Can Wall Street no longer keep buying this year?”

At 03:00:22 on a weekend morning, as institutions redeemed and retail investors sighed, my DCA system reached the 1.75 #BTC milestone right on schedule:
•
post-image
BTC-0.67%
BLK+0.60%
USDC+0.01%
#USAIStocksHitHard #ShareWeekly

The AI Market Reality Check: Why Wall Street Suddenly Turned Against Its Biggest Growth Trade

The artificial intelligence revolution has been one of the strongest investment narratives in recent years. Massive infrastructure spending, explosive demand for computing power, and expectations of long-term technological transformation pushed semiconductor companies and AI-related stocks to extraordinary valuations. However, the latest Wall Street sell-off has delivered a serious warning: even the strongest growth story cannot escape valuation pressure, political u
🔹 Bitcoin Doesn’t Need Banks, but Strategy Wants to Become a Bitcoin Bank
live-cover
LIVE2,758
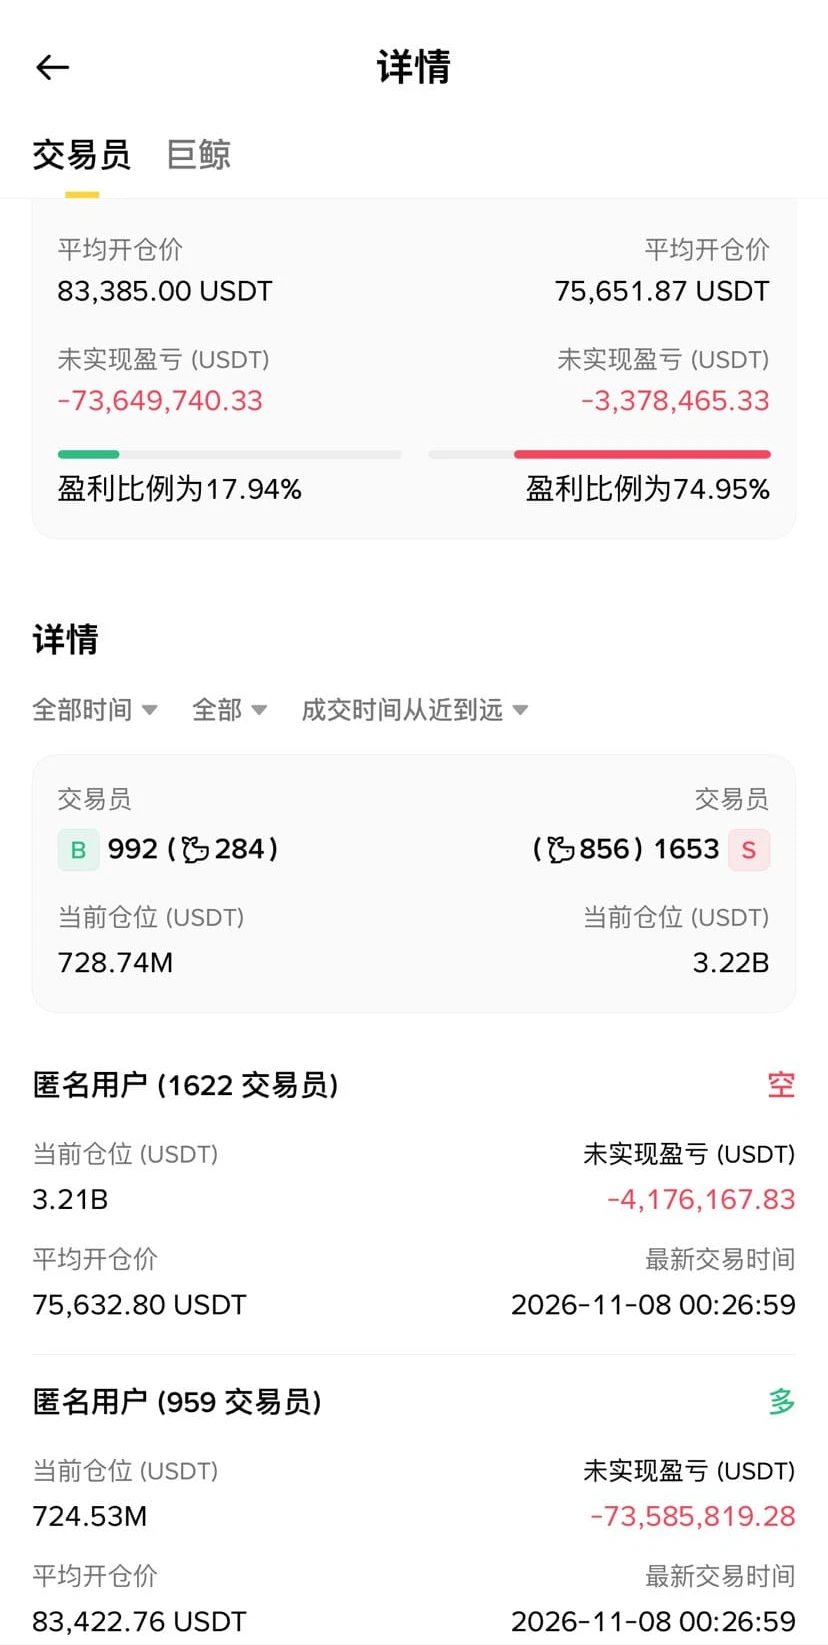
Who is it, which big shot opened a 3.2 billion Bitcoin short position? $BTC ‌#BTCETF资金持续流出 #Gate安全卫士免费开通 #BTC
post-image
BTC-0.65%
$SOXL I remain bullish on U.S. stocks. Even the hardest-falling stocks won’t keep going down without ever turning back; a rebound will come sooner or later. Those with no positions can go long at the current market price, with an initial target of 55 and a further target around 60. Those with heavier positions can also trade a short-term rebound to take some profits. $SOXL Keep the contract tag as usual. Risk warning: The above reflects only my personal market outlook and does not constitute investment advice. Contract trading carries extremely high leverage risks, so be sure to manage your po
post-image
SOXL-1.16%
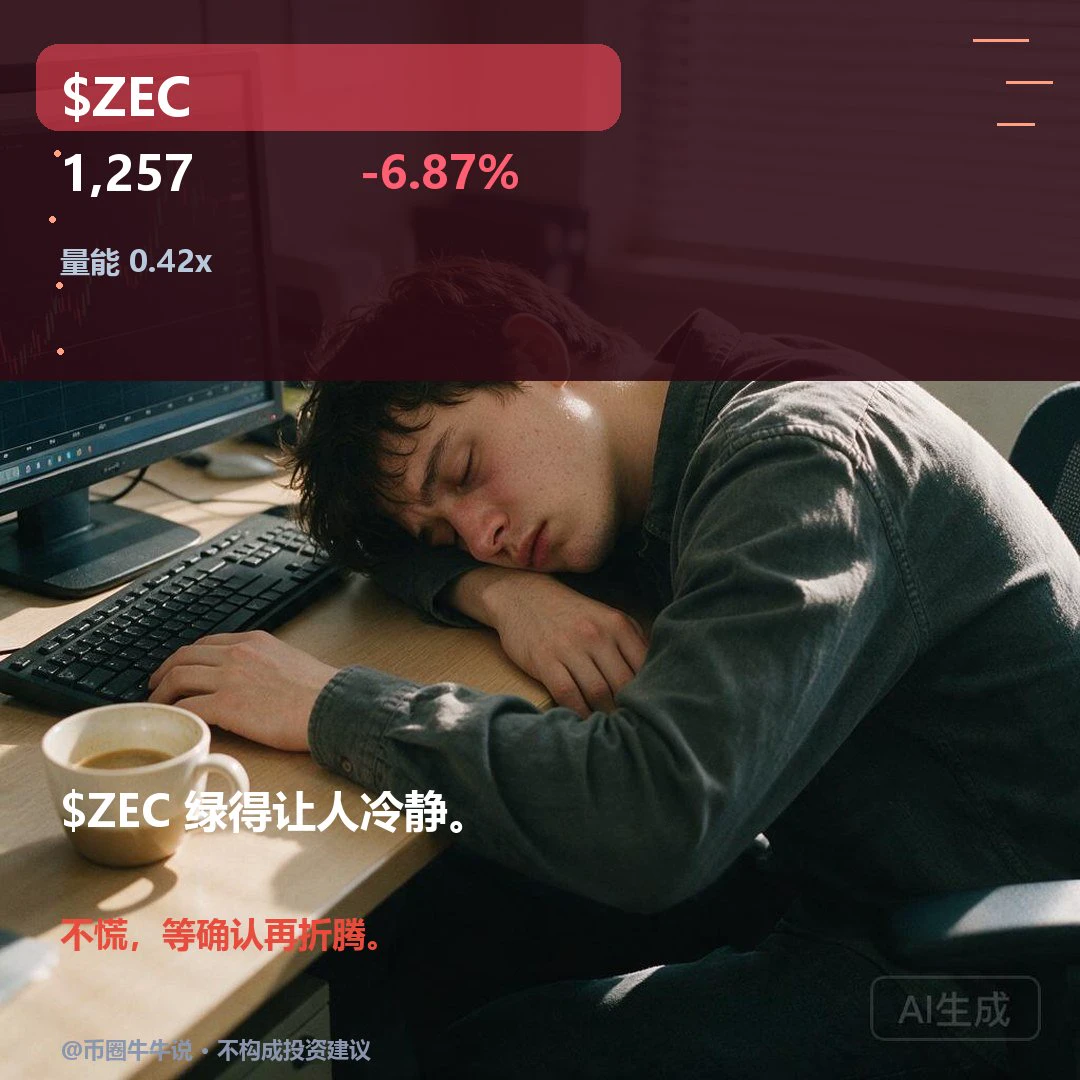
$ZEC Current price: 1257.38, 24H -6.87% (1235.00–1350.19). 1H is weak: RSI 40.10, EMA20 1270.54, support 1235.00/resistance 1334.33; 4H is weak: RSI 51.71, EMA20 1281.78, support 1183.38/resistance 1387.89. A move higher only matters if price reclaims and holds above the 1334.33 resistance; a break below the 1235.00 support would signal further weakness. Review whether price holds above 1334.33 and recovers after losing 1235.00; volume is only 0.42x. Without volume or a recovery, the setup is invalidated. The market is volatile; for observation only.
post-image
ZEC+1.16%
#DGAI

Worked for 8s
DGAI Gains 1.3%: Is Growing AI Infrastructure Demand Supporting Its Market Momentum?

What Is Driving DGAI Today?

Is DGAI starting another upward move, or is this simply a short-term pause in a wider market battle? The latest figures show a modest positive move, but the trading activity deserves closer attention.

As of November 8, 2026, at 01:30 UTC, DGAI/USDT was trading at $0.76992, up 1.3% over 24 hours. Trading volume reached approximately 3,471,405 USDT.

The price increase shows that buyers have maintained a slightly positive position during this period. However,
DGAI+0.67%
  • 1
#USCPIDataIncoming #每周来晒
Unpacking the October CPI Scenarios and Monetary Crossroads

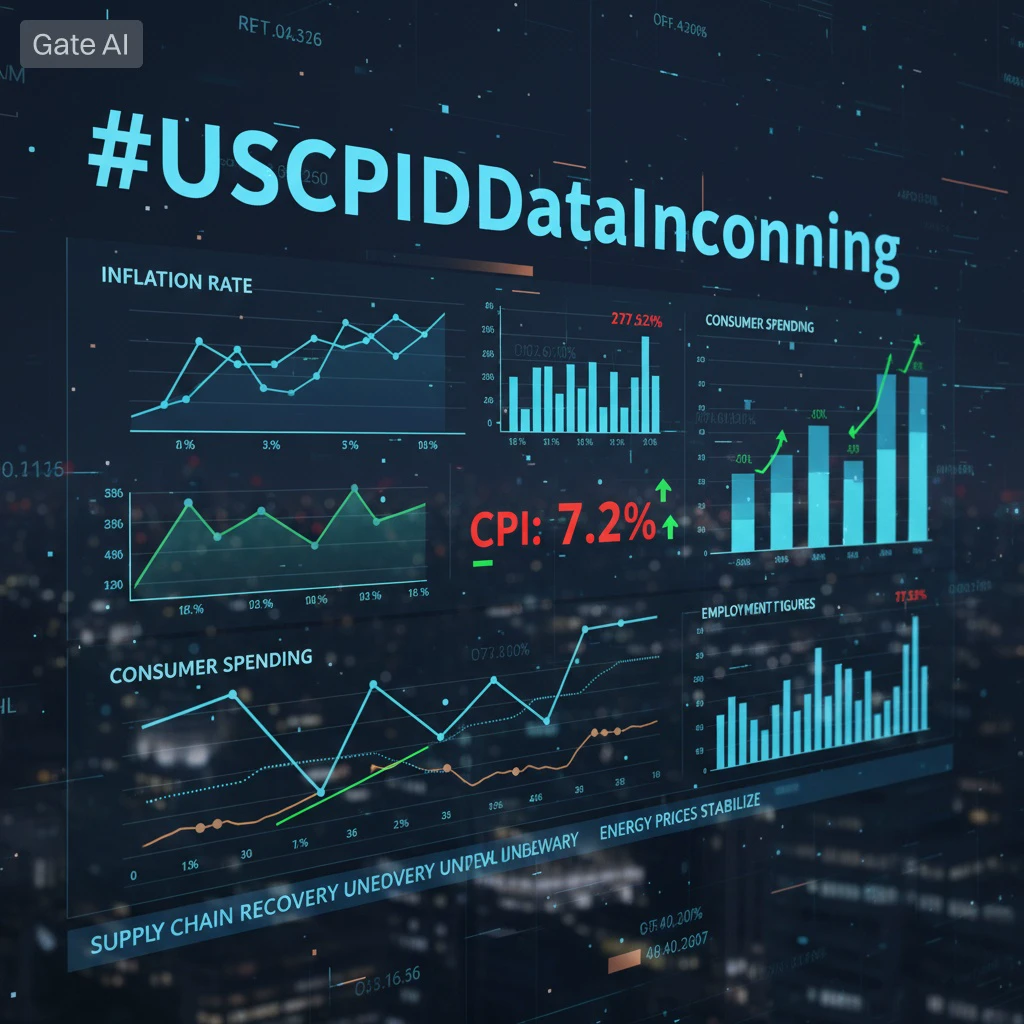
The global financial system is bracing for a high-stakes macroeconomic checkpoint as the U.S. Bureau of Labor Statistics (BLS) prepares to release its October Consumer Price Index (CPI) report on Tuesday, November 10, 2026, at 8:30 AM ET (6:30 PM Pakistan Time). Following the exceptionally robust October Nonfarm Payrolls report (+165,000 jobs, 4.1% unemployment), this inflation print serves as the ultimate decider for the Federal Reserve's final monetary policy track of the year.
Traditional equities, digita
post-image
GAS-0.57%
SPX500+0.19%
XAU+0.38%
BTC-0.67%
  • 3
  • 1
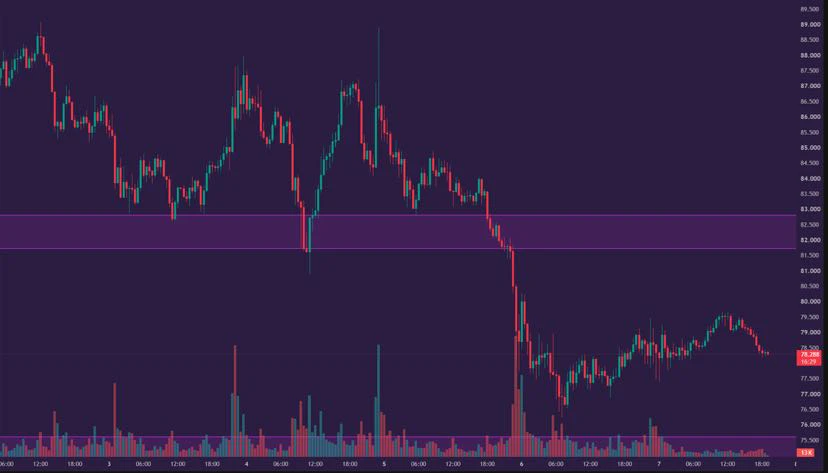
$HYPE This week's drop has been pretty brutal😥

Last week's news of ICE's partnership with Trade[XYZ] sent market sentiment soaring, with the price briefly nearing $96

But this week, it continued to slide, falling from nearly $88 to around $78, down about 11% for the week

So, has anything major deteriorated in the fundamentals?

At least for now, there hasn't been any project-specific bad news that would be enough on its own to explain this decline

The ICE partnership is still in place, progress in the related U.S. regulated market still requires regulatory approval, and Hyperliquid's busi
post-image
HYPE+0.33%
Load More

Join 40 M users in our growing community

⚡️ Join 40 M users in the crypto craze discussion

💬 Engage with your favorite top creators

👍 See what interests you

Trending Topics

USCPIDataIncoming

1.04k Views1.47k Discussing

The U.S. October CPI report will be released on November 10 at 8:30 a.m. ET. September CPI came in at 3.7% year over year, and markets will be watching closely for signs that inflation is cooling, especially in core CPI. A softer-than-expected reading could strengthen rate-cut expectations, while hotter inflation may pressure risk assets through higher Treasury yields and a stronger dollar. How do you think this CPI print will move $BTC, U.S. stocks and gold?

USAIStocksHitHard

23.56k Views3.69k Discussing

USNonfarmPayrolls

40.34k Views4.38k Discussing

View More