Share your thoughts
placeholder
Article
ZEC | LONG 🟢 | 15m Entry: 1507.52 Stop Loss: 1465.4 Take Profit 1: 1560.17 | Take Profit 2: 1591.76 | Take Profit 3: 1633.87 For reference only; do not chase the trade. Set invalidation at the stop-loss level. Technical setup only. Not investment advice.$ZE
post-image
ZEC+4.39%
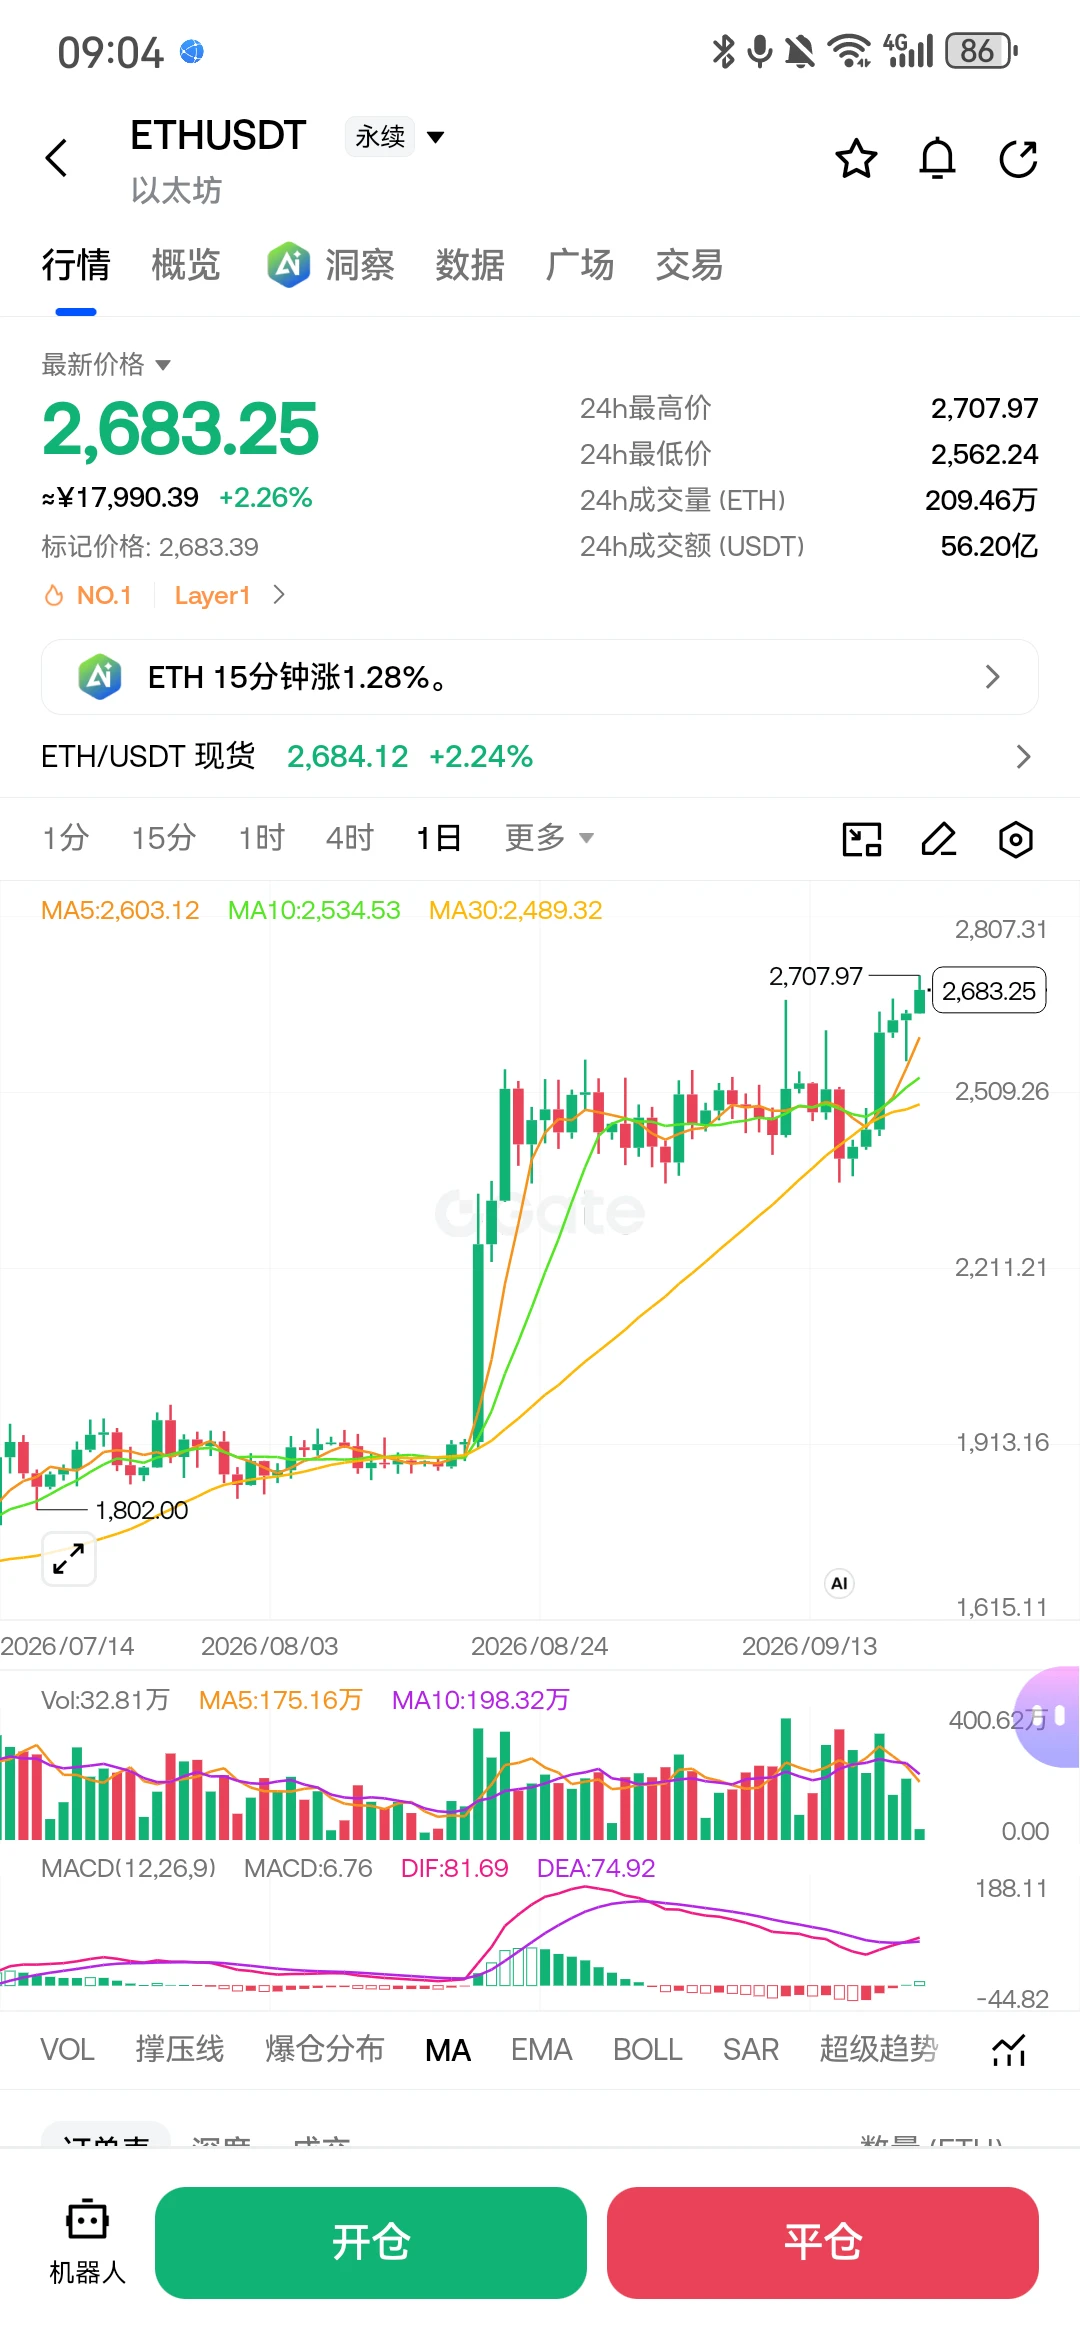
ETH hits the 2,700 area as Bitmine’s unrealized losses narrow to about $2.71B; they still hold ~5.96M ETH at a cost basis around $3,340, with 85% staked. This highlights ongoing treasury recovery amid rising prices. $ETH
post-image
ETH+2.55%
BMNR+8.66%
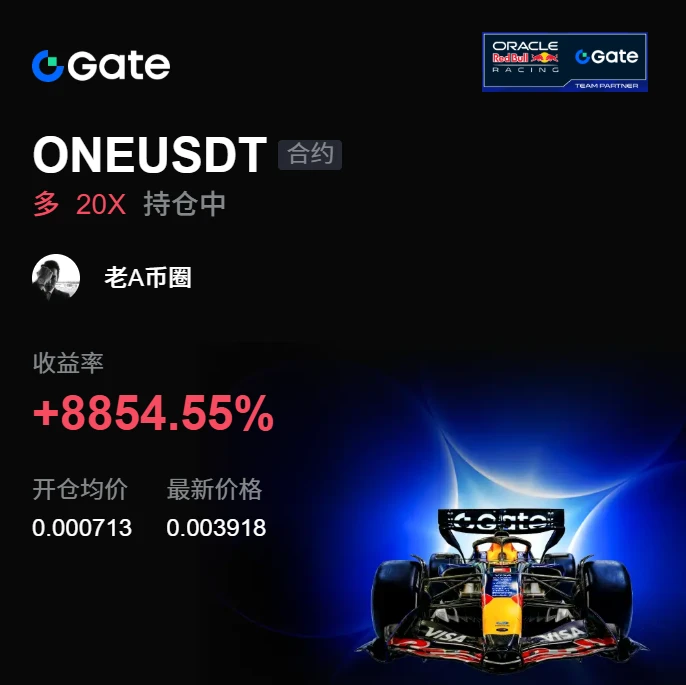
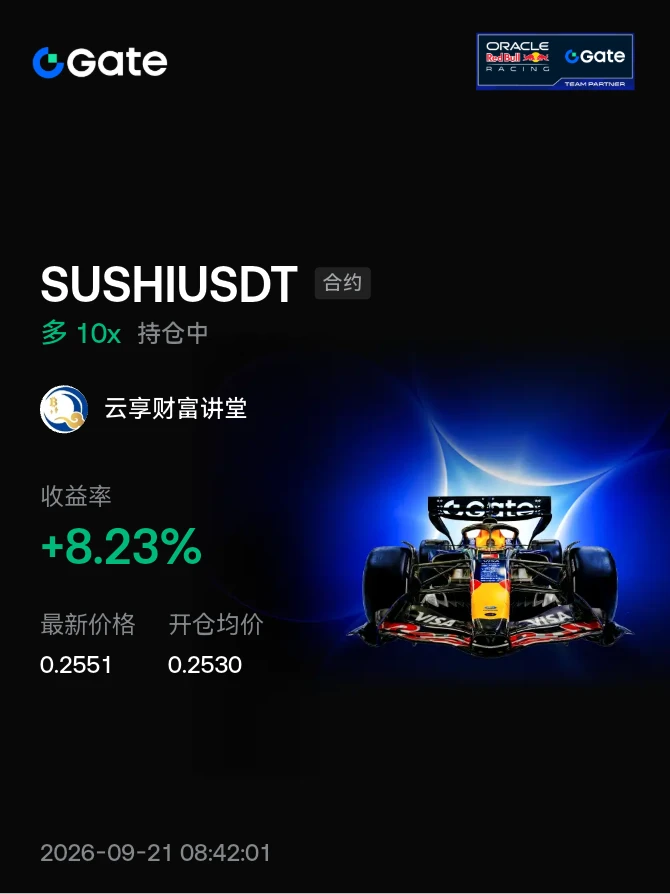
Some trades are just like this: the more you watch them, the less they move; the moment you turn away, they take off. When the screen was glowing green, the key level $ONE held, funds quietly entered, and I signaled to go long—small position, no panic.

Looking back, from 0.000713 to 0.003922, +8857.32% was already delivered. Those who were on board should have woken up laughing. This run was worth the wait—what a rush.

Better to miss part of a rally than catch a falling knife and end up covered in blood.
The money you earn is the monetization of your understanding; the money you lose is t
post-image
ONE+11.50%
SNDK+1.54%
SOL+2.08%
#EthereumSpotETFsSee144MNetInflow
Ethereum’s $143.8M ETF Inflow: The Bigger Signal Is What Comes Next
Ethereum’s U.S. spot ETF market delivered a notable reversal on Sep 18, with approximately $143.8M in net inflows after three consecutive sessions of withdrawals. At first glance, that number looks like a straightforward bullish signal. But the more useful way to read it is through the percentages, capital concentration and broader flow trend.
The first major detail is where the money went.
BlackRock’s ETHA attracted approximately $114.3M, representing around 79.5% of the total daily inflow.
ETH+7.79%
BTC+6.16%
  • 2
$ETH Back at 2600, but this time it’s really a bit different from before~
In the past, the rise was driven by retail FOMO, but this time the main force behind the rally is institutional buying.
Last Friday, single-day net ETF inflows reached $144 million, with BlackRock alone taking in $114 million.
Even more significantly, BlackRock’s Ethereum ETF has seen net inflows for 20 consecutive trading days without a single break.
What does this mean?
It means they’re quietly accumulating, not just playing around in the short term~
So here’s the question: Can you still chase it?
Let me be honest: Ins
post-image
ETH+2.53%
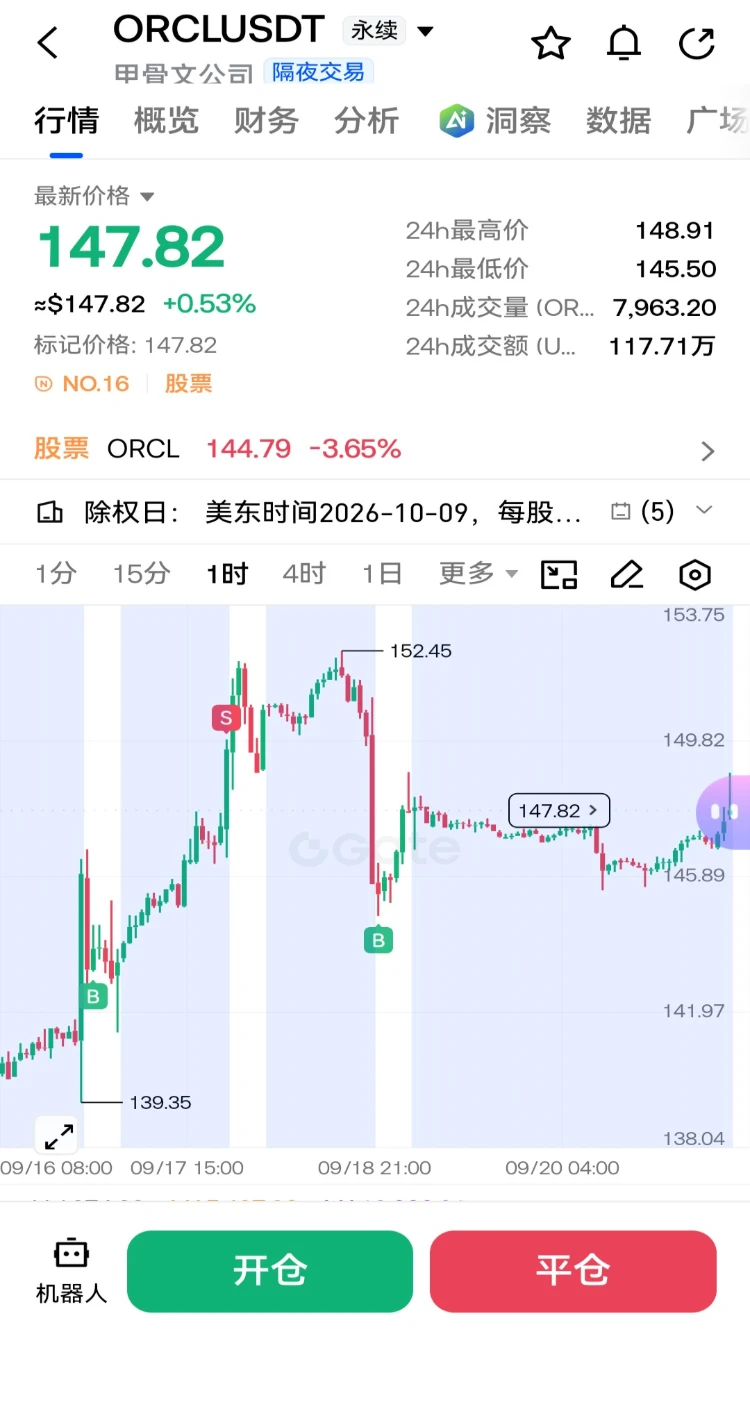
$ORCL Oracle has started rising, and the MACD has also formed a golden cross. The first take-profit target is around 150.7. If the price returns to around 145, I will add to my position again with a small amount. #Gate广场中秋团圆局
post-image
ORCL+1.03%
#晒出我的持仓收益 Bulls remain strong; maintain long positions at low levels.
post-image
$1000 to $100,000 Crypto Trade Challenge Today
live-cover
LIVE774
#JapanRealEstatePowerChipStocksRise
#BOJHikesTo1.25%31YearHigh
BOJ HIKES TO 1.25% — JAPAN ENTERS A NEW RATE ERA
The Bank of Japan has raised its policy rate from 1.00% to 1.25%, taking Japanese borrowing costs to their highest level in roughly 31 years. The decision was approved by a 7–2 vote at the September 18 meeting.
This is more than another routine rate move.
Japan spent decades operating with exceptionally low interest rates, making the yen one of the world's major low-cost funding currencies. The move to 1.25% represents another step in the BOJ's broader mo
USDJPY-0.07%
BTC+0.83%
ETH+2.55%
Good morning, recap
#OP$OP didn’t rise much yesterday, holding steady at 0.12. Today ETH held at 2600. Hopefully OP’s upgrade on the 24th will bring a big rise—let’s try to outperform arb. Can any expert estimate how high OP can go?
Keep holding OP
Stay the course
OP+5.64%
ETH+2.55%
ARB+7.58%
#Gate24小时净流入Top1 , if this data is viewed only on the surface, it can easily be interpreted as a simple return of funds; but when viewed against the backdrop of BTC's recent trend, expectations for further US dollar rate hikes, and changes in overall market risk appetite, it looks more like a very clear signal: the funds have not stayed away—they are choosing new entry points.
In this round of market action, BTC remains the absolute core. It is like a touchstone, first testing the market's direction before determining where subsequent liquidity will spread. But when Bitcoin's volatility enters
post-image
BTC+0.83%
Price gains speak for themselves; the trend proves everything. In the future, 100x is just the starting point, with 1,000x as the baseline.#Gate24小时净流入Top1
马勒戈币
马勒戈币马勒戈币
Gate.Fun
MC:$287.67KHolders:1750
100%
BP briefly topped $0.9 to hit an all-time high, then pulled back; 24h +29% and 7d +69% signal strong near-term momentum for $BP.
post-image
$NVDA I’m not expecting $XRP
XRPUSDT
Perp
1.4244
+1.18%
to hit $100 or $598.
For me, $20 to $30 is enough.
I won't stop at 10,000 XRP.
I’ll keep accumulating as long as the price is under $3.
Everyone has different retirement goals; some aim for $100, others even higher.
But I’m a realist, and I’m willing to wait another 10 years for it.
What is your ideal "life-changing" price for XRP?
NVDA+1.23%
  • 1
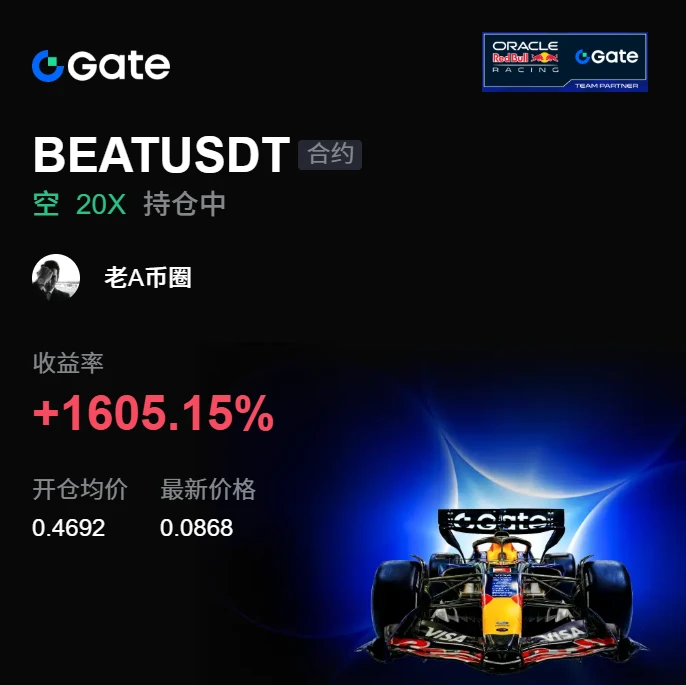
I was in an average mood today, but felt a little better after opening my account. While everyone is still waiting and watching, I see clear overhead resistance. Every push upward falls just short, signaling a short bias—don’t rush to switch to longs.
$BEAT Entered at 0.4692, current price 0.0866, +1605.15%—that says it all. This profit feels great.
Take 80% off first, and protect the remaining 20% at breakeven. Don’t panic on a rebound—the entry price is the protection level. Put the bulk in your pocket first; don’t be greedy for the last bite.
Panic comes from having no plan, and losses com
post-image
BEAT-0.80%
ADA+1.98%
SNDK+1.54%
Financial News, Crypto Market Updates, Real-World Strategies
live-cover
LIVE1,138
  • 1
Is there anyone born in the 1970s who can debunk this? Is this really true?
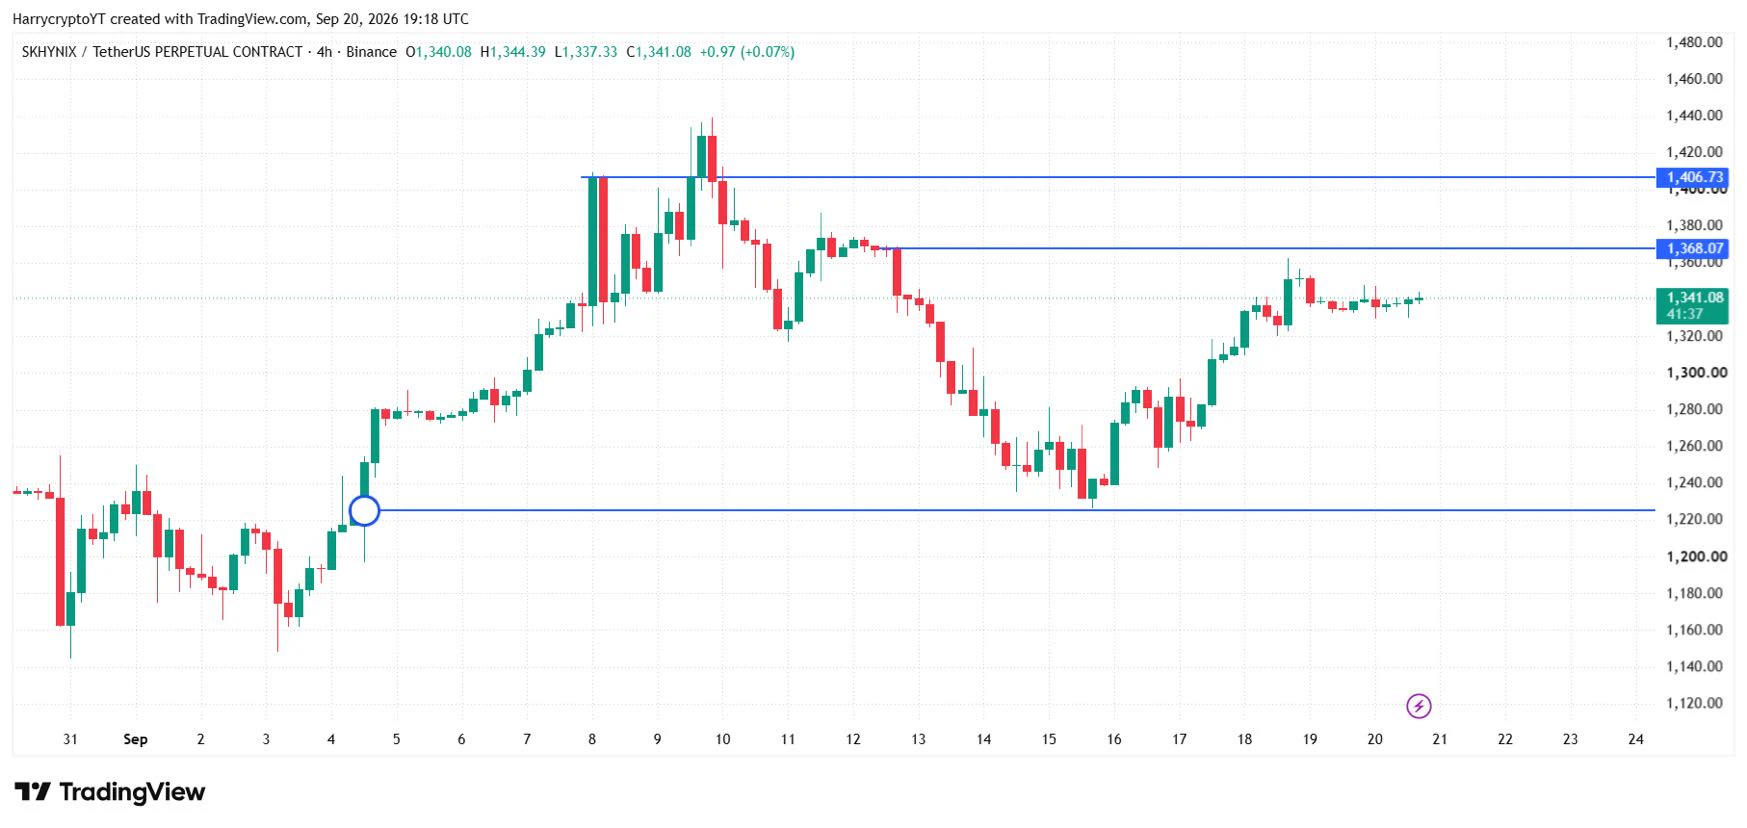
📊 SKHYN/USDT Key Levels
🟢 Support: 1230
🔴 Resistance: 1368 & 1406
In price action, closely watch the 1230 support and 1368–1406 resistance zone. 📈📉
$SKHY #Crypto #Trading #Support #Resistance
post-image
SKHY+2.61%
#GateSquareMidAutumnReunion #‌$NVDA #NVDA
NVDA at $222.40: Can the AI Giant Push Into the Next Leg?
NVDA at $222.40: Can NVIDIA Push Into the Next Leg?
NVIDIA is trading around $222.40, putting the stock at an important technical and psychological level. After the powerful AI-driven semiconductor rally, buyers are now trying to determine whether NVDA can continue toward a new upside leg or whether the stock needs another consolidation phase first.
$220 Is Now the Battlefield
The $220 area has become the most important short-term reference. Holding above this level keeps the immediate structur
NVDA+1.23%
  • 5
  • 1
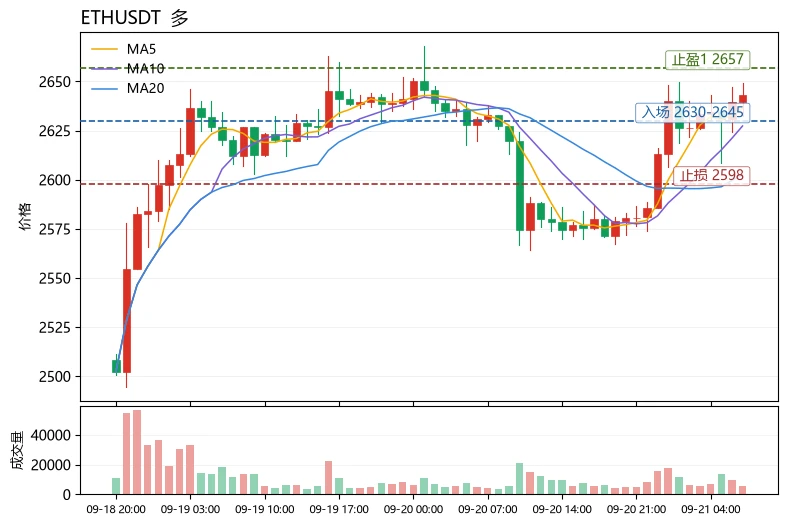
The Fear & Greed Index is at 71, in the greed zone but not at an extreme level, indicating that market risk appetite remains, though momentum for chasing highs is beginning to require fundamental support. $ETH The current price is 2643.36, up only +0.33% over 24h, significantly underperforming RENDER's +10.89% and AR's +9.69% over the same period. Funds are rotating toward high-beta sectors, and ETH is looking more like a passive follower than an active leader in the rally. Technically, MA5=2636.38 has moved above MA20=2602.45, with the bullish moving-average alignment intact; RSI=65.3 is str
post-image
ETH+2.55%
RENDER+8.84%
Load More

Join 40 M users in our growing community

⚡️ Join 40 M users in the crypto craze discussion

💬 Engage with your favorite top creators

👍 See what interests you

Trending Topics

MSTRTopsNasdaq100

74.45k Views3.13k Discussing

Strategy (MSTR) has gained about 48% over the past month, making it the best-performing stock in the Nasdaq 100, while Bitcoin rose roughly 12% over the same period. The company holds 845,050 BTC with a cumulative cost basis of about $63.73B. MSTR is not a pure Bitcoin proxy — its price swings can be more extreme. Can this rally last?

Gate Tops 24H Net Inflows Among Exchanges

26.66k Views3.7k Discussing

BTCRetakes80K

57.59k Views60.83k Discussing

View More