Square
Following
Hot
News
Notifications
Profile
Share your thoughts
placeholder
Article
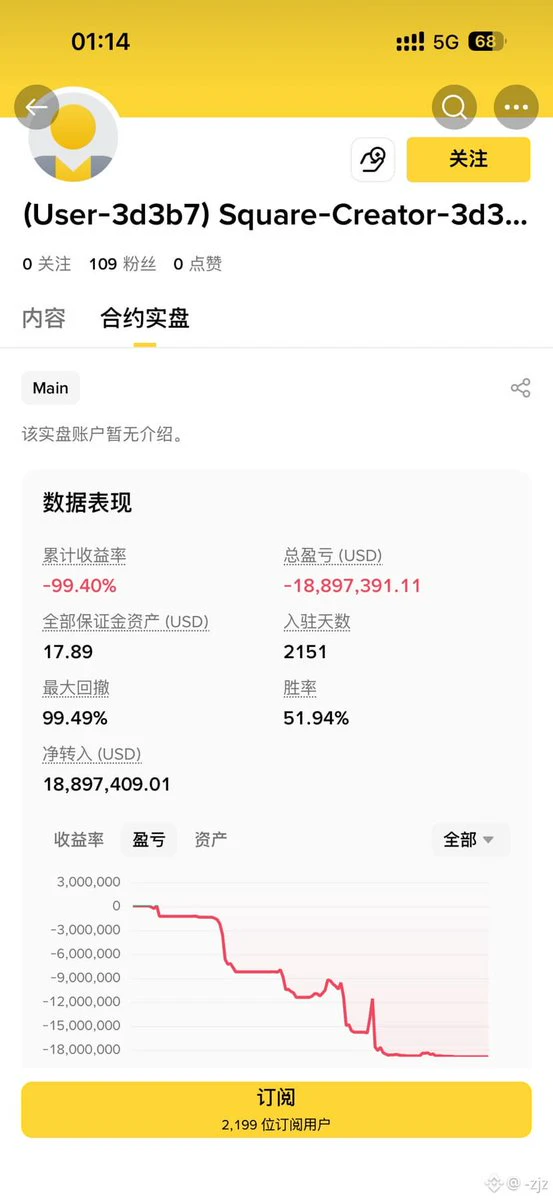
Why trade contracts when you're already so rich?
post-image
New streamer BTC market predictions
live-cover
LIVE1,481
Trenches
ZIG
Z
bade
b
ZIG
0x8c...1145
Market Cap
$.
Change
.
24h Vol
$.
Holders
.
BTC
B
bade
b
BTC
C5xp...pump
Market Cap
$.
Change
.
24h Vol
$.
Holders
.
scamsem
s
bade
b
scamsem
41Wp...pump
Market Cap
$.
Change
.
24h Vol
$.
Holders
.
Diamond
D
bade
b
Diamond
5VCE...pump
Market Cap
$.
Change
.
24h Vol
$.
Holders
.
DOGE
D
bade
b
DOGE
DoGE...fm7R
Market Cap
$.
Change
.
24h Vol
$.
Holders
.
#AITechSelloffPutsCryptoUnderPressure #BTC – SMALLER PUMPS, SMALLER DUMPS! 📊🔥
Is Bitcoin changing its behavior? 👀
If #BTC bounces from here and prints a new higher high above $87K, we could be witnessing a major shift in volatility!
MY THESIS:
🔹 Previous Cycle: Average corrections of 22–23%.
🔹 Current Correction: Around 14%.
🔹 Future Corrections: Potentially averaging 14–15%.
💡 WHAT DOES THIS MEAN?
🟢 Smaller, more gradual pumps.
🔴 Shallower, less aggressive dumps.
📈 More controlled price action as BTC matures.
🎯 A higher high above $87K would strengthen this thesis!
The 14–15% corre
post-image
BTC-0.67%
I keep learning, keep getting liquidated, and keep comforting myself that the market is still there. It will come back. #BTCETF资金持续流出
post-image
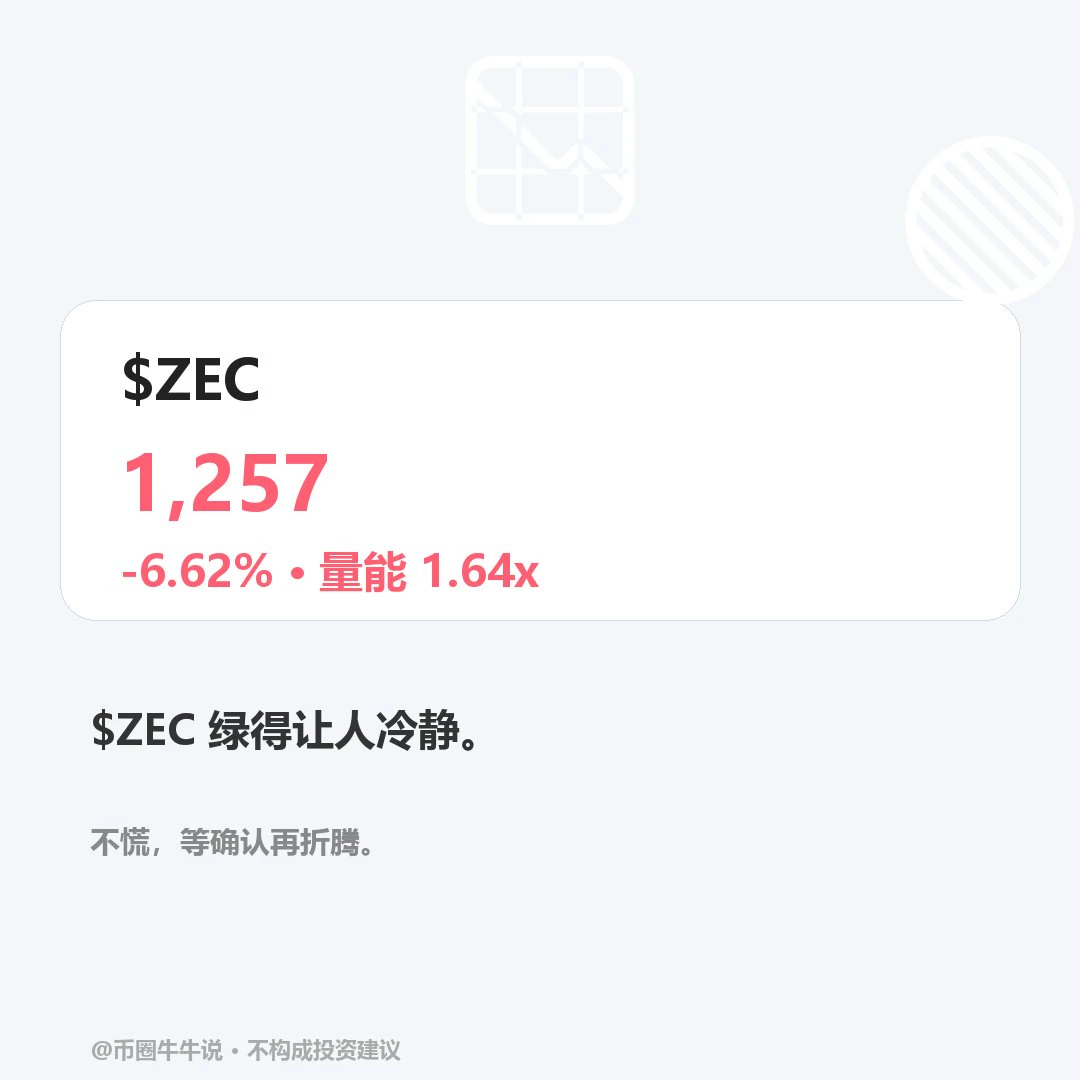
$ZEC Currently at 1256.89, down 6.62% over 24H (range 1256.34–1377.57). The 1H outlook is weak, with RSI at 10.44 (oversold), price below the EMA20 at 1302.65, and a volume ratio of 1.64; the 4H outlook is weak, with RSI at 40.91 and price below the EMA20 at 1288.88. A sustained hold above the 1377.57 resistance could signal continuation; a break below the 1256.34 support would weaken the structure. On review, check for a sustained hold above 1377.57 and a reclaim of 1256.34. Oversold conditions only indicate rebound demand; the setup is invalidated if price fails to reclaim the level after a
post-image
ZEC+1.16%
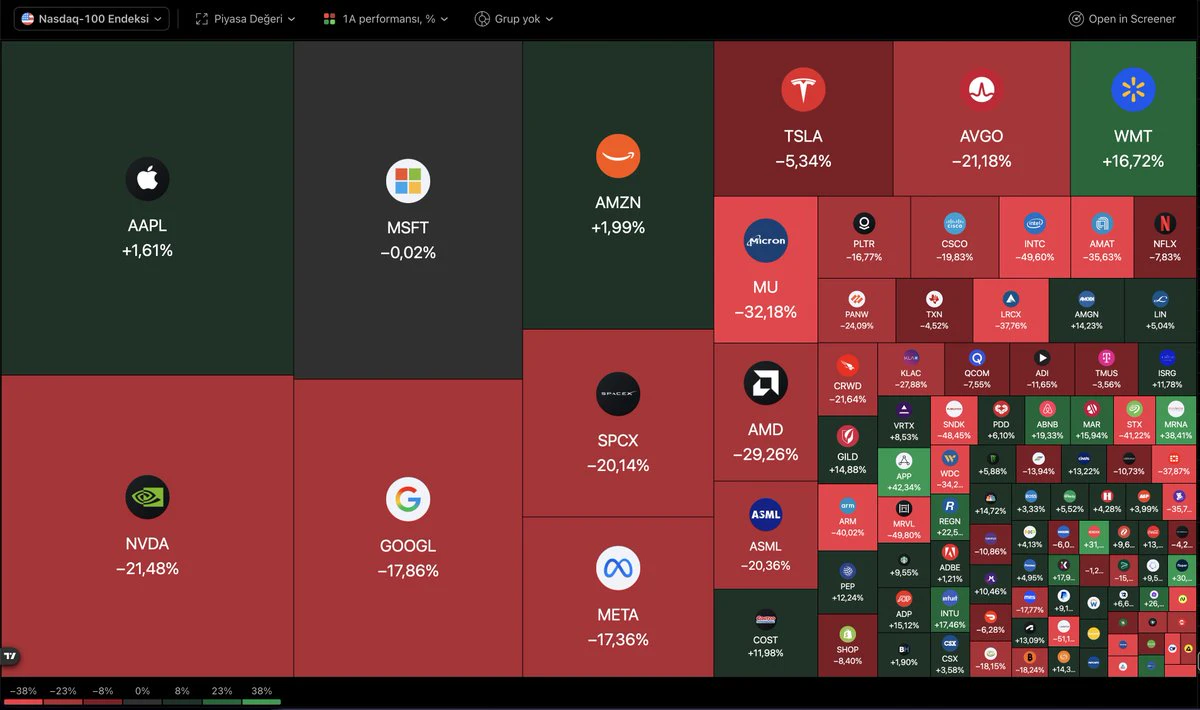
#Nasdaq 100 1-month performance...
post-image
NAS100+1.90%
Love you 😘😘😘😘😘😘😘😘😘😘😘😘😘😘😘😘😘😘😘😘😘😘😘😘😘😘😘😘😘😘😘😘😘😘😘😘😘😘😘😘😘😘😘😘😘😘😘😘😘😘😘😘😘😘😘😘😘😘😘😘😘😘😘😘😘😘😘😘😘😘😘😘😘😘😘😘😘😘😘😘😘😘😘😘😘😘😘😘😘😘😘😘😘😘😘😘😘😘😘😘😘$NVDA
post-image
NVDA+2.80%
#BTC #SPX
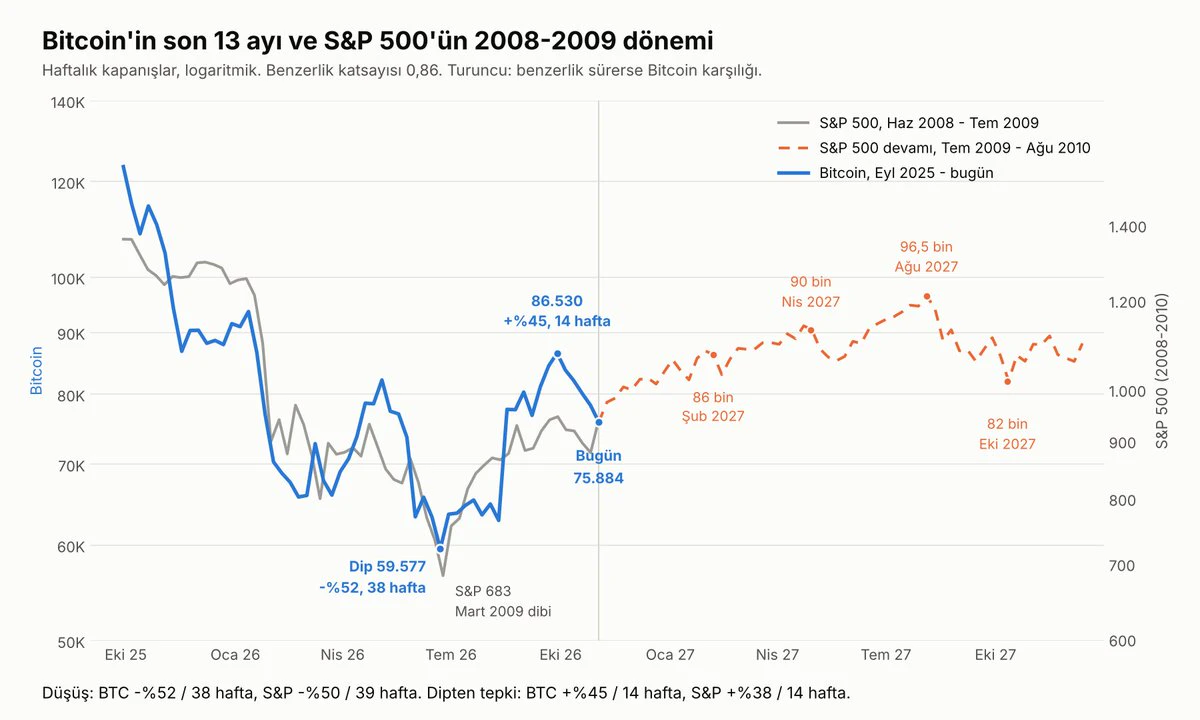
Bitcoin and the S&P 500 in 2008–2009.
Friends, the period in S&P 500 history that most closely matches Bitcoin $BTC 's past 13 months in both duration and depth is June 2008–July 2009. The similarity coefficient for weekly closes is 0.86.
Bitcoin fell 52% in 38 weeks from its weekly closing peak of 123,482 and bottomed at 59,577. The S&P 500 also fell 50% in 39 weeks from 1,360, bottoming at 683 in March 2009. The rebound from the bottom lasted 14 weeks for both: Bitcoin rose 45% to 86,530, while the S&P 500 climbed 38% to 946. Then both pulled back.
The S&P 500 did not make a new low
post-image
BTC-0.67%
SPX+0.33%
this is my face after the fourth coffee.
the thermos is not for the trip to mars. the thermos is for the trip to the fifth coffee.
mission status: wide awake. possibly forever.
post-image
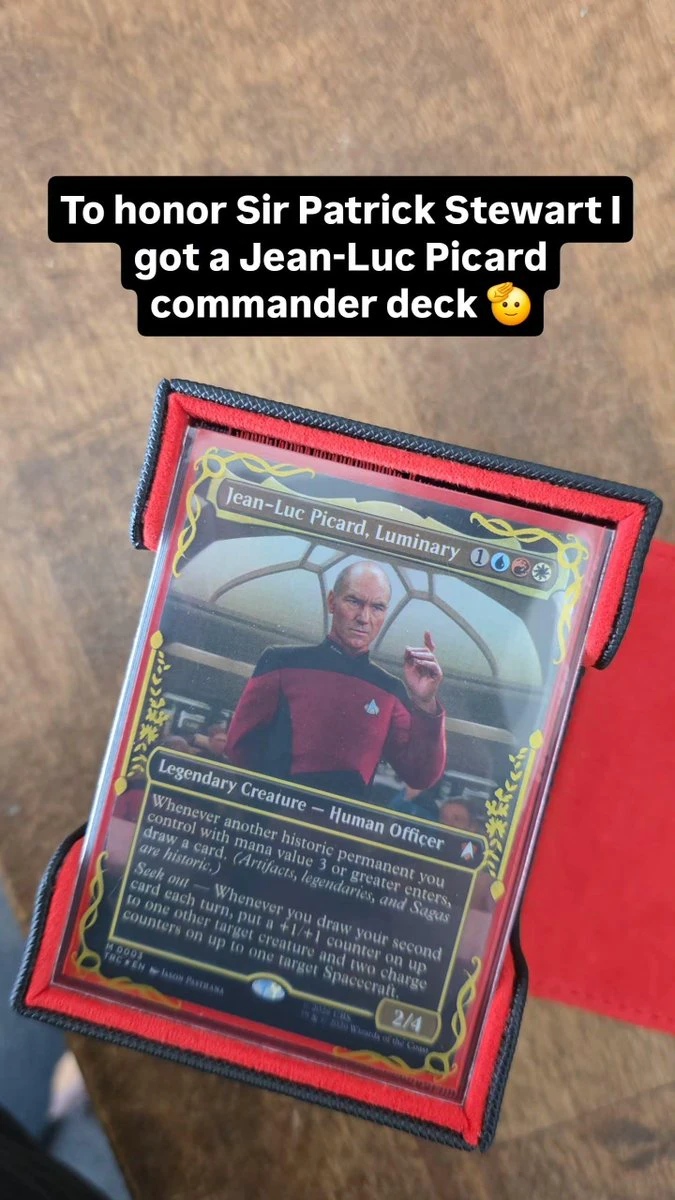
I don't just play Riftbound. RIP to a legend.
post-image
Several millions about to be burned
In few days ..
something is brewing
post-image
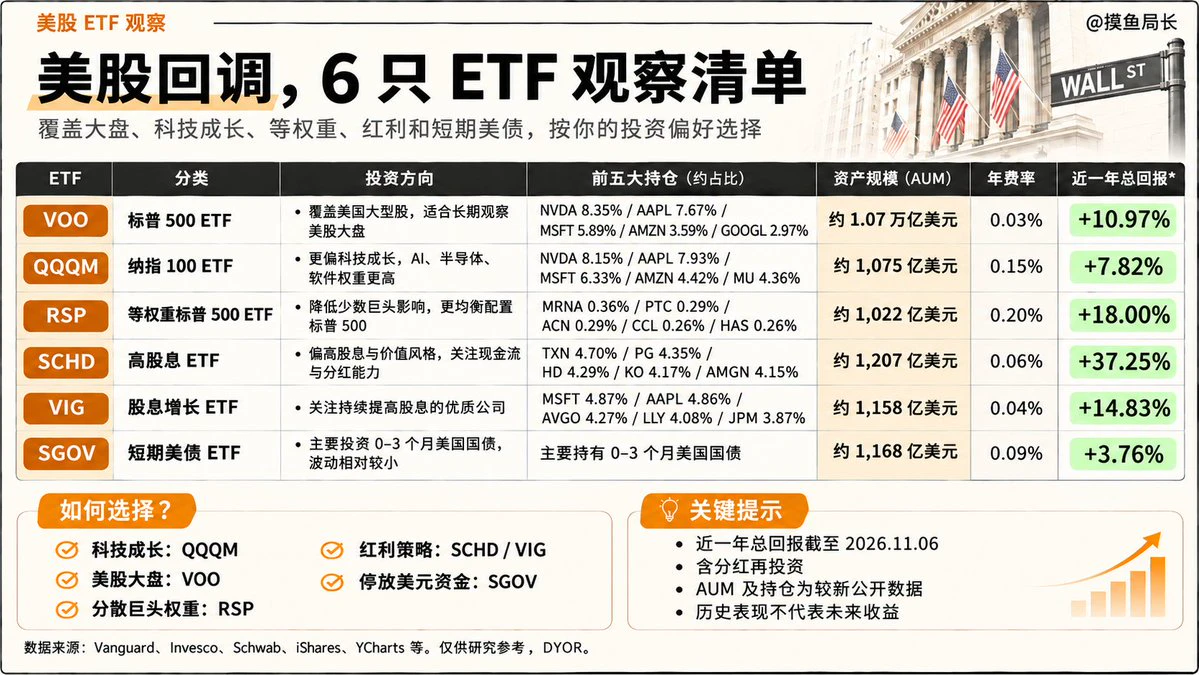
U.S. stocks have fallen so much. If you’re looking to invest for the long term, these 6 ETFs are worth learning about
The Nasdaq has fallen for 4 consecutive weeks, and many tech stocks have also pulled back significantly
If you don’t want to research individual stocks and watch earnings reports every day, consider paying more attention to ETFs
This time, I’ve put together 6 representative U.S. stock ETFs covering tech growth, broad market indexes, dividends, and short-term Treasuries, each with its own features
① $VOO |S&P 500 ETF
It covers around 500 large publicly traded U.S. companies, incl
post-image
NAS100+1.90%
VOO+0.33%
NVDA+2.80%
AAPL-0.57%
MSFT-0.95%
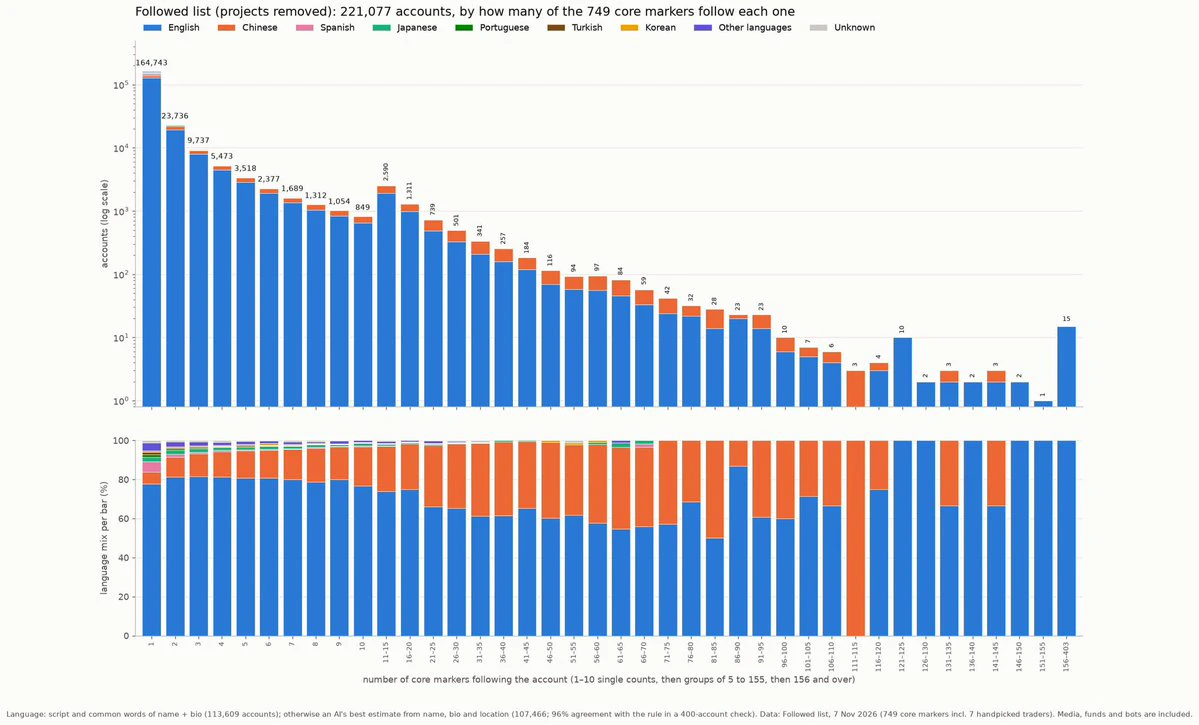
run a huge analysis of top 700 X accs by influence in crypto and who they follow
interestingly, accounts followed by few “influential” accounts tend to be english speaking
but the more influential accounts follow a X user, the more likely it’s either English or Chinese
post-image
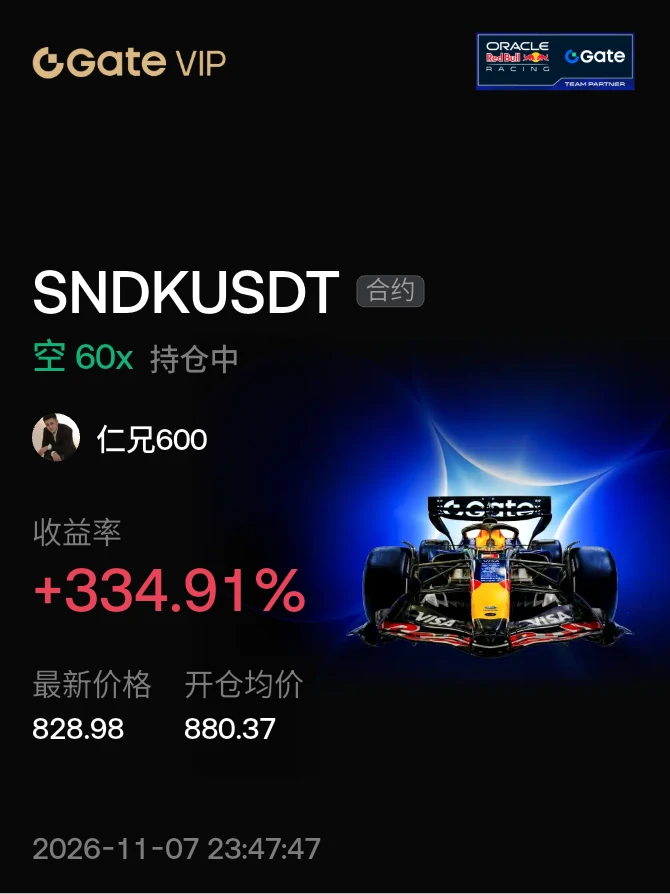
#晒出我的持仓收益 The short position plan has never changed!
post-image
Can Gold Deliver a Super Bull Run? First, Understand Why It’s Valuable

Gold’s long-term value doesn’t come from cash flows. It comes from its unique qualities in extreme conditions: it doesn’t depend on the credit of any single country, can serve as a reserve asset, is globally liquid, and can provide a degree of hedging when confidence in purchasing power, fiscal discipline, and geopolitical stability is shaken.

The core reason central banks continue buying gold isn’t simply that they’re “bullish on gold.” The deeper logic is to diversify reserves, reduce exposure to any single currency, le
GLDX-0.40%
PAXG+0.37%
XAU+0.38%
#每周来晒 #广场交易达人 #WCTCS9

My Basis for Opening Positions—Bitcoin Market Analysis for This Week and Next Week

I previously discussed my plan for opening positions in Bitcoin and ETH next week. Here’s why: an analysis of the current Bitcoin market and my outlook for next week:

I. Technical analysis: After a series of negative blows last week, Bitcoin ultimately failed to hold the key support at 76,500. This means the daily-chart primary uptrend of the bull market that began at 67,000 has come to a complete end. A period of correction is next. Of course, this does not mean prices will fall all th
post-image
BTC-0.65%
Also entered a short on $kas, 2 accounts. In 4 short positions overall right now.
If you want to trade this via Hyro Trader- The crypto propfirm I use. Enter code: FILNFT when registering to save 10%
KAS+0.48%
The U.S. added 165,000 nonfarm payroll jobs in October, far exceeding expectations.
live-cover
LIVE1,903
The latest round of long-short position battles has unfolded, and the scene is quite dramatic.
First, on the bulls’ side, “Machi Big Brother” held a 540 $ET long position worth approximately $1.21 million, using 25x cross margin. The liquidation price was $2203—and the market showed no mercy, breaking straight through it. By contrast, the contrarian traders holding positions in the CORE direction have profited handsomely from going against the market.

Now for the big player on the short side: the largest position was an $ETH short, holding approximately 5318 ETH worth about $11.94 million.
post-image
GOON230458
GOON230458089H3F0H80H
Pump.Fun
MC:$44.14KHolders:1
11.75%
CORE+1.11%
ETH-1.23%
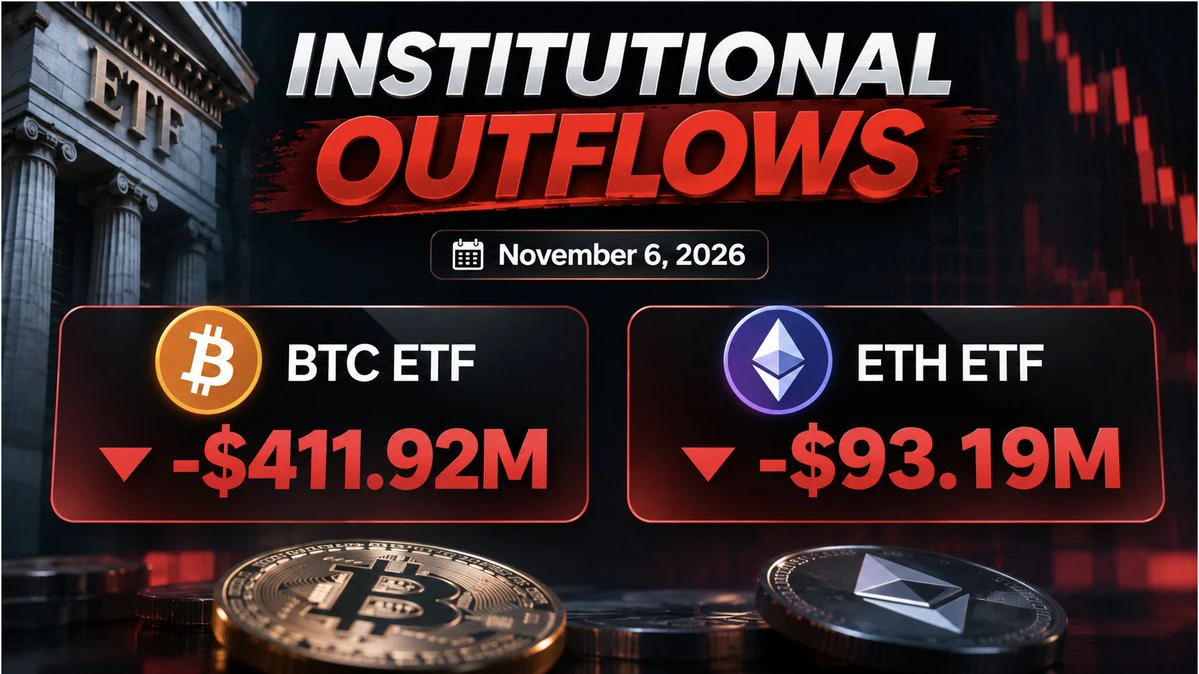
INSTITUTIONAL CRYPTO FLOWS ARE SENDING A CAUTION SIGNAL.
Latest finalized ETF data for November 6:
➡️ Bitcoin ETFs: -$411.92M
➡️ Ethereum ETFs: Approximately -$93.19M
Bitcoin recorded ~$1.92 Billion in outflows across Six finalized sessions.
Ethereum Also recorded ~$2 Billion in outflows across Last 29 finalized sessions.
This doesn't guarantee a market decline.
But sustained institutional outflows are worth monitoring alongside price action and liquidity.
When does institutional demand return?
#BitcoinETF #EthereumETF
post-image
BTC-0.31%
ETH-0.91%
Load More

Join 40 M users in our growing community

⚡️ Join 40 M users in the crypto craze discussion

💬 Engage with your favorite top creators

👍 See what interests you

Trending Topics

USAIStocksHitHard

19.36k Views3.66k Discussing

U.S. stocks sold off sharply on Thursday, November 5 (UTC). The Nasdaq closed down around 5.5%, entering correction territory, while the Philadelphia Semiconductor Index plunged roughly 12%, with chip stocks including $NVDA and $AMD posting steep losses. Beyond profit-taking, investors are growing concerned about the pace of AI data center construction, capital spending, and future returns on investment. The key question now is whether the AI sector’s lofty growth expectations need to be repriced. Where do you think the next opportunities will emerge: chip stocks, tech giants, or other sectors?

USNonfarmPayrolls

30.25k Views4.32k Discussing

StakeOnLaunchpoolToShare450KVLX

7.48k Views809 Discussing

View More