












Square
Following
Hot
News
Profile
Share your thoughts
placeholder
Article
Bullish on $PARTI .Position Entry: 0.02823 - 0.02886Profit Target 1: 0.03015Profit Target 2: 0.03143Risk Limit: 0.02710Catching the knife at lows for a quick oversold bounce. Let's print!Support the idea here.Watching this market pair: $Q and $EPIC .
post-image
PARTI-17.18%
EPIC+23.19%
  • 1
$INTC just printed a close at $90.02, with a jaw-dropping RSI of 21.19—deep in oversold territory, yet selling pressure remains relentless. The next key battleground is the $85.84–$81.81 support zone, where history says bounces can get violent and unpredictable.
INTC-5.78%
Trenches
AGT
A
bade
b
AGT
0x5d...e274
Market Cap
$.
Change
.
24h Vol
$.
Holders
.
CNPY
C
bade
b
CNPY
0xc6...ddd2
Market Cap
$.
Change
.
24h Vol
$.
Holders
.
Q
Q
bade
b
Q
0xc0...0589
Market Cap
$.
Change
.
24h Vol
$.
Holders
.
Gato
G
bade
b
Gato
55A3...pump
Market Cap
$.
Change
.
24h Vol
$.
Holders
.
DOPE
D
bade
b
DOPE
0xf9...8899
Market Cap
$
Change
.
24h Vol
$.
Holders
.
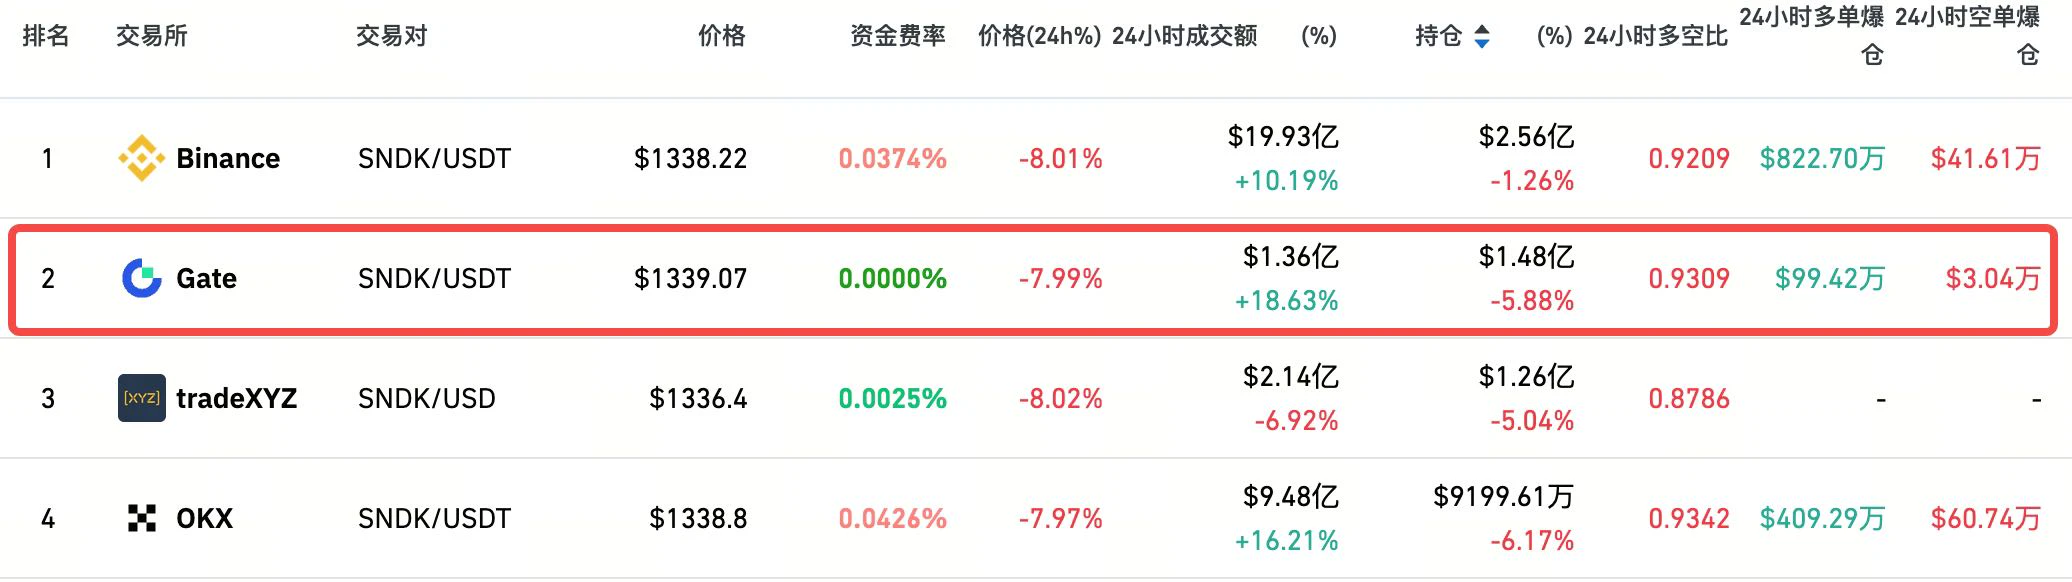
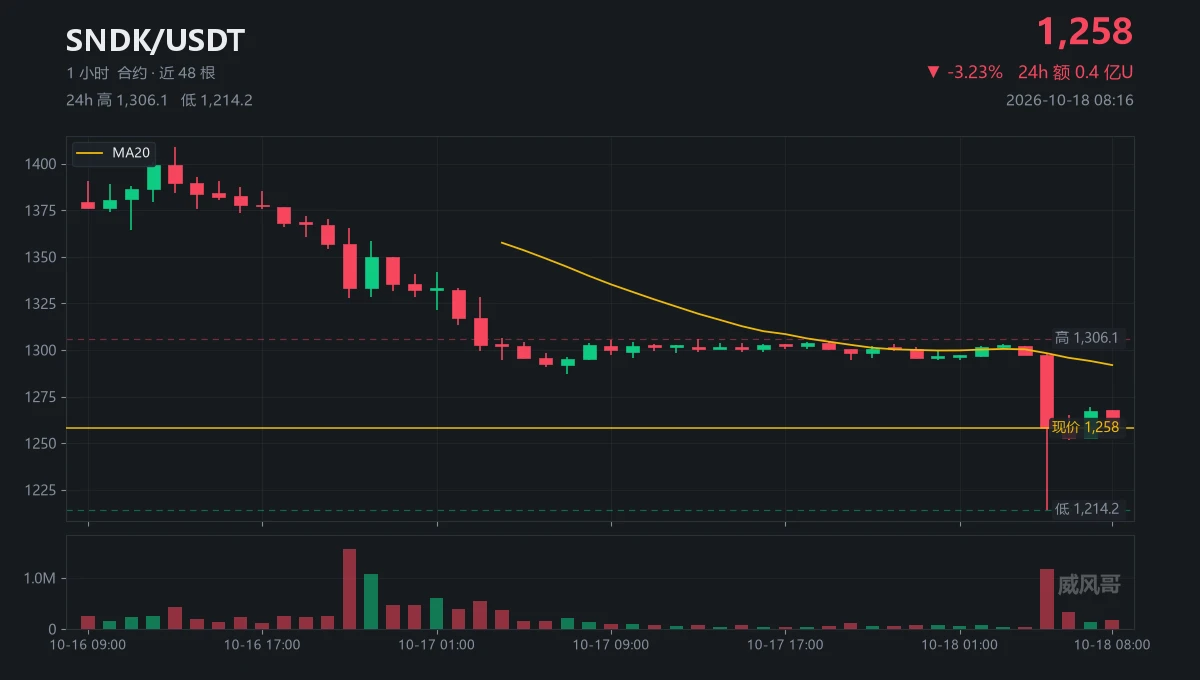
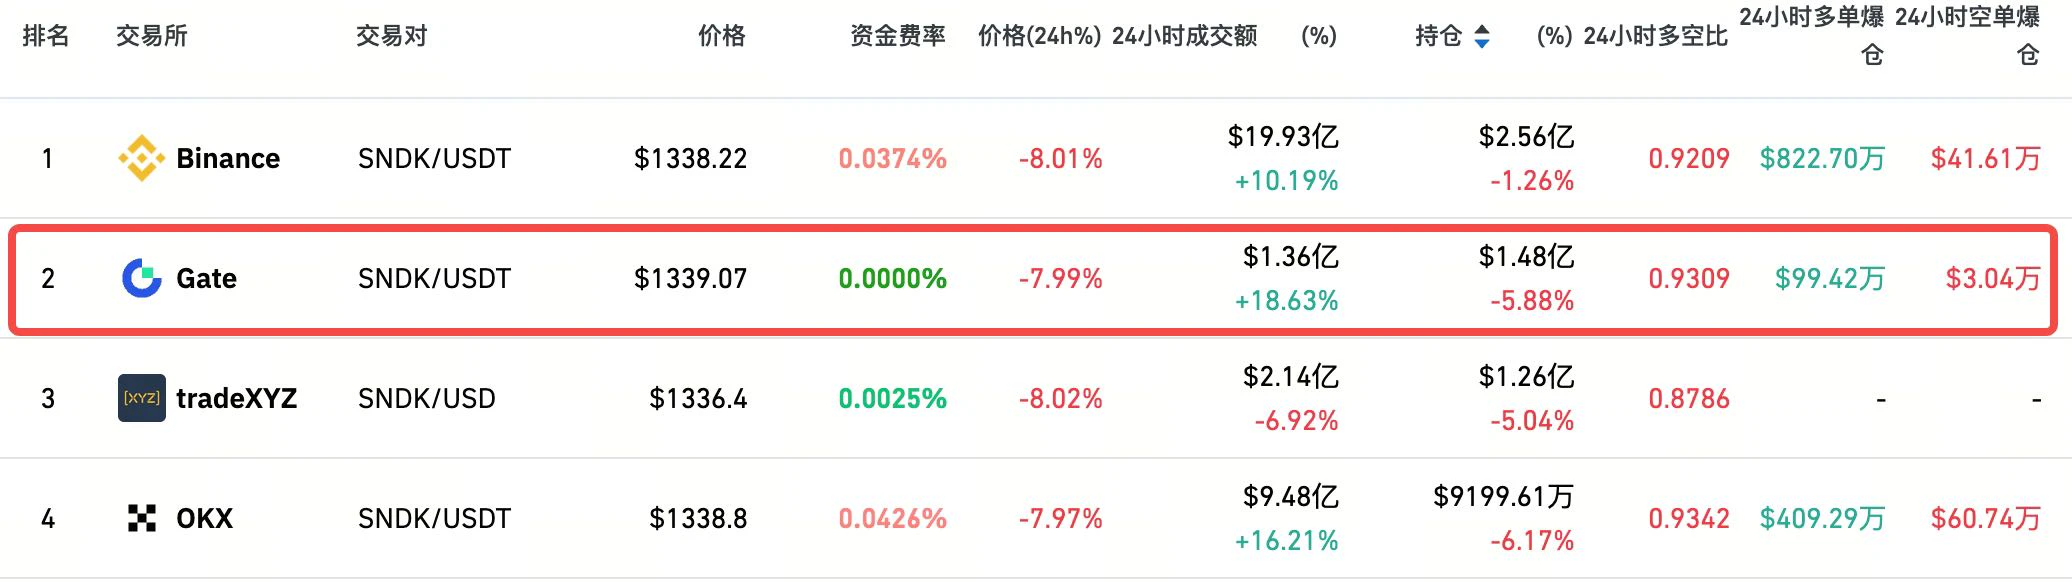
After going through forty-eight candles, there’s one I’m not comfortable fast-forwarding through.
A wick spike.
The 05:00 candle plunged to 1214.16, while the previous one was still above 1297.
Volume picked up: 1.17 million in a single hour, compared with just 35,000 in the previous one.
It rebounded to 1269.44 over the next three hours, but has now slid back to 1257.97.
The peak at 1408.95 was reached at 13:00 on 10-16; after that, each high kept moving lower.
$SNDK In forty hours, it went from 1408.95 to 1214.16, a drop of 13.8%.
As usual: a low formed on heavy volume only counts if it hold
post-image
SNDK-2.76%
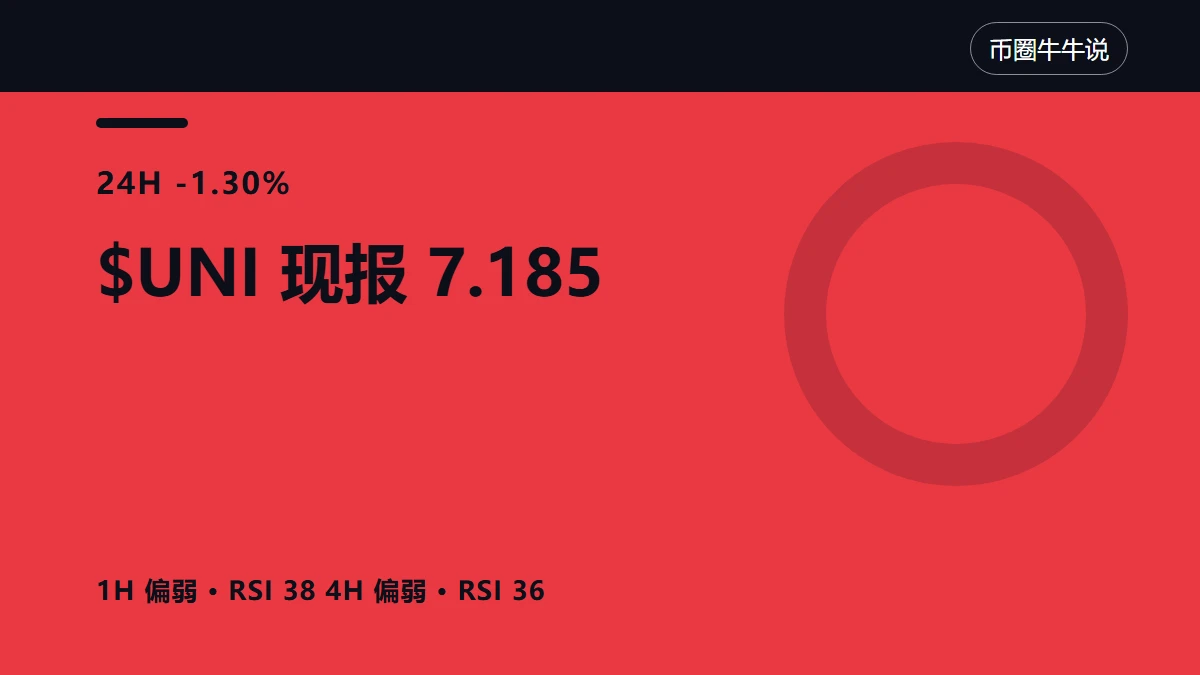
$UNI has reached 7.185 USDT, but one-hour trading participation is only 0.66x, showing some weakness. The price is approaching the one-hour resistance at 7.36, but whether it can truly break through and hold remains to be seen. This looks more like a tentative breakout than a genuine hold.
The price has reached the threshold, but touching, breaking through, and holding are three different things. If $UNI can decisively break above 7.36 and stay above that level, it would be a positive signal. But if the price fluctuates repeatedly around 7.36, or even falls back to the one-hour support at 6.99
post-image
UNI-1.15%
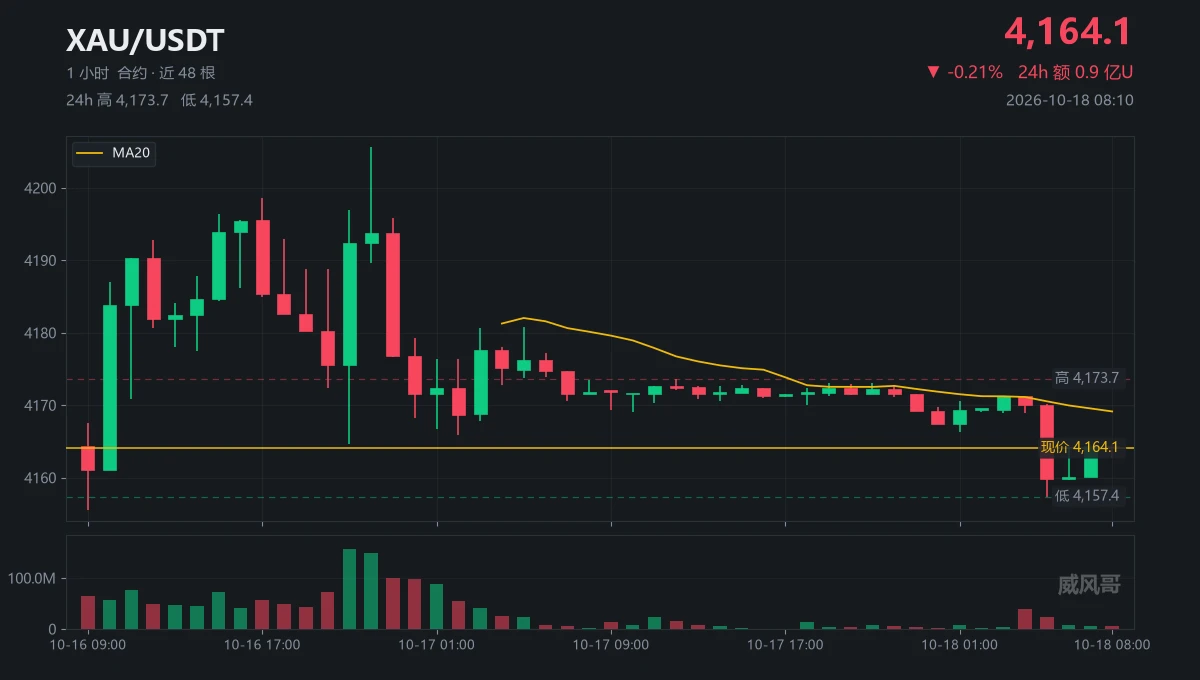
Let’s start with a term: weekend gold prices.
The $XAU on screen isn’t gold moving now; it’s quotes with no takers shifting around.
Only 5.97 million traded in the last hour, compared with 150 million in a single hour a few days ago.
“Breaking above 4205 means a new rally.”
I’ve heard that twice in the past three days. Here are the numbers:
1. 4205.65 was touched only once, at 10-16 22:00, and it hasn’t gone higher since.
2. Since then, over the past 34 hours, it has steadily ground back to 4164.07.
3. The 24-hour range is 4157.36 to 4173.66, a spread of 0.39%.
With a range this narrow, it’s
post-image
XAU-0.17%
Who opened your crypto wallet before it reached your hands?
The hackers didn't need to break Ledger's security when they could just get to the wallets before their owners.
Quick Take
⚠️ Personal market analysis only. NFA — manage risk and DYOR.
Educational content, not investment advice or a recommendation to buy, sell, deposit, or withdraw any asset. No paid promotion or referral/affiliate links.
post-image
🤖 NEW PREDICTION MARKET: Can Gemini 4 Argon (High) finish first on Oct. 19?
Gemini 4 Argon (High) leads at 93.5% in the Oct. 17 snapshot. Rivals need an eligible Text Arena entry; the noon ET ranking decides the result.
post-image
Money is already piling in to assets pre-market, have they forgotten how these external markets operate? Its about to get very violent.
Hyperliquid, slaughter house edition.
post-image
HYPE-1.87%
$BTC Tonight’s market action is interesting. I’m still watching. What’s really worth keeping an eye on isn’t these minute-by-minute moves in BTC, but the Altcoin Season Index climbing from 50 to 60—a frustrating middle ground, neither here nor there. It shows that capital is starting to venture out from BTC, but we’re not yet at a full-on risk-on phase: 60 looks more like the “early stages of rotation,” still a long way from the 80–90 range where everything has historically taken off. In other words, altcoins have potential, but it’s not time to sit back and expect easy gains just yet.
celesti
post-image
BTC+0.03%
TIA-5.59%
For subscribers, I placed a long order at 2365, but I accidentally placed mine at 2355—ugh!
  • 1
October 18 Strategy Plan Priority Ranking, For Followers Only
Current Best Assessment
At the current price of around 2396:
Do not chase longs
Do not chase shorts
Wait for the price to enter a key area
My priority ranking:
Short if rejected at 2403–2418
Go long if it holds near 2380
Go long after a breakout above 2405 and a confirmed retest
If it breaks below 2378 directly, wait for a failed rebound before considering a short
If it holds above 2428 convincingly, cancel the intraday bearish bias
$ETH
post-image
ETH-0.62%
$PI If you insist on holding and refuse to sell, capital will insist on staying out of the market. The price will keep fluctuating, wearing you down until you’re completely broke—then let’s see if you’ll finally cut your losses. Capitalists have plenty of money and no urgency. But you’re poor and need money for all sorts of things; you can’t wait.
Someone asked, “When will it go up?” A rise may only happen after all of you have sold the coins you’re holding.
post-image
PI-0.84%
  • 3
Market anylysis today BTC and other coin 👛🪙
live-cover
LIVE1,735
It tested below that moving average again, but it just couldn't hold. $ARB quickly proved that shorting today was the right call. This trade made a 60% profit, a result that's hard to argue with. Notably: : Current price 0.23321 - 24-hour gain: +20.11%$AGT : Current price 0.083382 - 24-hour gain: +40.11%
post-image
GTC
GTC芝麻币
Gate.Fun
MC:$0.1Holders:1
0%
ARB-4.14%
AGT+15.72%
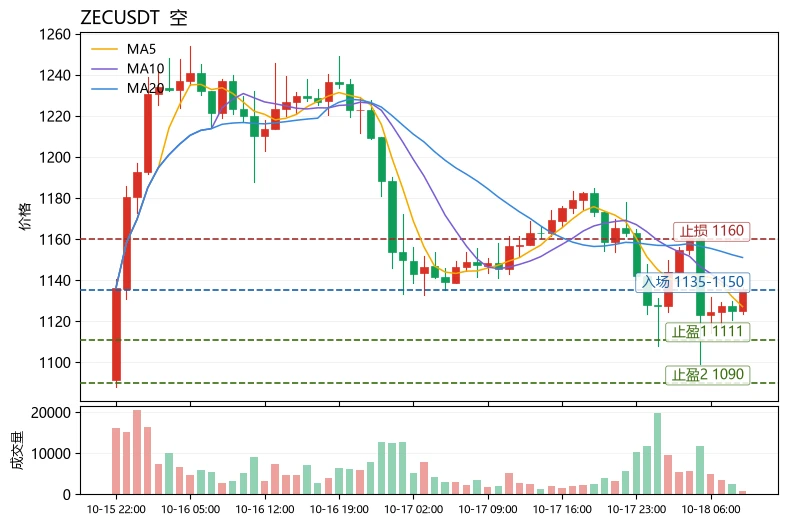
The most unusual detail in today’s market: $ZEC fell just 0.99% in 24 hours, yet its range reached 7.56%. The price repeatedly tested the lower Bollinger Band at 1111.11, while the funding rate remained positive at 0.0058%—longs are paying to hold positions, and shorts are not crowded. This combination of “small decline + high volatility + positive funding rate” suggests that positions are changing hands rather than being flushed out, and volatility is being underestimated.
Technical outlook: MA5=1127.15 is below MA20=1151.07, the MACD histogram at -1.335 remains bearish, and RSI=43.6 is in t
post-image
TIA-5.59%
#日韩股集体大跌
KOSPI +3.3%: A relief bounce or the start of a recovery?
My initial assessment: This appears to be a potential relief rally; however, a single strong session is not enough to confirm a broader recovery. The key question is whether semiconductor stocks can sustain this rebound following the sharp sell-off, or if the gains are merely driven by short covering and bargain hunting.
The gains seen in Samsung Electronics (+3.6%) and SK Hynix (+3.4%) are particularly significant, as the South Korean market is highly sensitive to semiconductor sentiment and the global AI-memory trade.
What is
post-image
ybaser
#日韩股集体大跌
KOSPI +3.3%: A relief bounce or the start of a recovery?
My initial assessment: This appears to be a potential relief rally; however, a single strong session is not enough to confirm a broader recovery. The key question is whether semiconductor stocks can sustain this rebound following the sharp sell-off, or if the gains are merely driven by short covering and bargain hunting.
The gains seen in Samsung Electronics (+3.6%) and SK Hynix (+3.4%) are particularly significant, as the South Korean market is highly sensitive to semiconductor sentiment and the global AI-memory trade.
What is driving the recovery?
1. The sell-off may have overshot the fundamentals
On October 15, the KOSPI fell by 7.57%, closing at a six-month low following seven consecutive days of losses. During this sell-off, Samsung and SK Hynix lost 23.9% and 31.5% of their value, respectively—creating an opening for bargain hunters to return.
2. Memory chip fundamentals remain supportive
Analysts continue to highlight tight memory supply, robust demand related to artificial intelligence, and expectations for rising DRAM prices. This supports the view that the sell-off was driven more by sentiment and positioning than by a collapse in earnings expectations.
3. Global risk appetite has improved
A recovery in U.S. equities, combined with easing concerns regarding AI-related credit risks, has helped fuel a rebound in Asian technology stocks. However, concerns regarding returns on investment in artificial intelligence, financing costs, and interest rates have not dissipated.
A relief rally or a sustainable recovery?
Bullish scenario — a lasting recovery
* The KOSPI remains above its recent low.
* Samsung and SK Hynix continue their recovery.
* Foreign investors return as net buyers.
* Earnings forecasts and expectations for memory chip prices remain robust.
Bearish scenario — a short-lived rebound
* The index rises toward a resistance level and then reverses.
* Foreign investors continue to sell Korean stocks.
* U.S. bond yields rise, or renewed concerns regarding AI valuations weigh on chip stocks.
* Samsung and SK Hynix fall back below their recovery levels.
What should investors watch for next?
The most critical indicator is not the magnitude of the initial rebound, but whether buying pressure is sustained.
Indicator Bullish interpretation
Foreign investor flows Consistent net buying
Samsung and SK Hynix Gains sustained over several sessions
Memory chip pricing Continued strength in DRAM and HBM
U.S. Treasury yields Stabilization or decline
Earnings expectations Maintenance of upward revisions
A key distinction: On October 16, the KOSPI recorded an intraday gain of up to 3.17%, but closed the day up 2.05% at 5,668.05. Consequently, the sharp intraday rally made the final gain at the close appear more significant than it actually was.
My View
Short-term: Cautiously optimistic
A recovery is possible.
Oversold conditions and attractive entry points could support further gains, though volatility is likely to remain high.
Medium-term: Conditional
Not yet confirmed.
A more substantial recovery would require the stabilization of foreign investor inflows, supportive earnings data, and a more durable improvement in sentiment toward the global technology market.
In summary: I view the 3.3% move not as proof that the downtrend has ended, but as a promising first step. Earnings expectations for the semiconductor sector provide a firmer foundation for this recovery—moving it beyond a mere technical rebound—but the market must demonstrate that buyers are willing to hold their positions, even amidst renewed volatility.
A key factor to watch in the near term will be the earnings outlooks from SK Hynix and Samsung Electronics, set to be released on October 28 and October 29, respectively. These reports could prove decisive in determining whether the recent sell-off was an overreaction or if it reflects a more fundamental reassessment of the AI-driven memory market.
$MU ‌
$SNDK ‌$NVDA ‌
repost-content-media
  • 5
EIA data determines the short-term direction of crude oil
live-cover
LIVE65
#美股存储板块跌幅扩大
The core question is whether this represents a healthy correction following a rally driven by artificial intelligence (AI), or the beginning of a deeper repricing process within the storage sector. Rather than buying simply because prices have fallen, it would be more prudent to focus on earnings expectations, memory pricing, and whether each company can maintain its profit margins.
My perspectives on storage sector stocks:
* Micron (MU): Monitor demand for DRAM and HBM, memory growth linked to AI, and gross profit margin forecasts. Strong AI demand could bolster earnings, though
post-image
ybaser
#美股存储板块跌幅扩大
The core question is whether this represents a healthy correction following a rally driven by artificial intelligence (AI), or the beginning of a deeper repricing process within the storage sector. Rather than buying simply because prices have fallen, it would be more prudent to focus on earnings expectations, memory pricing, and whether each company can maintain its profit margins.
My perspectives on storage sector stocks:
* Micron (MU): Monitor demand for DRAM and HBM, memory growth linked to AI, and gross profit margin forecasts. Strong AI demand could bolster earnings, though these expectations may already be priced into the stock.
* SanDisk (SNDK): Focus on NAND flash pricing, demand for enterprise SSDs, and the sustainability of any earnings recovery. NAND supply and price cycles can make this stock particularly volatile.
* Western Digital (WDC): Evaluate "nearline" (high-capacity/accessible) HDD demand from AI data centers, cloud computing expenditures, and free cash flow. The factors influencing HDD demand differ from those affecting NAND and DRAM.
* Seagate (STX): As data center storage requirements grow, keep an eye on demand for high-capacity drives, pricing power, and profit margins.
* Track NAND market conditions, enterprise SSD adoption rates, and the company's valuation relative to earnings expectations.
What signs might justify rebuilding a position? I would look at the following three points:
* Stabilization of fundamental indicators: A halt in the deterioration of memory and NAND prices, company forecasts, and earnings estimates.
* Confirmation through price action: Stocks forming higher lows and reclaiming key moving averages, accompanied by stronger trading volume.
* Attractive valuation: Expected earnings growth that justifies the current price, even under less optimistic scenarios.
A decline in a stock price is not, by itself, a buy signal. If earnings estimates are falling faster than the stock price, the valuation may not have actually become cheaper.
Rather than buying the entire storage sector indiscriminately, I prefer to differentiate between individual companies. While AI demand serves as a long-term tailwind, memory, NAND flash, and hard disk drives each have their own unique supply cycles, competitive pressures, and profit margins.
An important distinction: A pullback driven by profit-taking is fundamentally different from one caused by weak forward guidance or falling memory prices. The latter scenario warrants a much more cautious approach. Which of these stocks—MU, SNDK, WDC, or STX—are you following most closely? I can help you compare their valuations, earnings outlooks, technical levels, and the potential factors that could support a recovery.
$MU ‌$SNDK ‌$WDC ‌$STX ‌
repost-content-media
MU-5.66%
SNDK-6.90%
  • 7
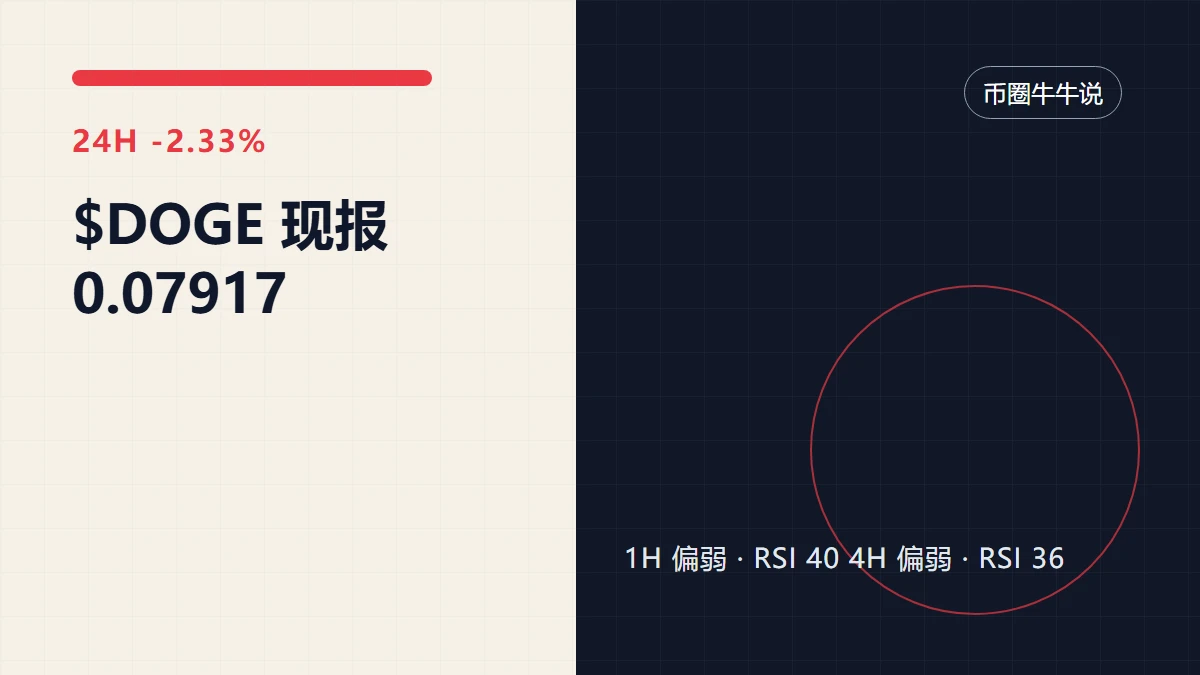
Find opportunities in $DOGE using price-volume confirmation; key levels and exit lines are here
What stands out most in this $DOGE chart is not the 2.33% 24-hour decline itself, but that the 1-hour and 4-hour charts are both weak yet haven’t delivered the same answer.
My view is that direction is taking shape for now, but low participation has reduced the credibility of this move.
$DOGE The current price is 0.07917, with a 24-hour range of 0.07702–0.08107. The 1-hour support is at 0.07702, with resistance at 0.08096; the two more distant 4-hour boundaries are 0.07702 and 0.08566. These numbers
post-image
DOGE-0.92%
10.17$ETH
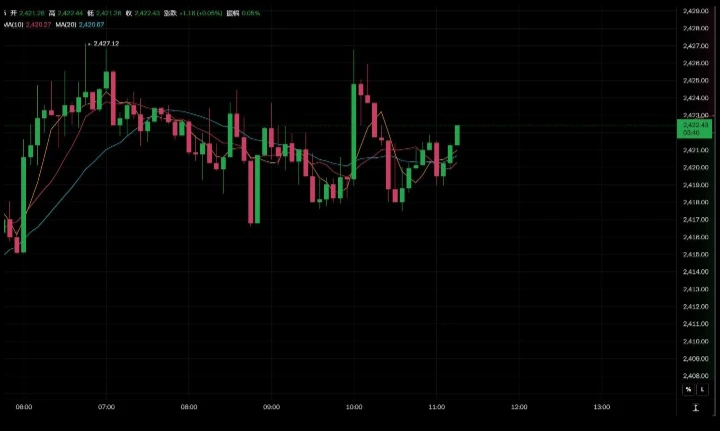
Last night's market action was like riding a roller coaster
Longs launched a fierce attack, then suddenly collapsed, smashing straight through 2400
Upside momentum faded; I cut losses decisively in time, exited at breakeven, and avoided a deep pullback
Price is now stuck in a narrow 2415-2425 range
Moving averages are converging near 2420, with bulls and bears evenly matched
Volatility is under 10 points—the calm before the storm!
The range is tightening and building momentum, with a major one-way breakout imminent
Watch the range closely; once volume expands and direction emerges,
post-image
ETH-0.60%
Load More

Join 40 M users in our growing community

⚡️ Join 40 M users in the crypto craze discussion

💬 Engage with your favorite top creators

👍 See what interests you

Trending Topics

USSeptemberPPIBeatsExpectations

91.35k Views1.93k Discussing

US September PPI came in at 6.3% YoY, well above the 5.3% market expectation, pointing to renewed producer-side inflation pressure. Weekly jobless claims were 199K, broadly in line with forecasts. Could hotter inflation further reduce room for rate cuts, and what does it mean for $BTC, US stocks, and gold?

GateWCTCS9GlobalTradingCompetition

37.87k Views6.68k Discussing

GateBTCAndETHFuturesVolumeRanksTop3

53.8k Views1.82k Discussing

View More