Square
Following
Hot
News
Notifications
Profile
Share your thoughts
placeholder
Article
I just saw a liquidation record that made me even more confident in my bearish view on $TRUMP
: a trader’s $2.68 million short position was liquidated outright. More importantly, he had already taken a hit on Bitcoin before. After two consecutive blowups, he still dared to put such a heavy short position on a small-cap contract with only $30 million in open interest. This was simply a lack of risk management, and it’s no surprise he got stopped out. The short liquidation shows that the price did surge upward at one point, but the rally did not reverse the overall direction.
The current price i
post-image
TRUMP-0.90%
Notice how Protestants have no issue calling each other brothers in Christ but condemn the apostolic Churches for referring to their priests as “Father” without understanding what Jesus meant
St-Paul told the Christians in Corinth the he was “their father in Christ” - 1 Cor 4:15
post-image
Trenches
ZIG
Z
bade
b
ZIG
0x8c...1145
Market Cap
$.
Change
.
24h Vol
$.
Holders
.
BTC
B
bade
b
BTC
C5xp...pump
Market Cap
$.
Change
.
24h Vol
$.
Holders
.
STONK
S
bade
b
STONK
6GmA...UNgx
Market Cap
$.
Change
.
24h Vol
$.
Holders
.
José
J
bade
b
José
87CQ...1UJT
Market Cap
$.
Change
.
24h Vol
$.
Holders
.
IDOL
I
bade
b
IDOL
0x3b...ab07
Market Cap
$.
Change
.
24h Vol
$.
Holders
.
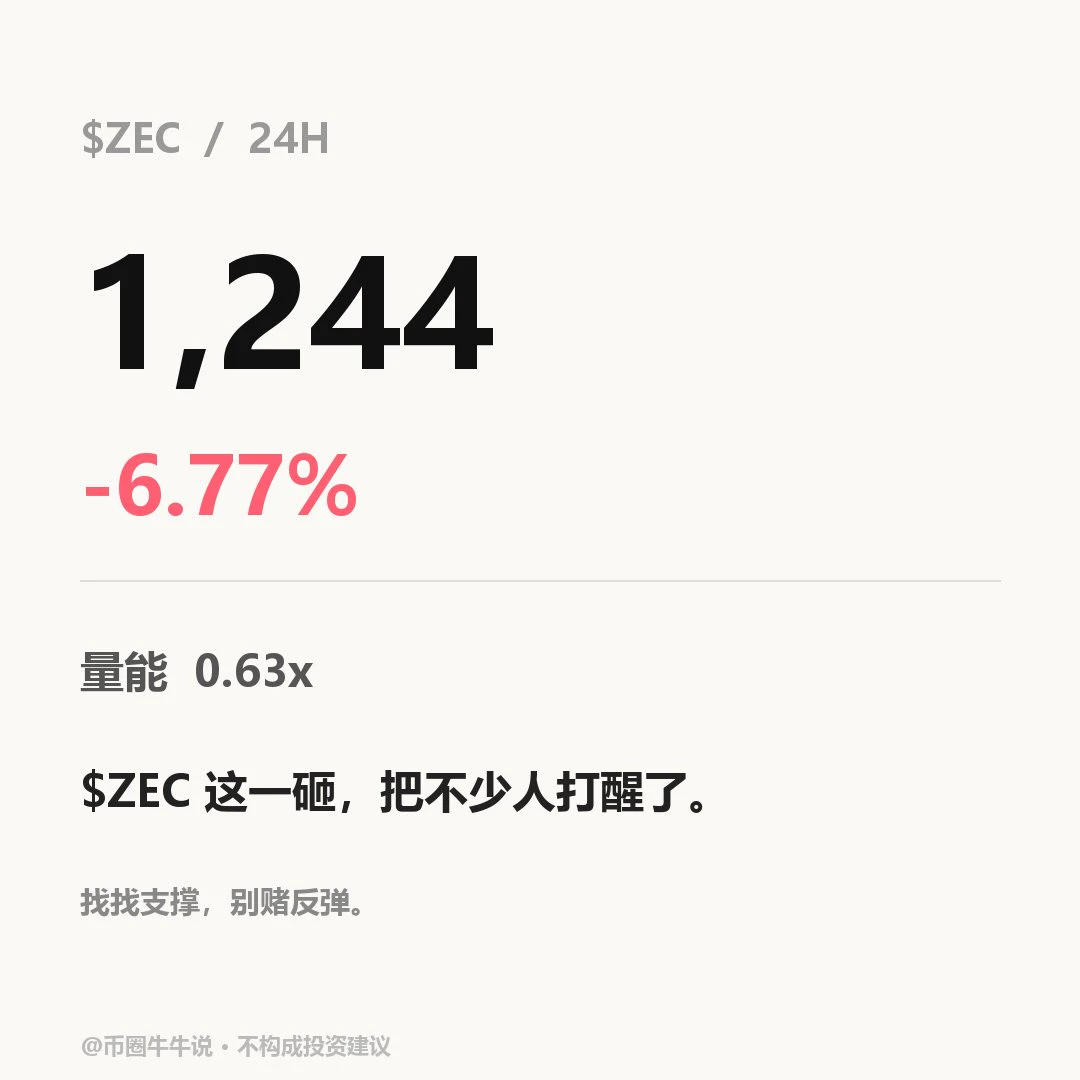
$ZEC Currently at 1243.6, down 6.77% over 24H (range: 1236.65–1364.08). The 1H trend is weak, with RSI at 12.21 (oversold); price is below the EMA20 at 1282.57, and the volume ratio is 0.63. The 4H trend is weak, with RSI at 50.99; price is below the EMA20 at 1282.62, with support at 1159.00 and resistance at 1387.89. If price holds above the 1364.08 resistance, watch for continuation; a break below the 1236.65 support would weaken the structure. Follow up by checking whether price holds above 1364.08 and reclaims 1236.65; volume is only 0.63x. A hold without volume or a failure to reclaim the
post-image
ZEC+1.16%
$TUT /USDT RANGE FADE Sellers Testing Resistance

$TUT /USDT

Direction: SHORT

Entry: 0.0169700

Stop Loss: 0.0174889

Targets
TP1: 0.0165808
TP2: 0.0163214
TP3: 0.0159322

TUT has been chopping in a wide range after the sharp mid-week drop, with price now sitting right around MA7 (0.01703), MA25 (0.01707) and MA99 (0.01706) essentially glued to all three averages. This is a fade of the recent bounce attempt rather than a clean trend short.

$TUT ‌
TUT-1.66%
Why do you have to add “meow” to the end of everything you say? What are you even meowing about?!
post-image
OpenAI CFO: Data center investments will not change due to the midterm elections.
live-cover
LIVE43
$SOL Short Setup Update 👀

On the 4-hour timeframe, I’m preparing to enter a short position around 89.0. The key is whether sellers can continue to hold this area down.
Price is still trading below the EMA50. I want to see whether it gets pushed back down here again. If a 4-hour candle closes above 89.7, this setup is invalidated. Of course, I could be wrong, so I’ll monitor it as it develops.
The current price on the 4-hour chart is 89.0, with the EMA50 at 93.3. Price remains below it, making the structure more favorable to the bears. The stop-loss risk on this trade is about 0.76%, while th
post-image
SOL-0.74%
Old Trump really does keep his word and follow through. He said he’d wipe out Iran’s whole family after the midterms, and then he actually did it.

Here we go again: a familiar weekend “limited strike” on the Strait of Hormuz.

After the strike, he said Iran was very eager to reach a deal. Iran’s Security Council replied that it wants to see concrete action from the U.S. and won’t accept promises on paper.

Now that the Democrats are in power, can they rein Old Trump in? Stop using Iran to draw candlestick charts. Leave Iran alone—and leave us alone too, okay?
The Nightmare of Every Trader!
post-image
  • 2
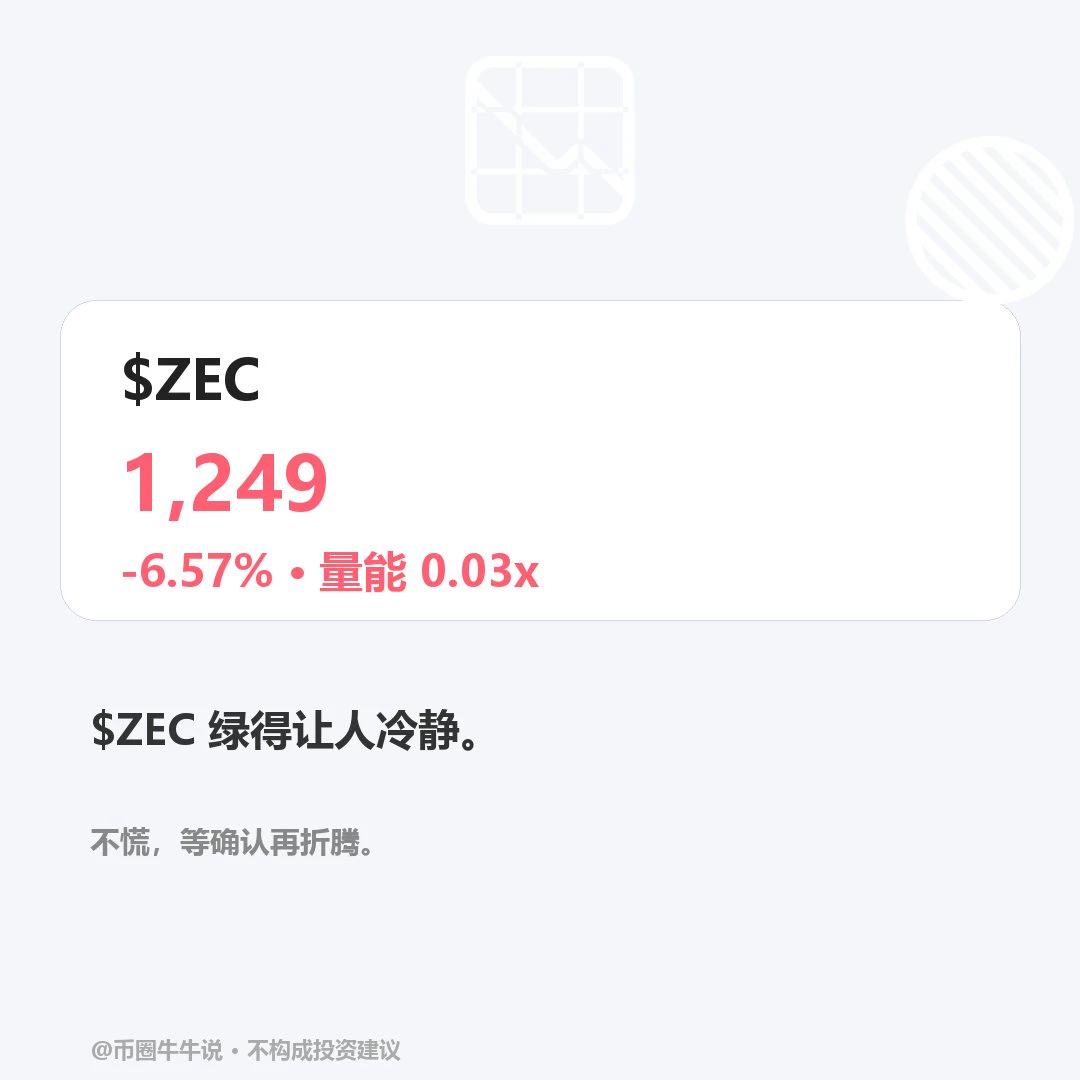
$ZEC Currently at 1248.69, 24H -6.57% (range 1236.65–1364.08). The 1H trend is weak, with RSI14.07 in oversold territory; price is below EMA20 at 1279.88, and the volume ratio is 0.03. The 4H trend is weak, with RSI51.89; price is below EMA20 at 1283.09. Watch for a sustained move above the 1364.08 resistance; a break below the 1236.65 support would weaken the structure. For review, check whether price holds above 1364.08 and reclaims 1236.65; volume is only 0.03x. A low-volume hold or a breakdown that is not reclaimed would invalidate the setup. Markets are volatile; for observation only.
post-image
ZEC+1.16%
Berkshire Hathaway reported third-quarter operating earnings of $12.705 billion (down 5.8% year-over-year) while accelerating its share repurchases to a record $9.6 billion under CEO Greg Abel.
‍#ShareWeekly #USAIStocksHitHard
post-image
BRKB-0.20%
Boom 💰$ONE Congratulations to everyone who joined us. All targets have been reached 0=002000 Keep an eye on it, secure your profits. Congratulations to you 🎉🤑💰👇
post-image
ONE-1.19%
$Bull Run is staging a strong bullish rebound, up more than 10% and nearing the $0.0600 resistance level! If the breakout is confirmed, the rally could extend to $0.0630. Trading plan (long): Entry: $0.0585 – $0.0593 Target levels: $0.0600 / $0.0615 / $0.0630 Stop-loss: $0.0570
post-image
牛来-1.82%
$TRX Short, sellers need to hold 0.320 on the 4H chart. Price is right below EMA50. I’d like to see a wick that spikes up and gets rejected, rather than price slowly breaking through it. That’s the whole idea. Quick read: - Price is 0.320 on the 4H chart, below EMA50 at 0.320; sellers still control the trend - 1H RSI is 68; the hourly timeframe is overheated - The daily price is below EMA200 at 0.326; the higher timeframe also supports this view. Short 0.3202–0.3204 Take profit 0.3199 / 0.3196 / 0.3192 Stop loss 0.3210 Not financial advice; do your own research.
post-image
TRX+0.42%
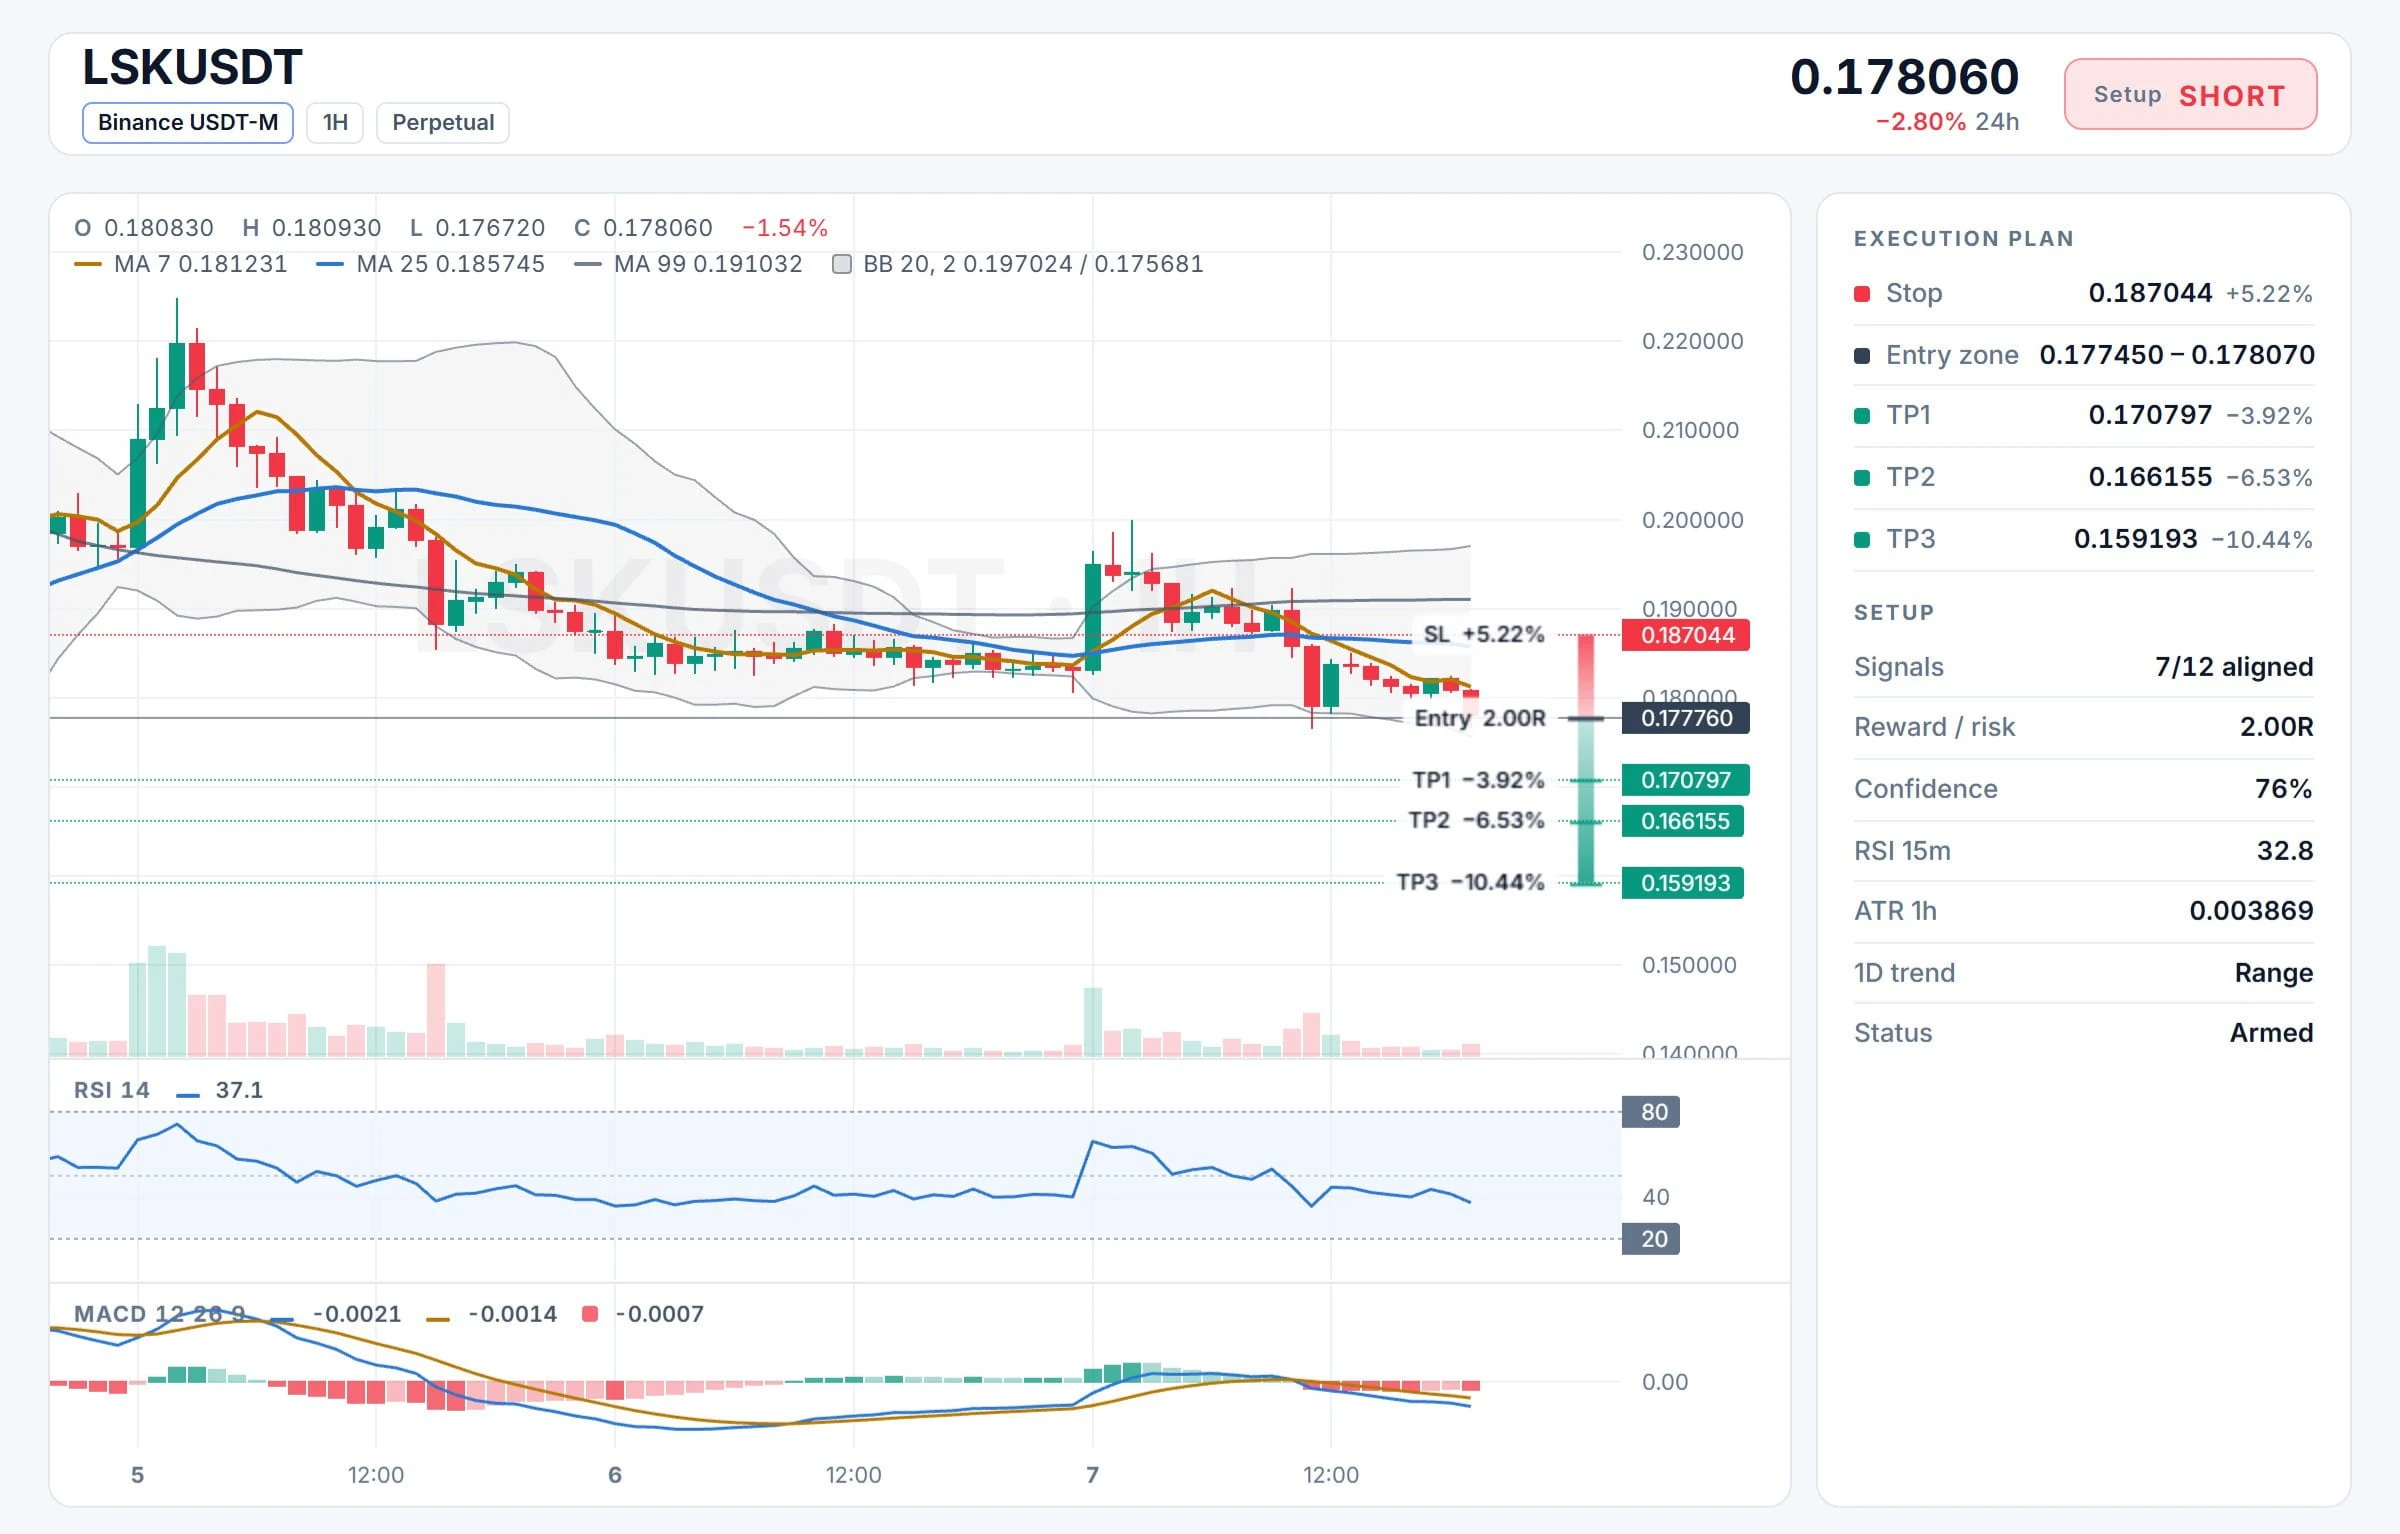
$LSK /USDT BREAKDOWN CONTINUES Clean Sell Signal

$LSK /USDT

Direction: SHORT

Entry Zone: 0.177450 – 0.178070

Stop Loss: 0.187044

Targets:
TP1: 0.170797
TP2: 0.166155
TP3: 0.159193

LSK rejected from the recent bounce high near 0.195 and is now trading below MA7 (0.18123), MA25 (0.18575) and MA99 (0.19103) a full bearish MA stack. Price just broke down sharply from the consolidation right at current levels, confirming sellers back in control.

$LSK ‌
post-image
LSK-5.22%
Crypto Market update
live-cover
LIVE56
I just added another entry trade on $IDOL targeting 0.0305-0.0270
post-image
IDOL-6.71%
$GTC A large -10% bearish candle slammed the price down to 0.1643, just 0.0001 above the 24-hour low. This isn’t a pullback; the bulls’ defense line is being ground into the dirt.
Breaking down the technicals: from 0.1864 to 0.1643, the day’s range exceeded 13%, with a trading value of 20.3M—a high-volume decline, not a low-volume shakeout. The candle closed near its low, showing that selling pressure had not been fully absorbed by the end of the session—a classic bearish-control structure. The 0.1659 level is an awkward spot: above, 0.1720 is neckline resistance for today’s continuation of th
Load More

Join 40 M users in our growing community

⚡️ Join 40 M users in the crypto craze discussion

💬 Engage with your favorite top creators

👍 See what interests you

Trending Topics

USAIStocksHitHard

21.44k Views3.68k Discussing

U.S. stocks sold off sharply on Thursday, November 5 (UTC). The Nasdaq closed down around 5.5%, entering correction territory, while the Philadelphia Semiconductor Index plunged roughly 12%, with chip stocks including $NVDA and $AMD posting steep losses. Beyond profit-taking, investors are growing concerned about the pace of AI data center construction, capital spending, and future returns on investment. The key question now is whether the AI sector’s lofty growth expectations need to be repriced. Where do you think the next opportunities will emerge: chip stocks, tech giants, or other sectors?

USNonfarmPayrolls

35.66k Views4.35k Discussing

StakeOnLaunchpoolToShare450KVLX

10.5k Views830 Discussing

View More