



Share your thoughts
placeholder
Article
First signs of weakness on this massive PONS move. I think it would be good if it consolidated/pulled back here, that money flows into other tokens on RH chain and then we repeat with another leg up later.
Same as the BTC stalls > alts run loop we usually do, but RH specific.
post-image
PONS+25.75%
BTC+0.25%
bitcoin:native
The journey to November 2029 has begun!
post-image
BTC+0.25%
I originally wanted to cut my losses and sacrifice the meat to the heavens, but the ritual failed—the meat roasted itself. 🔥 While everyone else was running, I took another look at the order book.
At the time, the screen was filled with panic, but the bottom held steady, funds quietly entered, and the volume-price action was not bad. I judged that this was just a fake drop, so I opened a long position around 216.97 without hesitating for too long. The market has now reached 231.06, with a +604.09% return. Nailed it.
The early phase was truly sluggish, but the breakout feels just as rewarding.
post-image
LAB+0.31%
ZEC+0.15%
【$BULL Signal】Funding rate at 0.14%, relatively high; target short-term longs amid 1H high-level consolidation
$BULL Funding rate at 0.1406%, with extremely high long holding costs. After surging to 0.0924 on the 1H timeframe, price fell back to around 0.0816, with buy-side depth imbalance at -12.89% and sell orders slightly dominant. The 4H MACD histogram has contracted continuously, indicating weakening momentum. The 1H MACD histogram is 0.0001, moving along the zero axis. In terms of order-book depth, the Bid/Ask depth ratio is 0.77, indicating average buying support. The current price is n
post-image
BTC+0.25%
ETH+1.15%
SOL+1.30%
I originally just wanted to mooch a breakfast, but the market ended up making dumplings out of me for half a year. I opened the charts this morning, and before my eyes were even fully open, I saw the price bubbling up on its own. A few days ago, while watching the market in the early hours, $TAC had been moving sideways at the bottom. Everyone was waiting and watching. I stared at the order book for a while and saw funds entering slowly but steadily, with small orders constantly providing support at the bottom. In situations like this, I don't hesitate—I reached in and bought some around 0.002
post-image
TAC-6.25%
ZEC+0.15%
LAB+0.31%
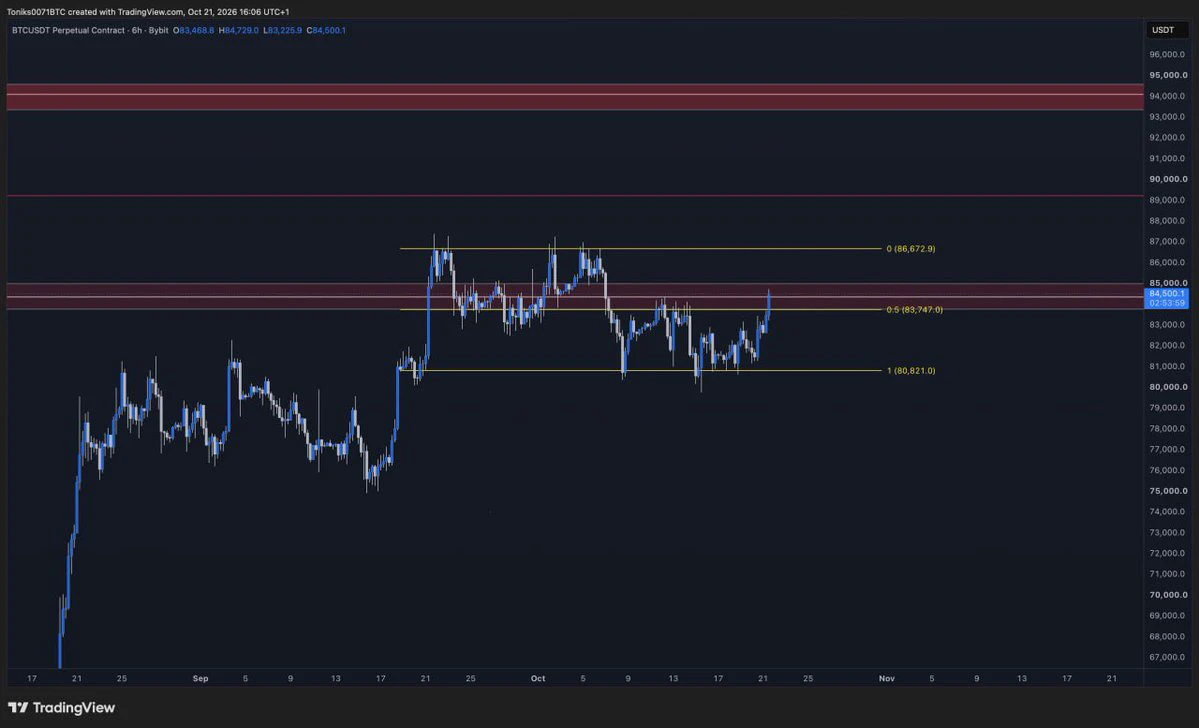
Bull-Bear Divide Deepens Around $82K! B.TOP Founder Sells All His BTC
live-cover
LIVE63
Everyone’s chasing SKYAI’s bounce—but the 4H chart just whispered a 95% secret.

$SKYAI /USDT - SHORT

Trade Plan:
Entry: 0.06135 – 0.06199
SL: 0.06472
TP1: 0.05938
TP2: 0.05786
TP3: 0.05557

Why this setup?
Why now? The daily trend is still bearish, yet the 15m RSI (63.55) shows a weak bounce—a classic bull trap. Price sits at 0.06167, hugging the 1H pivot. ATR (0.00127) is tight, meaning the breakout is coiled. Targets down: TP1 0.05938, TP2 0.05786. The invalidation at 0.05841 is far—room to breathe.

Debate:
Is this the final flush before SKYAI dumps to TP2, or are we early on a fakeou
SKYAI+6.50%
$COIN Signal】Long · 1H buying support enters
$COIN 4H RSI 70.07, MACD histogram narrowed to 0.0056, with the price moving sideways in the 0.176-0.181 range. 1H MACD bearish expansion, with buying support appearing repeatedly at the 0.1699-0.1717 lows and buyers providing real-time support. Depth imbalance is 1.77%, Bid/Ask depth is 1.04, and selling pressure is being absorbed quickly.
🎯Direction: Long
⚡Entry/limit order: 0.178164-0.178700
🛑Stop-loss: 0.176913
🚀Target 1: 0.181381
🚀Target 2: 0.182721
🛡️Trade management: - Execution strategy: After reaching target 1, reduce the position by
post-image
COIN+0.71%
BTC+0.25%
ETH+1.15%
SOL+1.30%
This trend doesn’t even require me to think—the account is out there dancing on its own.

During the repeated intraday fluctuations, $BTR surged to 0.17647. It looked like a breakout on the surface, but the volume didn’t follow, so there was simply no one buying up there. I opened a short position directly at that level, waiting for the false breakout to reverse on its own.

I took another look before the close, and 0.04843 had already returned to my expected range, putting +1428.51% in my pocket. I held the short without letting go, trusting this resistance level. I didn’t make a rash move
post-image
BTR-3.88%
BNB+6.37%
DOGE+5.99%
AGI is already a foregone conclusion.
Storage still needs to at least double.
AGI-1.92%
I held this $SNDK trade a little longer than usual. I used to always take a small profit and run, so even when I got the direction right, I couldn’t capture the real gains. This time, I waited for it to stabilize around 1534.92 before going long. As long as the previous low held, I stayed in, barely reacting to minor fluctuations.

The price just moved to around 1762.28, so I made the first partial exit as planned: took profit on 70% of the position, and moved the stop-loss on the remaining 20% to above the entry price. First, make sure this trade exits without a loss, then keep a small posit
post-image
SNDK+1.80%
XRP+1.17%
BTC+0.25%
Everyone’s staring at 103.36—but the real trap is hiding in plain sight on $SOL /USDT.

$SOL /USDT - SHORT

Trade Plan:
Entry: 103.18 – 103.54
SL: 105.05
TP1: 102.09
TP2: 101.25
TP3: 99.98

Why this setup?
- The 4h frame says SHORT, but confidence is just 55—this is a knife-edge, not a conviction.
- RSI on 15m (45.75) is dead neutral: no panic, no euphoria—just a coiled spring.
- ATR 1h at 0.70 means the next 4 candles could fake you out before the real move.
- Why now? The range on 1D is the anchor—we’re bouncing inside it, and TP1 at 102.09 is the first magnet, but a break below 102
SOL+1.36%
$XMR
There is a structural scarcity on centralized exchanges, and that will amplify any real demand spike… if another wave of demand hits while CEX inventory stays low, the move will be strong. The remaining float is small and fragile, so volatility will stay high.
post-image
XMR0.00%
【$B Signal】Long | 1H pullback to Bollinger midline + bid support
$B 1H pullback to the Bollinger midline, bid-side depth imbalance at 12.02%, current price 0.1733 holding just above the midline.
🎯Direction: Long
⚡Entry/Limit order: 0.172780 - 0.173300
🛑Stop-loss: 0.171567
🚀Target 1: 0.175900
🚀Target 2: 0.177199
🛡️Trading management:
- Execution strategy: After reaching Target 1, reduce the position by 50% and move the stop-loss up to breakeven. If the price falls back to the entry level, exit automatically to protect the principal.
Depth logic: The 4H MACD is above the zero line; the hist
post-image
BTC+0.25%
ETH+1.15%
SOL+1.30%
Layout for Bitcoin, Ethereum, and Dogecoin
live-cover
LIVE2,640
  • 1
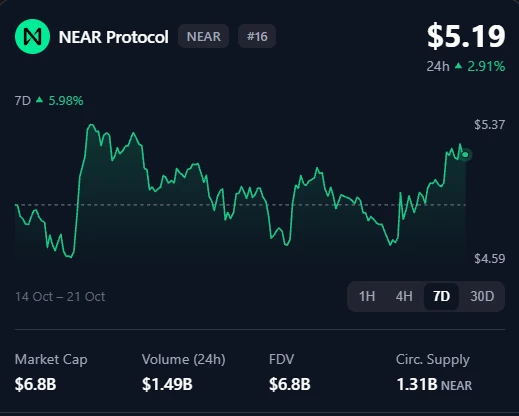
Everyone’s staring at NEAR’s breakout, but the 15m RSI says you’re already late to the quiet part.

$NEAR /USDT - LONG

Trade Plan:
Entry: 2.1736 – 2.1968
SL: 2.0737
TP1: 2.2688
TP2: 2.3246
TP3: 2.4082

Why this setup?
- 4h structure is screaming LONG at 95% confidence, anchored at 2.1852 while the daily trend stays bullish.
- The pullback zone (2.1736–2.1968) is where wallets get filled—not after TP1 prints.
- RSI 15m at 45.64 means room to run before overbought, and ATR 0.0465 gives you a tight 4.5% stop buffer to 2.0737.
- Why now? Because waiting for TP3 (2.4082) is a luxury only
NEAR+0.92%
Is this even a rebound, or CPR for my empty account? But now is definitely not the time to act impulsively. When I checked the chart after lunch, $XAUT surged to the highs on no volume, with clearly insufficient buying support. I tried shorting around 4486.7: volume didn’t follow, and with no one taking the other side, it naturally had to come back down.
The current price of 4427.9 has already given the answer—+121.82% secured. It dragged its feet earlier, but the result is truly satisfying.
Don’t mess with your position either: take 80% off the table first, move the stop-loss on the remainin
post-image
XAUT+0.01%
LAB+0.31%
XRP+1.17%
This time, what I think was most crucial in holding onto the $NEAR long was splitting the take-profit into several stages instead of waiting for one key level.
The entry price was around 1.8725. When it rose to the first target, I closed 30% first, instantly lowering the cost basis of the position. I set a protective stop for the remaining 70% and patiently waited for higher levels. Honestly, no one can guarantee selling at the key level. Locking in part of the profit and letting the remaining position continue to run actually makes it easier to hold the trade steadily.
There was one quick pul
post-image
NEAR+0.92%
ETH+1.14%
SOL+1.36%
I remain bullish on this market cycle, and I don't think we're at the end of the bull market. Instead, it looks more like the main uptrend is beginning to spread from BTC to altcoins.
Why do I see it this way?
Because what is happening in the market is no longer just one or two coins performing independently.
ZEC keeps making new highs, DASH and XMR are beginning to accelerate, and platform tokens like GT are rising in succession. This shows that capital has started flowing out of BTC, ETH, and the earlier Meme rally, and is once again searching for the next batch of assets with attractive ris
NVDA+0.87%
Most traders will ignore $LAB /USDT at 0.07413—that’s exactly why the 95% short setup is armed.

$LAB /USDT - SHORT

Trade Plan:
Entry: 0.07390 – 0.07436
SL: 0.07630
TP1: 0.07250
TP2: 0.07142
TP3: 0.06979

Why this setup?
- 4h structure is bearish, but the 1D trend confirms it: downside is the path of least resistance.
- RSI on 15m at 37.24 shows momentum is already rolling over—no bounce strength to fight the slide.
- Entry window is tight (0.07390–0.07436), with TP1 at 0.07250 and TP3 at 0.06979.
- The invalidation at 0.07428 is razor-thin—either we break down fast or this signal di
LAB+0.31%
Load More

Join 40 M users in our growing community

⚡️ Join 40 M users in the crypto craze discussion

💬 Engage with your favorite top creators

👍 See what interests you

View More