Share your thoughts
placeholder
Article
Early in the morning, BTC bottomed out and rebounded to around 78500 before coming under pressure and pulling back, hitting a low of around 76600 in the evening. Our short setup once again delivered nearly 2,000 points of room! A rebound recovery is currently underway.

From the current market structure, the daily chart shows a rally followed by a pullback, with the price falling below the Bollinger middle band, which is acting as strong resistance. Upside momentum has weakened significantly, and the market has shifted from high-level consolidation to a weakening pullback.
The 4-hour chart co
post-image
BTC-1.07%
For all the concerns about bitcoin not making a higher high in USD, bitcoin made a higher high against gold.
The dollar is being actively weakened, this ratio is the key signal.
BTC/Gold is +0.58% on the day.
post-image
BTC-1.08%
🚨 $CNPY (CANOPY) SPIKES +17% THEN PULLS BACK Volatile V-Recovery ⚠️
📊 $CNPY /USDT
📈 Direction: LONG
⚡ Leverage: 5x
🎯 Entry Zone: 0.2150 – 0.2300
🎯 Take Profit Targets:
TP1: 0.2500 +50%
TP2: 0.2712 +66%
TP3: 0.3000 +99%
🛑 Stop Loss: 0.1950
$CNPY ‌#GateTop4MainstreamCEX
post-image
CNPY+16.26%
  • 6
  • 2
$CL Oil prices both broke above $100, a development worth watching closely.
On September 10, oil tanker attacks and concerns over supply disruptions pushed oil prices higher, with both major crude oil benchmarks rising more than 6%.
▪ Brent: $107.63/barrel
▪ WTI: $102.48/barrel
These are settlement prices.
I’m more focused on how long this round of price increases can last.
If the supply shock continues, corporate profit margins and room for interest-rate cuts could both come under pressure, while the rebound in U.S. tech stocks and BTC will also face a higher hurdle.
Next, watch three signals
CL+5.88%
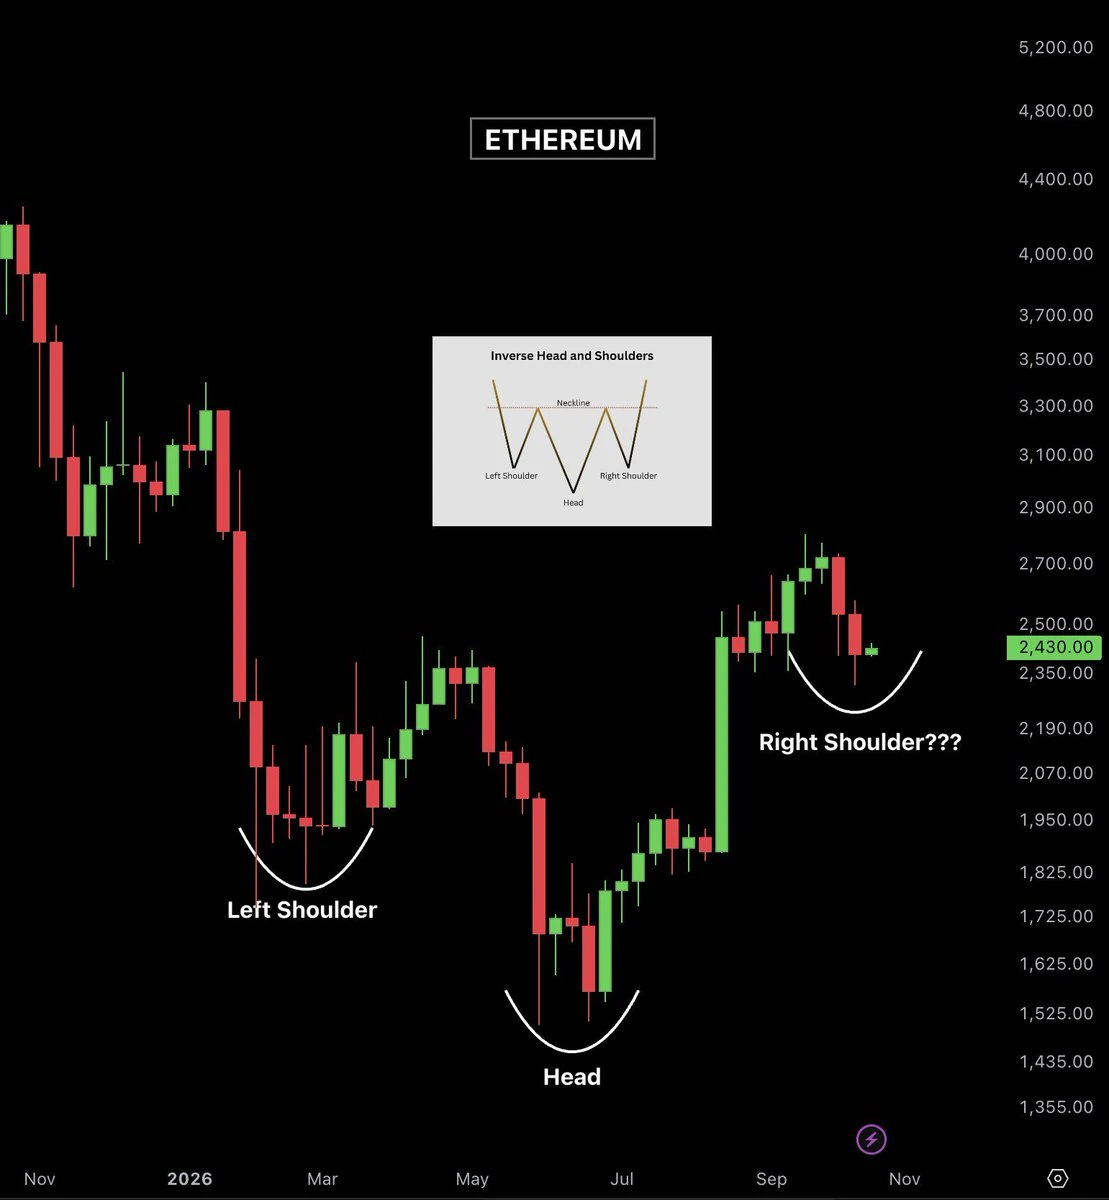
$ETH Signal】1H breaks below the band, bearish momentum continues
$ETH RSI 1H 27.68, 4H 33.85, MACD 1H/4H histograms expanding in negative territory. The current price of 2417.98 remains below the 1H Bollinger lower band at 2427.90, while the 4H lower band at 2441.41 has been breached. The order book buy/sell depth ratio is 2.71, with dense buy orders, but the price is still breaking down and bids are being quickly absorbed. Funding rate is -0.0039%, OI is stable, and there is insufficient fuel for a short squeeze.
🎯Direction: Short
⚡Entry/Limit order: 2410.7261 - 2417.9800
🛑Stop-loss: 2469.
post-image
ETH+0.19%
BTC-1.08%
SOL-1.50%
$1000 to $100,000 Crypto Trade Challenge Today
live-cover
LIVE473
Nobody is talking about this quiet ETH move that just flipped the daily trend.

$ETH /USDT - LONG

Trade Plan:
Entry: 2442.18 – 2452.80
SL: 2396.49
TP1: 2485.74
TP2: 2511.24
TP3: 2549.49

Why this setup?
Why now? The daily trend is bullish with a 4h higher timeframe bias, the 15m RSI sits at 40.9 showing room to run, and the 1h ATR of 21.250275 confirms active volatility. The entry zone at 2447.49 with a tight range of 2442.18 to 2452.80 gives a precise risk-defined setup. TP1 at 2485.74 and TP2 at 2511.24 offer staged profit-taking while the invalidation level at 2454.93 acts as the hard l
ETH+0.19%
Intraday, XAU rebounded again to around 4438 before coming under pressure, then fluctuated lower all the way, reaching a low of 4319 in the early morning. We called for shorts around 4330 and once again secured 120 points of downside, with prices currently fluctuating at low levels!
From the current chart, the daily timeframe shows a surge followed by a retreat, with the price falling below support at the Bollinger middle band, which has turned into a strong resistance level. Bearish momentum continues to exert downward pressure, weakening the broader trend.
On the 4-hour timeframe, the price
post-image
XAU-1.80%
Don’t Panic Just Yet
U.S. PPI rose 5.4% year-on-year in August, marking a clear acceleration and exceeding expectations of 5.3%. The market’s first reaction was naturally: Inflation is picking up again—will the Federal Reserve continue to turn more “hawkish”?
But a calm breakdown of the data shows that the story is not so simple. Prices of final-demand goods rose 1.1% in August, with energy prices a major contributor, including a 24.1% surge in diesel prices; service prices rose just 0.1%.
In other words, a considerable portion of this PPI acceleration came from an energy shock, rather than an
  • 26
Bears?
Sooner or later they’d be so fucked!
Stack up and relaxation does the rest
Good evening Lads!
post-image
🚨 U.S. August PPI rose 5.4% year over year; keep a close eye on CPI next
The U.S. August PPI released on September 10 rose 0.4% month over month and 5.4% year over year. Among them, energy prices rose 4.2% month over month, making them the main driver of price increases on the goods side. Source: BLS
My view: Cost pressures are still present. For U.S. tech stocks and BTC to open up room for gains on expectations of looser policy, more evidence is needed.
The next key event is the U.S. CPI at 20:30 on September 11 (Beijing time). I’ll first look at the core components, then at U.S. Treasury yi
BTC-1.08%
  • 13
  • 2
I was just about to go to the forum and rant, but then I saw my balance. Never mind—the market is always right.

When everyone else was running, I didn’t panic along with them. The price bounced back to around 0.08597, while the volume kept getting smaller each time—clearly a strong whiff of a bull trap. I went straight in with a short, set my stop-loss, and waited for the market to give me an answer.

The answer didn’t take long. The current price is already at 0.08395, with floating profit at +167.54%. After eating this piece of meat, I feel energized.

The position needs to be managed pr
post-image
ETH+0.19%
LAB-6.91%
I had just switched the software to the background when it suddenly plunged—are you playing hide-and-seek with me? The last time I checked a few days ago, $CYS was at 0.4520, facing heavy resistance above, with clearly insufficient buying support.

My message at the time was simple: bullish, but the rebound was weak—don't become exit liquidity. Those who listened should understand.

Now at 0.1399, with +1358.25% secured, getting the timing right is really that simple. Time to enjoy a good meal.

Take 70% off the table first, and move the protective stop on the remaining 30% to the entry pri
post-image
CYS-3.12%
XRP-2.78%
ZEC-8.36%
Smart money is quietly stacking XRP while the retail crowd sleeps on this setup.

$XRP /USDT - LONG

Trade Plan:
Entry: 1.3504 – 1.3572
SL: 1.3119
TP1: 1.3852
TP2: 1.4061
TP3: 1.4375

Why this setup?
Why now? The daily trend is range-bound, which means XRP is coiling for a directional burst and the 1h ATR of 0.013419 confirms enough volatility to fuel a clean move. The 15m RSI sits at 27.9, signaling oversold conditions that align with the entry zone at 1.3538, where the 1h price is currently hovering. TP1 at 1.3852 and TP2 at 1.4061 represent realistic targets if momentum shifts, while the
XRP-2.78%
Nobody is talking about the SYMBOL setup hiding inside a daily range right now.

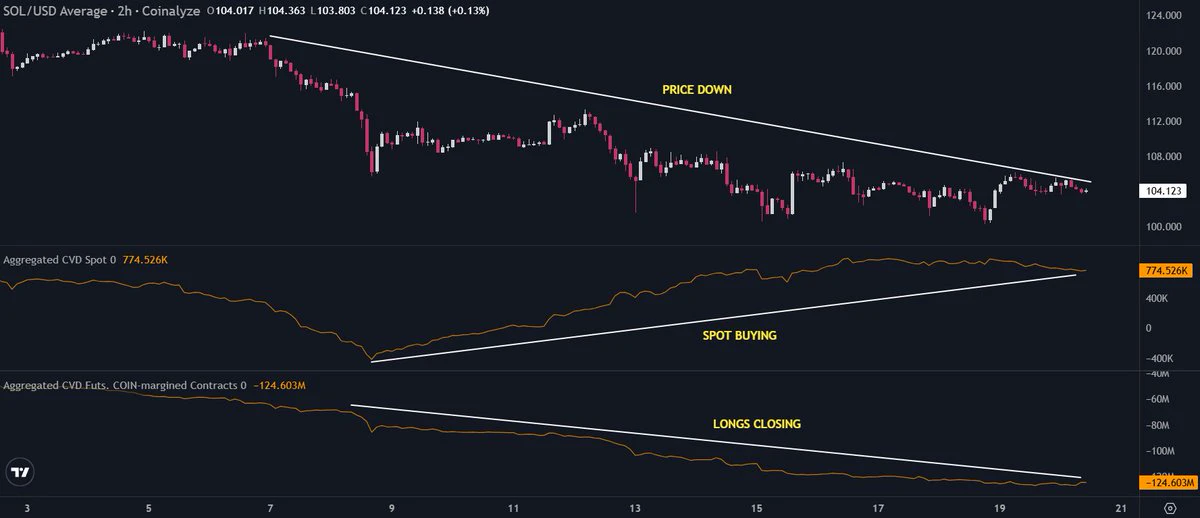
$SOL /USDT - SHORT

Trade Plan:
Entry: 99.76 – 100.30
SL: 102.57
TP1: 98.12
TP2: 96.85
TP3: 94.94

Why this setup?
Why now? The 1h price is pinned at 100.03 inside a tight range, and the 15m RSI has dropped to 39.62, signaling weak momentum before a potential breakdown. The 1h ATR sits at 1.06038, which means the average hourly move is small enough that a breach of the entry zone between 99.76 and 100.30 could accelerate quickly. The daily trend is range-bound, so the bias favors fading any push toward the uppe
SOL-1.45%
I only wanted to mooch a breakfast, but the market ended up keeping me in the dumpling pot for half a year.

When the sell-off started at the open, the whole screen was filled with panic, but I was watching that low-volume rebound. The weak bounce was one thing, but the selling pressure above was also firmly capping the price. Not shorting it would have been a disservice to this setup. I entered a short around 0.28292, set my stop-loss, and couldn’t be bothered to watch it.

I just came back to find that the current price had already fallen to 0.23609, with floating profit at +326.54%. The m
post-image
BNB-0.80%
XRP-2.78%
Why is everyone ignoring the buy signal forming on XRP right now?

$XRP /USDT - LONG

Trade Plan:
Entry: 1.3497 – 1.3561
SL: 1.3124
TP1: 1.3833
TP2: 1.4035
TP3: 1.4339

Why this setup?


Debate:
Are we about to rocket to TP2 or is this just another range trap?

⚠️ Personal market analysis only. NFA — manage risk and DYOR.
Educational content, not investment advice or a recommendation to buy, sell, deposit, or withdraw any asset. No paid promotion or referral/affiliate links.
XRP-2.78%
- CPI comes in soft
- Rate hike chances drop
- Small relief rally on $BTC
- Bulls get cocky (again)
- bulltrap.exe
- FOMC, 25bps rate hike
- Back to channel lows
This is the best hopium I can offer at this time
Please enjoy responsibly
post-image
BTC-1.08%
BTC Market Updates
live-cover
LIVE46
Inflation is knocking again
The U.S. PPI rose 5.4% year-on-year in August, above the 5.3% forecast and accelerating significantly from July; it increased 0.4% month-on-month, while core PPI rose 0.2% month-on-month. On the surface, these are just changes of a few decimal points, but on the Federal Reserve’s decision-making table, they could become a rather difficult “hard nut to crack.”
In particular, prices on the goods side rose 1.1%, with energy becoming a major driver. Diesel prices surged 24.1% in one month, and rising oil prices are pushing inflationary pressure back through the industri
  • 12
Load More

Join 40 M users in our growing community

⚡️ Join 40 M users in the crypto craze discussion

💬 Engage with your favorite top creators

👍 See what interests you