








Square
Following
Hot
News
Profile
Share your thoughts
placeholder
Article
Quantitative system helps improve the odds of victory
post-image
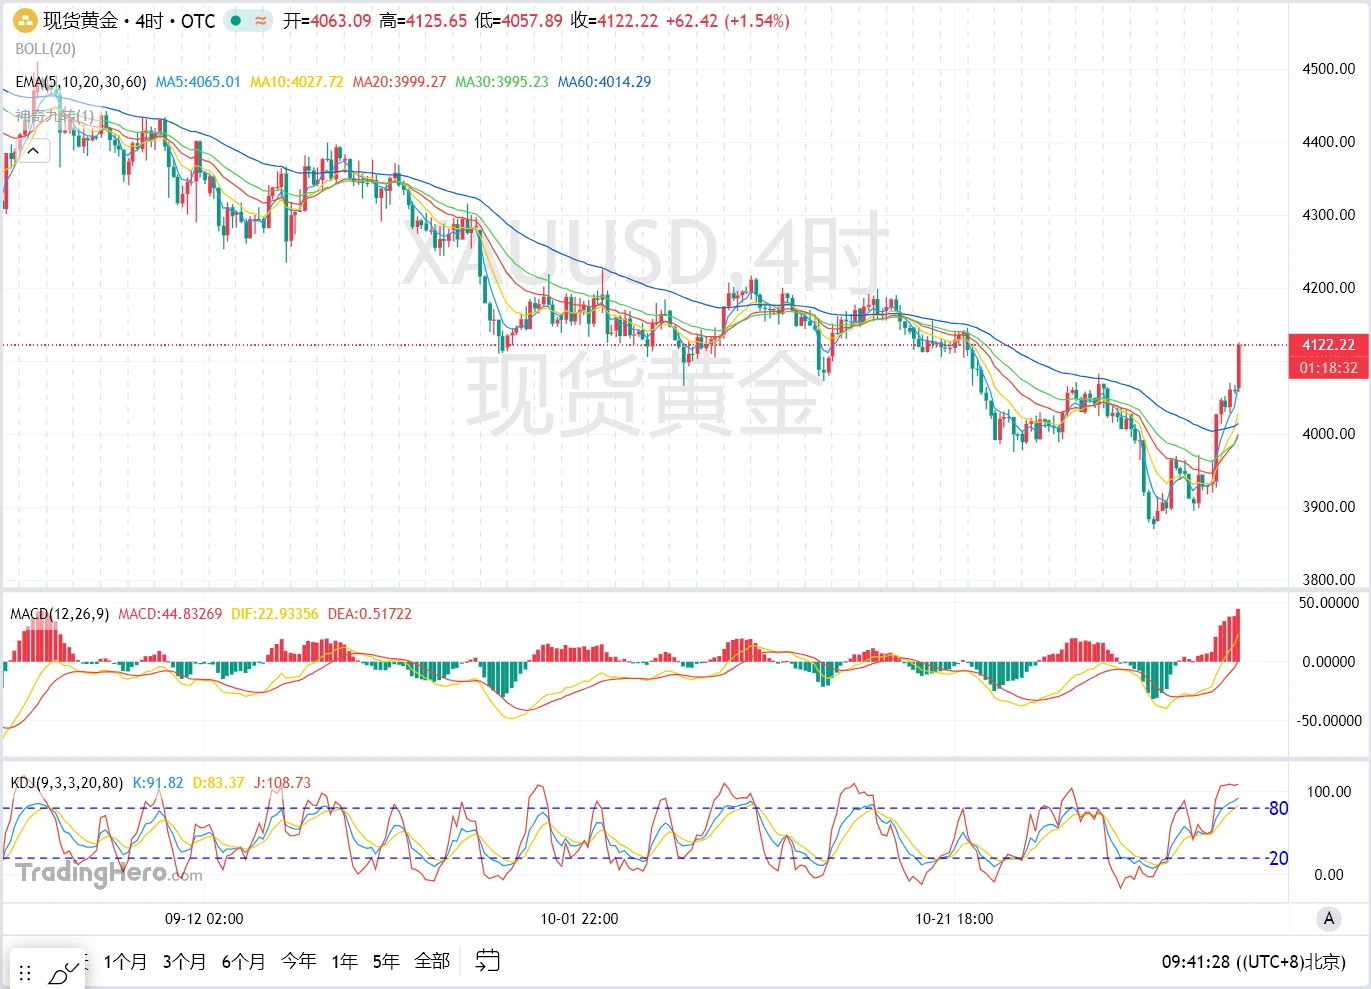
November 5 Midterm Election “Blue Wave” Drives Gold Higher
Yesterday, as the U.S. midterm election results gradually became clear, gold prices fluctuated sharply with the progress of the race. Gold surged nearly $140 in a single day, breaking through the previous key $4,000 level and reaching a high near $4,070. At today’s open, gold continued yesterday’s strong trend, setting another high around $4,125 during the Asian session. Short-term bullish momentum remains strong.
Technically, after breaking through the key resistance at 4,080 on the four-hour chart, gold has fully opened up the upside
post-image
XAUUSD+1.91%
Trenches
ZIG
Z
bade
b
ZIG
0x8c...1145
Market Cap
$.
Change
.
24h Vol
$.
Holders
.
BTC
B
bade
b
BTC
C5xp...pump
Market Cap
$.
Change
.
24h Vol
$.
Holders
.
HIGH
H
bade
b
HIGH
7ymF...high
Market Cap
$.
Change
.
24h Vol
$.
Holders
.
STONK
S
bade
b
STONK
6GmA...UNgx
Market Cap
$.
Change
.
24h Vol
$.
Holders
.
RAM
R
bade
b
RAM
6QUH...pump
Market Cap
$.
Change
.
24h Vol
$.
Holders
.
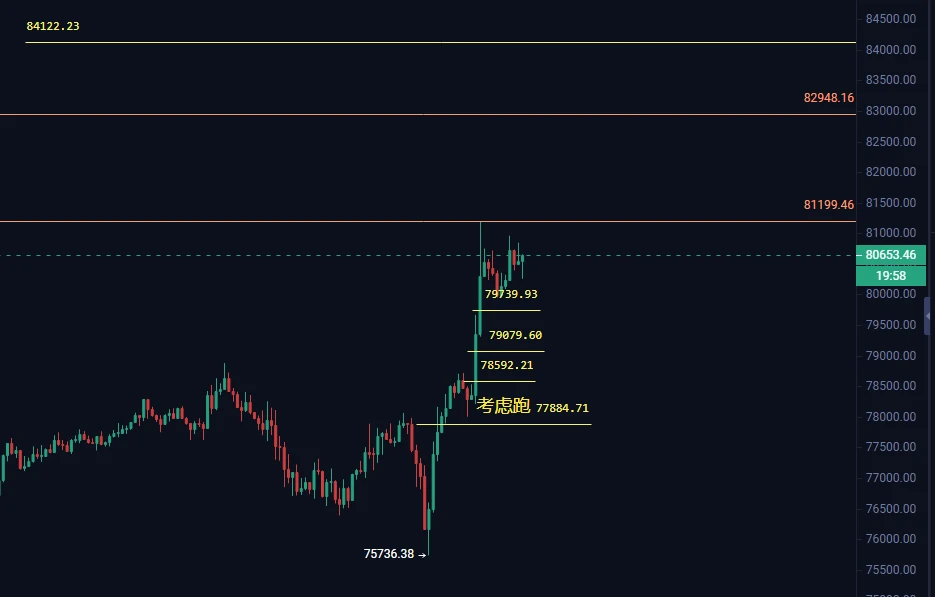
Bitcoin is still looking good; it has stabilized, with no major pullback.
If it pulls back, I’ll consider adding to my position at the yellow levels in the chart below: 797, 790, and 785. If it drops below 778, I’ll exit everything. Resistance above is at 829 and 841. I’ll see how it rises before saying more.
This rally could take it above 90k. I predict it could get there between 11.10 and 11.15.
Shared for reference only, not investment advice. Do your own research and bear responsibility for your own gains and losses. Futures are highly volatile, so manage your risk.
$BTC
post-image
BTC-0.65%
  • 8
  • 1
$XAUUSD Yesterday, I opened large-account long positions on MT5, and the market is currently moving entirely as expected. Chasing longs now carries risks, so wait for a pullback to key levels before considering adding to the position
XAUUSD+1.91%
The gold outlook shared earlier hit all its target levels! The market always moves as anticipated, so just follow the plan. ​​​$XAU
XAU+0.38%
$80K isn’t a ceiling; it’s the new floor. Here is why this breakout changes everything.
The charts are screaming, but most traders are still reading the old playbook. Bitcoin reclaiming $80,000 is not just a price target hit; it is a structural regime change. We are no longer in a speculative recovery phase. We have entered an era of institutionalized scarcity where macro liquidity and digital asset adoption are permanently intertwined.
My prediction for the next 90 days is clear: Volatility will compress before expansion, and $80K will become the primary accumulation zone for smart money.
The
post-image
BTC-0.65%
#USEarningsSeason

📊 US EARNINGS SEASON: PROFITS ARE GROWING, BUT THE REAL TEST IS WHAT COMES NEXT
💡 MYTH 1: A COMPANY THAT BEATS EARNINGS EXPECTATIONS IS AUTOMATICALLY A WINNER
Fact: Beating expectations is only part of the story.
The US third-quarter 2026 earnings season is delivering some impressive numbers, but investors need to look beyond the headlines.
By October 30, approximately 60% of S&P 500 companies had reported their third-quarter results. Around 82% of those companies had delivered earnings per share (EPS) above analyst expectations.
That sounds impressive. However, there is
post-image
AMD+0.88%
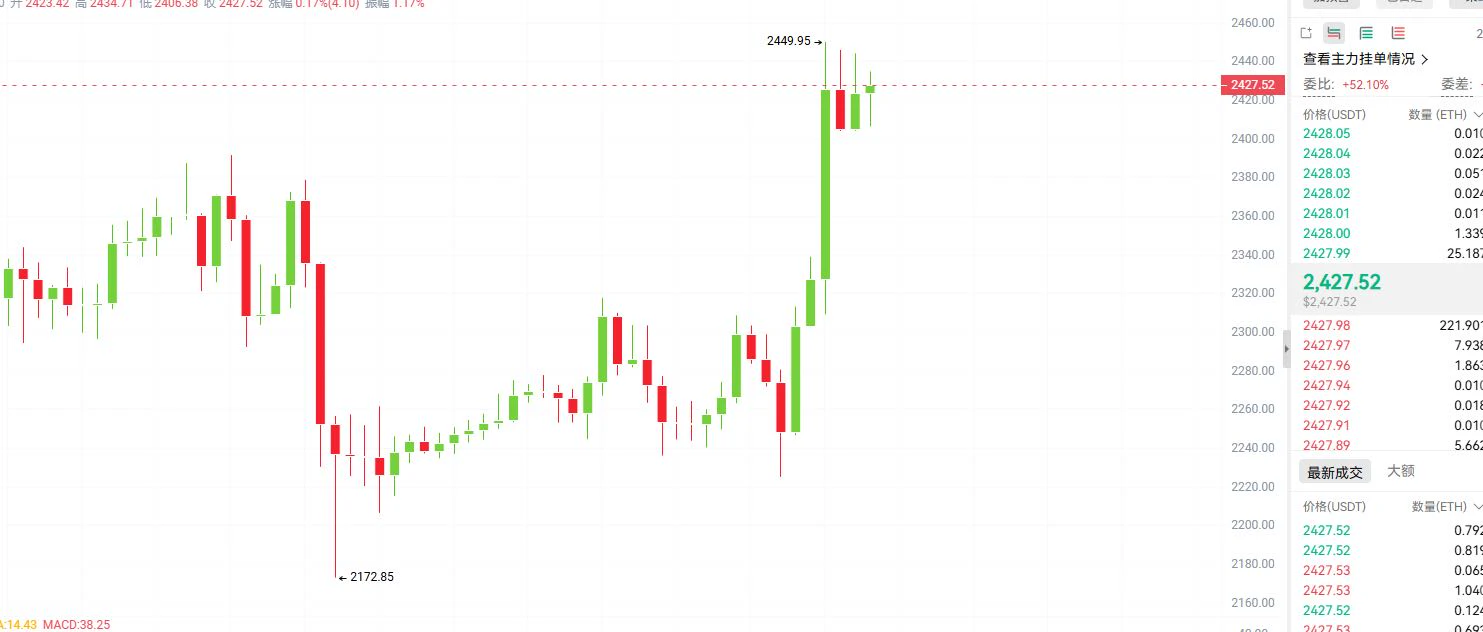
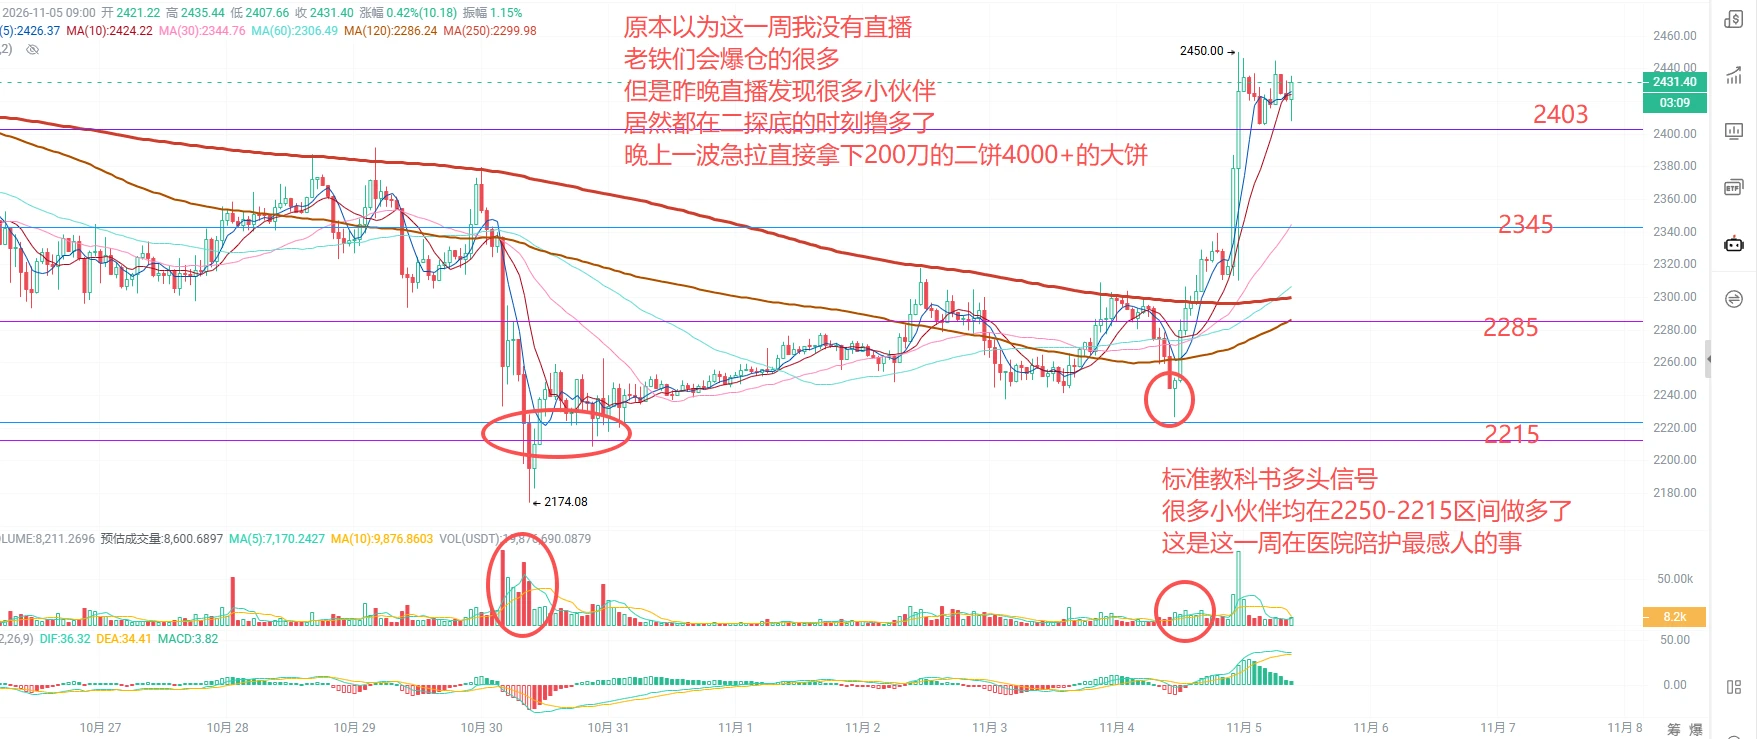
Sister U's 11.5 Thursday $ETH Strategy
Entry: Go long if price stabilizes after pulling back to around 2395‑2410
Stop-loss: Below 2380
Targets: 2450‑2475
Market outlook: ETH began a strong rebound from the low of 2172, with solid buying support at the bottom and the short-term rebound structure still intact. The area around 2390 is the support platform for this rally. If the pullback to this range shows signs of holding and buying volume increases, there is room for another move higher to test the previous high. If price effectively breaks below 2365, the rebound structure will be invalidated
post-image
ETH-1.23%
[ NEW STREAMER ] TODAY MARKET TALK
live-cover
LIVE1,929
🔒 Why might you still be unable to transfer funds even when you hold the private key yourself?
An inability to transfer assets does not necessarily mean the private key is invalid, nor does it necessarily mean the assets have been frozen.
Common reasons include:
1. A centralized platform restricting the account or withdrawals;
2. The token contract imposing address restrictions or a pause mechanism;
3. The transaction not meeting fee, parameter, or other execution requirements.
The key is to first determine where the restriction occurs, then verify it using transaction records, contract sourc
post-image
Featured2026.11.5 BTC/ETH/XAU/SNDK analysis
The market wiped out $981 million overnight, with 131,231 people liquidated and wiped out;
Two years ago today, BTC began its explosive rally, surging from 67000 straight to 108000, a gain of over 40000; this kicked off BTC’s run of repeatedly setting new highs. Last night BTC surged 5000, and market liquidity is now at its most fragile, with big players able to do as they please;
BTC
Support: 75475-78425. After last night’s explosive rally, the likelihood of this range breaking down has decreased.
Resistance: 85150/87550
Give BTC time. Bulls are currently s
post-image
BTC-0.65%
ETH-1.26%
XAU+0.38%
SNDK-7.93%
  • 13
  • 3
Back to 80,000! Is the golden opportunity over? The chance to get in is fleeting! Clear signal: buy spot at $76,000 and lock in the interim bottom! The counteroffensive is in full swing, targeting short liquidations!
post-image
GLDX-0.40%
PAXG+0.37%
Strength training after waking up today.
post-image
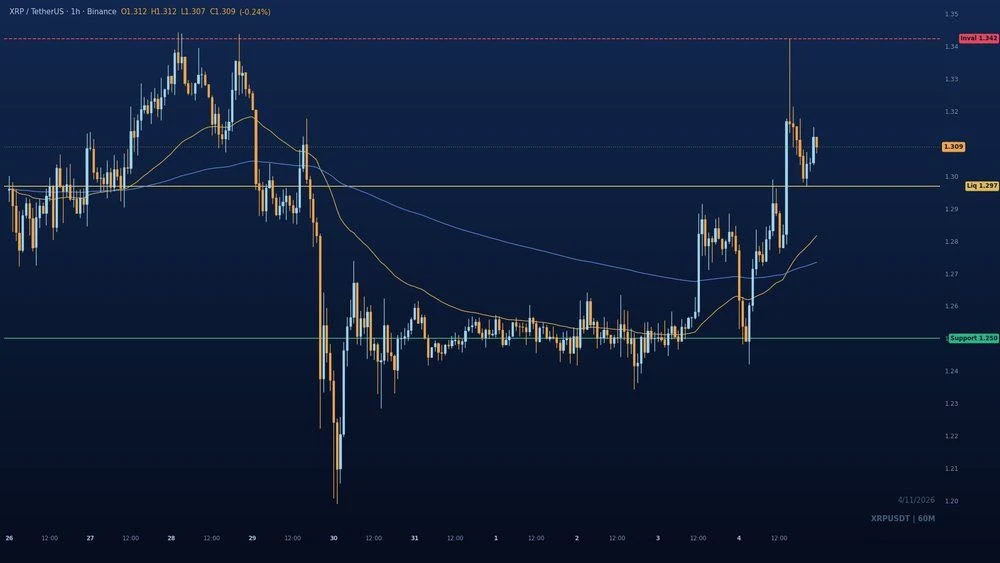
$XRP broke bullish from the $1.25 base but faced rejection at $1.342.
Now, $1.297 is the key level to watch. A quick liquidity sweep and reclaim could keep the recovery alive.
Lose that level, and $1.25 comes back into focus.
A break above $1.342 would be the real bullish confirmation.
Let the 1H chart decide. 👀
#BTCBackAbove80K
post-image
XRP-1.15%
📺 P2P Trading News – Wednesday, November 4, 8:00 PM
Good evening, Venezuela. USDT closes the day at Bs 1,017.72 to buy and Bs 1,001.29 to sell, with a 1.64% spread and a 13.73% premium over the BCV, which rose to Bs 894.89. The traffic light remains yellow: moderate premium, high liquidity, but the order book is skewed toward buyers.
In this evening’s edition:
🔹 The 6 PM analysis: a 13.8% premium and spreads by bank—Banesco 0.52%, Banco de Venezuela 0.34%, and Mercantil 0.33%, with Pago Móvil leading in liquidity.
🔹 The Colombia-Venezuela gas pipeline is back on the agenda: what it really m
#BTC重返8万 #每周来晒 #广场交易达人 #WCTCS9 BTC Market Analysis
BTC is currently around $80,650, up 4.9% in 24 hours, and has indeed reclaimed the $80,000 level. But this rebound has mainly been driven by short liquidations, while spot inflows have yet to catch up, so near-term price action is more likely to be choppy.
Here are the main things to watch
ETF flows: There have been cumulative net outflows of about $1.157 billion over the past three trading days, so this source of buying has yet to return.
U.S. stocks and macro factors: Falling Treasury yields and a rebound in U.S. stocks have supported this r
ThisIsTranslateContent:
#BTC重返8万 #广场交易达人 #WCTCS9 BTC Price Analysis
BTC is currently around $80,650, up 4.9% in 24 hours, and has indeed climbed back above $80,000[1]. But this rebound is mainly driven by forced short covering, while spot market inflows have yet to catch up, so near-term trading is more likely to be choppy.
Key factors to watch
ETF flows: Net outflows totaled around $1.157 billion over the past three trading days, so this source of buying has yet to kick in.
U.S. stocks and macro: Falling Treasury yields and a rebound in U.S. stocks have supported this recovery; U.S. employment data on November 6 will affect rate expectations.
· Leveraged positions: When the price quickly rebounded from $75,700, concentrated short liquidations amplified the gains. This type of buying often lasts only until the positions are closed.
Several key price levels
$81,000–$82,000: Near-term resistance; a move up to this level could easily be followed by a pullback.
$80,000: The key support level now. A daily close below it could lead to another test of around $77,600.
$85,000–$87,500: The area with the heaviest concentration of underwater holders and sell orders, making a near-term breakout difficult.
Two possible scenarios
If BTC holds above $80,000, ETFs see consecutive inflows, and trading volume expands: upside opens up, with $90,000 as the next target.
If BTC falls back below $80,000: Previous downward pressure will return, and the price could retest $77,600.
For now, trading within a range looks more suitable. Wait for ETF inflows to return and for the daily close to hold above $80,000 before deciding whether a new uptrend has begun.
Whether this rebound can last mainly depends on whether new money enters the market. A price rise accompanied by inflows into ETFs and stablecoins would indicate a more sustainable move.
On-chain data: See who holds the coins
Exchange balances: A decline means coins are being withdrawn and held, easing selling pressure; a rise suggests people are preparing to sell.
SOPR: Above 1 means most sellers are making a profit; below 1 means people are selling at a loss.
Long-term holder activity: Little movement in older coins suggests large holders are not selling.
Realized market cap: If it rises along with the price, that suggests new money is entering; if only the price rises, existing funds are probably just changing hands.
Market indicators: See whether money is flowing in
ETF net flows: Consecutive days of net inflows would show institutional buying has returned.
Total stablecoin market cap: A rise means money on the sidelines is still waiting to enter.
Trading volume: A rally on rising volume is much more solid than one on declining volume.
Funding rates: A return to neutral means leveraged chasing has cooled, making the market healthier.
Watch for these signals
Bullish: Consecutive ETF inflows, growth in the total stablecoin supply, and closes holding above $80,000.
Bearish: A fall below $80,000, a return to net ETF outflows, and a marked increase in exchange balances.
ETF outflows have yet to show a consistent slowdown, and the total stablecoin supply has not reached a new high, so this looks more like a short-term rebound; a trend reversal still needs confirmation from fund flows.$BTC

repost-content-media
BTC-0.67%
  • 3
Why can you be right about the market and still not necessarily make money?
Because trading results depend not only on direction, but also on position size.
An oversized position can turn normal volatility into a severe drawdown; the deeper the loss, the higher the return needed to break even.
First decide how much loss you can tolerate, then determine how much capital to invest.
Which do you find harder: predicting the market or managing position size?
post-image
#GateCardNameAnd
💳 FROM DIFFERENT CARD DESIGNS TO ONE UNIFIED LOOK: GATE MAKES CARD IDENTIFICATION EASIER
📌 WHAT HAS CHANGED?
Before, users could see different card names and designs. Now, Gate has announced an updated card name and a unified design to make card identification easier. It is a simple change, but one that can improve the overall user experience.
✅ THE PROS: A CLEARER EXPERIENCE
A consistent card design makes it easier for users to recognize their cards. The updated name also helps reduce confusion when identifying the card.
For new users, a more unified appearance can make th
post-image
Democrats Continue Pushing the CLARITY Act! With the SEC Potentially Gaining More Authority, Is U.S.
live-cover
LIVE3,099
Five of the Magnificent 7 are down more than 10% from their highs, and two have officially entered bear market territory. This isn’t a pullback; capital is shifting direction. If you’re still heavily invested in tech leaders, think carefully—don’t wait until they’ve fallen much further to ask why. #USStocks
post-image
  • 6
  • 2
Load More

Join 40 M users in our growing community

⚡️ Join 40 M users in the crypto craze discussion

💬 Engage with your favorite top creators

👍 See what interests you

Trending Topics

BTCBackAbove80K

16.93k Views41.09k Discussing

After a sharp dip, Bitcoin climbed back above $80,000 on May 9 and is currently trading around $80,200. Over 50,000 traders were liquidated in the past 24 hours amid fierce long-short battles. The recurring Iran-U.S. tensions remain the primary short-term variable. Following U.S. airstrikes, Iran\'s Revolutionary Guard claimed to have breached the Strait of Hormuz defense line, leaving the ceasefire outlook uncertain. On the technical side, the daily SMA20 ,$77,970 serves as key support, with the RSI recovering from oversold levels to 43. The $80,000 level is both a psychological barrier and a bull-bear dividing line.Holding above it could lead to a challenge at $85,000, while a break may trigger a retest of the $77,000 area.

DemocratsWinBothChambers

15.81k Views411 Discussing

GateLaunchesTaiwanStockTrading

13.86k Views270 Discussing

View More