Square
Following
Hot
News
Profile
Share your thoughts
placeholder
Article
$WDC You really broke my heart!
post-image
WDC-2.00%
$NEAR Whale addresses continue accumulating, and holdings concentration has hit a new high! Retail FOMO is heating up—how far can this rally go?#Gate.io 🔥 #Gate广场中秋团圆局
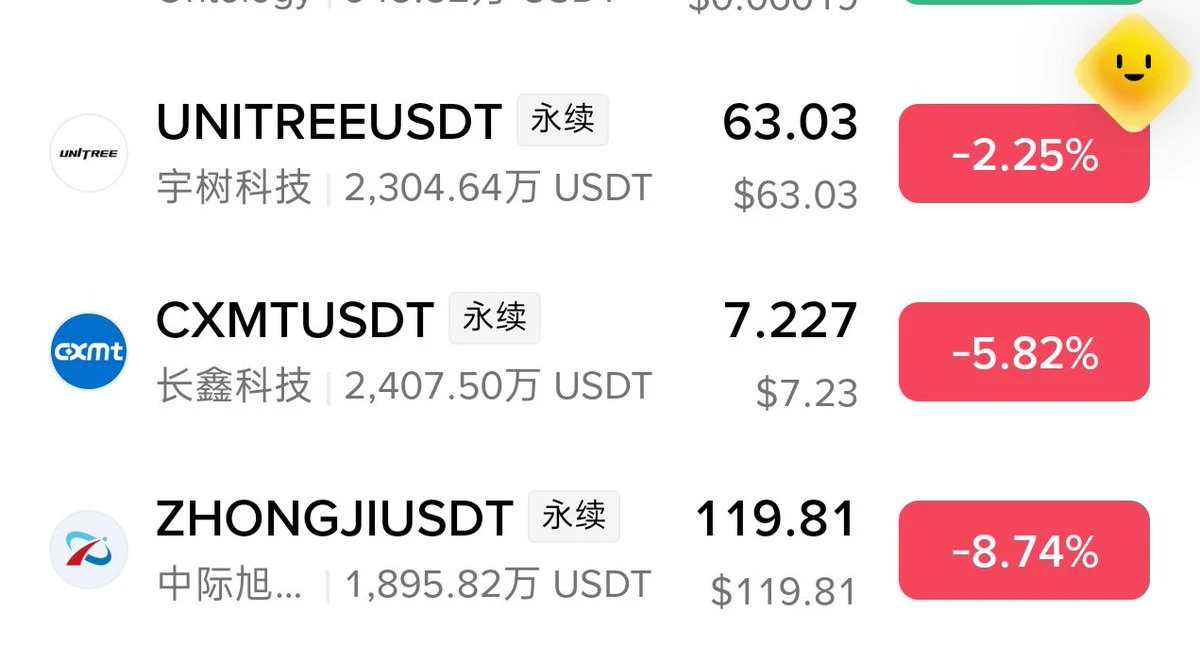
The three A-share stocks I have been shorting all along—ChangXin Memory Technologies (CXMT), Innolight Technology, and Yushu Technology—plunged today. It looks like the bubble in A-share tech stocks is about to burst!#CXMT
post-image
The wick-driven liquidation shakeout is over! Don’t rush to treat this rebound as a reversal or bottom-fishing opportunity!
Many people see the long lower wick pulling price back up and can’t wait to go long. But let me remind you: a recovery rebound after a sharp drop ≠ the arrival of a bottom. Today, I’ll fully explain the underlying market logic, the news environment, and the key resistance and defense levels.
Why did the market quickly rebound after plunging to new lows?
1. Concentrated leverage liquidations created an extreme wick
After a prolonged decline, many low-entry long positions w
ETH-2.85%
BTC-0.37%
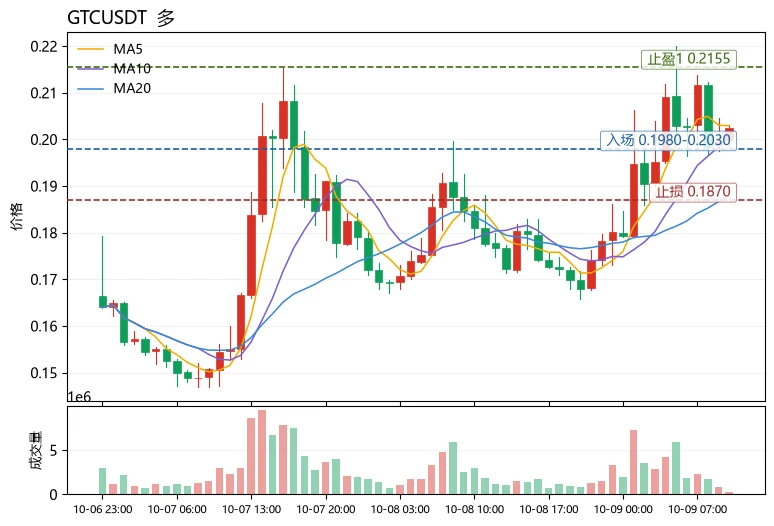
The Fear & Greed Index reads 59, in the greed zone but not yet at extreme levels, indicating that market risk appetite remains intact, while the willingness to chase highs is beginning to moderate; $GTC is currently at 0.20247, up 11.16% in 24h, with a trading volume of 10.1M USDT. MA5=0.20293 has crossed above MA20=0.187747, RSI=59.6 is not overbought, and the MACD histogram at +0.001507 remains bullish. The Bollinger upper band is 0.215656 and the lower band is 0.159838. The amplitude over 30 candlesticks is 26.76%, forming a high-level consolidation structure after a volume-backed rise. If
post-image
STRK+34.78%
ATOM+7.03%
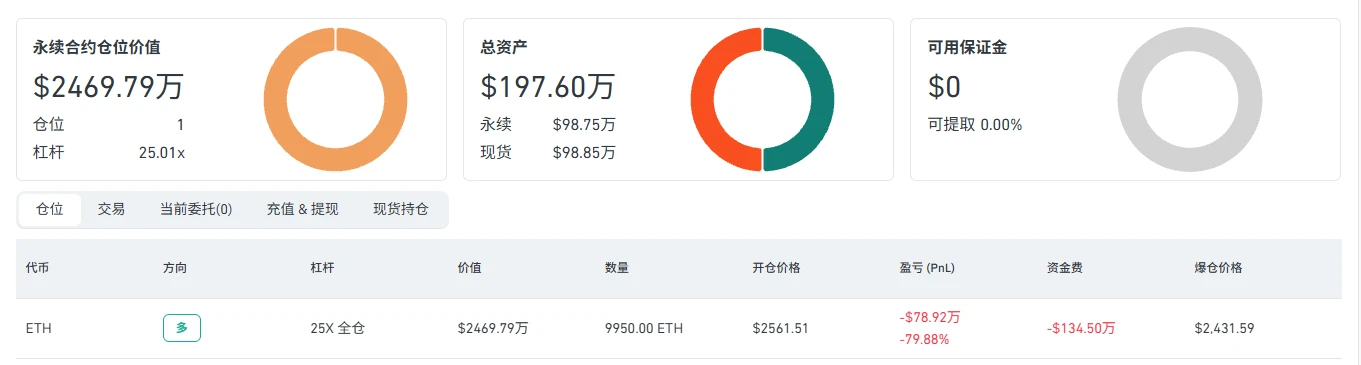
Machi lost $8.44 million in a week, and his account has fallen below $1 million again
First, look at these figures:
1. In August, $ETH went from $1,900 to $2,500. He kept rolling his position into longs, turning $150k into $12 million
2. Then ETH traded sideways in the narrow range of $2,400–$2,500 for 20 days. He frequently stopped out, leaving just $800k from the original $12 million
3. Around September 20, ETH rose from $2,400 to above $2,700, and his assets bounced back from $800k to $10 million
4. Now, on October 9, ETH has fallen below $2,500, and his assets have once again dropped belo
post-image
ETH-2.86%
BTC and Ethereum market surges predictions
live-cover
LIVE2,772
#ShareWeekly
BTC Near $81,700: My Trading Seatbelt When the Market Stops Playing Nice
There is a big difference between predicting where Bitcoin might go and being prepared for what happens if it goes the other way.
BTC is trading around $81,700 after a sharp pullback from the $86,000 area earlier this week. Its recent 24-hour range has stretched from roughly $80,337 to $83,475. For me, this is exactly the kind of market where patience matters more than excitement. A quick bounce can tempt traders into buying too early, while another red candle can push them into selling out of fear.
I do not
BTC-0.44%
  • 3
  • 1
#美股光通信板块收跌 Why Haven’t U.S. Stocks Fallen Yet: EPS Growth Is Offsetting Valuation Declines!
Why Haven’t U.S. Stocks Fallen Yet: Corporate Profits Are Battling a 5.27% Risk-Free Rate
The U.S. stock market is currently in a seemingly contradictory state. On one hand, corporate earnings continue to grow. FactSet expects S&P 500 third-quarter EPS to increase approximately 29.5% year over year, potentially marking the third consecutive quarter of growth above 25%. On the other hand, the U.S. 10-year Treasury yield has risen to 5.27%, while the 10-year real interest rate has reached 2.91%. Meanwhile
post-image
SPYX0.00%
  • 7
  • 1
10.9 BTC ETH
After finding support at yesterday’s low of 80,300, it closed and traded around 81,800. Yesterday’s drop was purely due to macro pressure, compounded by the US once again talking about starting a war. Returning to the chart, the 4-hour timeframe should now have found support and stabilized, while buying volume remains very optimistic (Figure 1). I think attempting to position for longs here offers a very favorable risk-reward ratio. From the daily chart, yesterday’s support level was exactly where the previous rally to 87,000 began. (Figure 2)
Around 81,000, you can re-enter with
BTC-0.44%
$BTC The crypto market has once again seen a billion-dollar-scale wipeout!
Total liquidations over 24 hours surpassed $1 billion. Highly leveraged long and short positions were swept away one after another! It has been almost exactly one year since last year's epic liquidation. Will history repeat itself, or is the market preparing for a reversal? Over the past 24 hours, total liquidations across the crypto market have exceeded $1 billion. BTC led the decline, putting broad pressure on major coins, while a large number of highly leveraged positions were forced out amid sharp volatility. Even m
post-image
ZEC-5.79%
Last night’s Gate Gala dinner was truly unforgettable.
It wasn’t just an awards ceremony, but also a top-tier IRL meetup🍻
The venue was packed, every seat was taken, and the atmosphere was absolutely electric!
I listened carefully as @Dr. Han gave everyone a detailed breakdown of Gate Money, enjoyed the lively awards ceremony, and met so many new friends. I’m really so happy!🥳
  • 3
  • 2
market updates on today $BTC & $XAU
live-cover
LIVE1,917
First-Trade Rewards, Trade to Share a 30,000 USDT Prize Pool https://www.gate.com/campaigns/6426?ref_type=132
post-image
  • 1
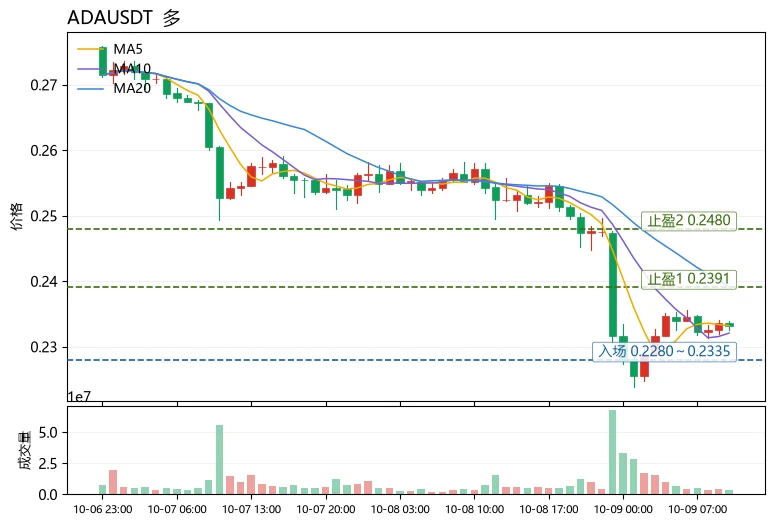
The Fear & Greed Index is still at 59 in the greed zone, so many people assume altcoins should follow the rise—but this is a typical trading misconception. The Greed Index reflects the overall market’s sentiment temperature, not a buy signal for any individual coin. When BTC trades sideways at highs and funds concentrate in a few sectors, coins lacking narrative support may instead bleed against the trend. ADA is a current example.
$ADA Current price: 0.2332, down 9.44% over 24h, with a trading volume of 69.5M USDT. Technically, MA5=0.23322 has fallen below MA20=0.239145, forming a bearish mo
post-image
ADA-7.36%
NEAR-10.51%
$UAI Breakout imminent! Technical indicators have all formed golden crosses—have you gotten on board? Where is the next target?#Gate.io 🔥🚀 #Gate广场中秋团圆局
UAI+14.99%
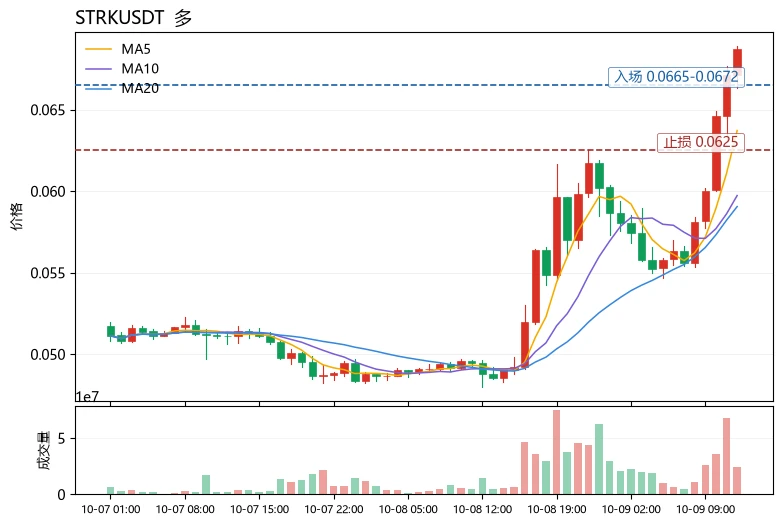
$STRK is the only asset in the current L2 sector to show independent strength. The outlook is bullish, but it is not advisable to chase at the current level; wait for a pullback.
The comparison is clear: during the same period, $UNI was down 5.91% over 24h and $NEAR was down 10.26%. Both have seen MA5 fall below MA20, while their RSI readings are only 43.9 and 47.4, respectively, indicating weak consolidation. Meanwhile, $STRK was up 39.13% over 24h, with MA5=0.063724 firmly above MA20=0.059057, a bullish moving-average alignment, and RSI=76.7 in the overbought zone but showing no bearish
post-image
STRK+34.78%
UNI-6.49%
NEAR-10.51%
gm frens
tgif 🎉
post-image
Load More

Join 40 M users in our growing community

⚡️ Join 40 M users in the crypto craze discussion

💬 Engage with your favorite top creators

👍 See what interests you

Trending Topics

GateAtTOKEN2049

35.16k Views20.76k Discussing

Gate brought a series of major events to TOKEN2049 Singapore! From the official launch of Gate Money to the F1 Red Bull driver meet-and-greet and the Gate Gala, we witnessed a new chapter of "One Gate, Borderless Finance." Which moment from TOKEN2049 stood out most to you?

BTC Pulls Back to 81000

25.4k Views35.67k Discussing

AIStocksFallALABDropsOver9%

24.57k Views548 Discussing

View More